


 |
市場調查報告書
商品編碼
2107345
幹細胞治療市場:幹細胞來源、起源、類型、分化細胞系、給藥途徑、治療領域、最終用戶及地區-趨勢及全球市場預測(至2035年)Stem Cell Therapy Market by Source of Stem Cell, Origin of Stem Cell, Type of Stem Cell, Lineage of Stem Cell, Route of Administration, Therapeutic Area, End Users and Geographical Regions - Trends and Global Forecast Till 2035 |
||||||

幹細胞療法市場概覽
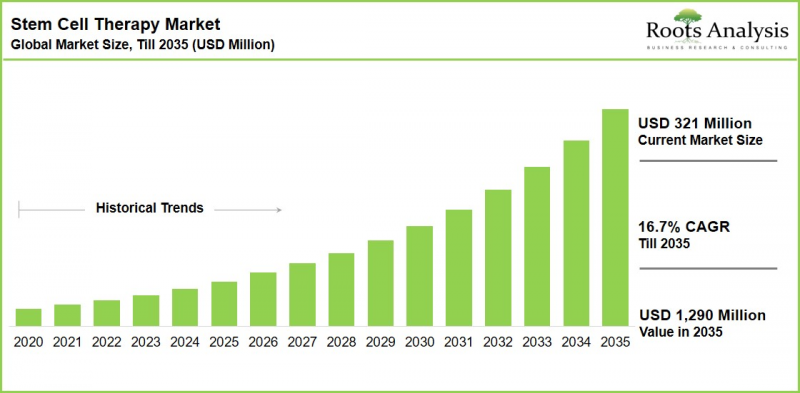
全球幹細胞治療市場預計將從今年的 3.21 億美元成長到 2035 年的 12.9 億美元,在整個預測期內實現 16.7% 的複合年成長率。
幹細胞治療市場:成長與趨勢
幹細胞療法是再生醫學領域最有前景的研究方向之一。這類療法利用幹細胞的固有能力,修復受損組織,恢復器官功能,並從根本解決疾病問題,而不僅僅是緩解症狀。最新數據顯示,全球超過一半的人口患有某種慢性疾病,這一沉重的負擔推動了人們對永續、能夠改善疾病進程的替代療法的需求。自1950年代首次骨髓移植以來,細胞生物學和再生醫學的進步加速了幹細胞療法的發展。這些療法旨在滿足多種疾病領域尚未滿足的醫療需求。
迄今為止,已有近25種幹細胞療法獲得美國食品藥物管理局(FDA)的批准。其中較知名的包括EYE-01M、Alofisel®、MACI、Stempeucel®和Strimvelis®。此外,全球120多家公司正在對超過280種幹細胞候選產品進行不同階段的評估。這項進展得益於活躍的臨床研發管線,該管線包含超過540項正在進行且已完成的臨床試驗,涉及全球超過52,000名患者。幹細胞療法的應用範圍現已涵蓋超過25個不同的治療領域,其中心血管疾病、神經系統疾病、肌肉骨骼疾病以及自體免疫/發炎性疾病正成為臨床和商業性研究的重點領域。
此外,監管機構對再生醫學的支持力道加大也對市場產生了正面影響。例如,美國食品藥物管理局(FDA)於2025年9月發布指導意見,旨在促進適應性試驗設計並加速細胞療法的核准流程。持續的資金流入、不斷壯大的契約製造(CMO)生態系統,以及在神經退化性疾病、心血管疾病和自體免疫疾病等適應症的後期臨床試驗中取得的積極成果,都增強了人們對幹細胞療法長期商業性潛力的信心。
成長驅動力:支持市場擴張的因素
市場成長的驅動力在於全球慢性病和退化性疾病負擔日益加重,而傳統的藥物介入措施主要只能緩解症狀,無法根治這些疾病。由此產生的未被滿足的需求,正推動著對能夠修復組織和器官功能的細胞再生醫學平台進行持續投資。日益有利的法規環境進一步增強了這一發展勢頭,北美、歐洲和日本的監管機構紛紛推出針對先進療法和細胞療法的快速核准途徑和適應性臨床試驗框架。
此外,幹細胞生產生態系統的成熟也為此提供了進一步的動力。專業合約研發生產機構(CDMO)的出現,使得即使是小規模研發公司也能擴大生產規模,而無需承擔自建生產基礎設施的負擔。來自美國國立衛生研究院(NIH)和加州再生醫學研究所(CIRM)等機構的政府和慈善資金持續推動早期研究的發展。同時,創業投資的增加也有助於將有前景的學術發現轉化為臨床階段的資產。
市場挑戰:阻礙進展的主要障礙
儘管前景光明,幹細胞療法市場仍面臨許多結構性挑戰。其中一個主要挑戰是幹細胞產品研發和生產過程中技術和營運的複雜性。這些療法需要專門的基礎設施、嚴格的品管和高技能人員,這使得中小企業難以進行研發工作,並延緩了產品研發的進程。
保險報銷的不確定性、療法研發和實施的高成本以及各地區不同的監管要求,進一步加劇了市場准入和商業化策略的複雜性。此外,該領域與胚胎幹細胞來源相關的倫理考量之間的歷史聯繫,持續影響著某些地區的推廣速度,強化了商業性對成人幹細胞衍生產品的相對偏好。綜上所述,這些因素凸顯了明確定義生產夥伴關係、制定健全的監管策略以及在市場參與企業之間進行差異化臨床定位的必要性。
幹細胞療法市場:關鍵洞察
本報告詳細分析了幹細胞治療市場的現狀,並為市場參與者指出了潛在的成長機會。主要發現包括:
- 在慢性病和退化性疾病負擔日益加重,以及傳統治療模式局限性的背景下,目前有 120 多家公司(包括業內和業外公司)正在致力於開發基於幹細胞的療法,評估處於不同開發階段的 280 多種候選產品。
- 迄今為止,已有近 25 種幹細胞療法獲得監管部門批准,其中包括 EYE-01M、Alofisel(R)、MACI、Stempeucel(R) 和 Strimvelis(R) 等傑出案例,這反映了從基礎研究到臨床應用的轉化途徑的成熟。
- 間質幹細胞是我們目前研發管線中研究最廣泛的細胞類型,因為它們具有優異的免疫調節特性、易於分離,並且在多個治療領域具有廣泛的應用前景。
- 目前,幹細胞療法的研發人員主要集中在心血管疾病、神經系統疾病、肌肉骨骼疾病和自體免疫/發炎性疾病,這些疾病加起來構成了他們研發管線的大部分活動。
- 迄今為止,已有超過540項評估新型幹細胞療法的臨床試驗啟動,涉及超過52,000名患者。這些研究大多在美國各地的醫療機構進行。
- 各國政府和慈善組織已向從事幹細胞治療計畫的研究機構提供了超過 6 億美元的津貼,凸顯了公共部門對該領域的持續投入。
- 目前,分佈在各個地區的 80 多家工業和非工業企業提供合約開發和生產 (CDMO) 服務,以滿足開發幹細胞療法的公司的特定需求。
- 預計在中長期內,基於骨髓來源的成人幹細胞的產品將繼續主導市場,而基於不同給藥途徑的新型微創療法的採用預計將穩步增加。
- 鑑於新型幹細胞治療候選藥物的充足供應、持續的研發投入以及監管的逐步明確,幹細胞治療市場預計將在 2035 年前保持兩位數的持續成長。
幹細胞治療市場細分
市場規模和機會分析是根據以下參數進行細分的:
幹細胞採集來源
- 順勢療法
- 自體療法
幹細胞的起源
- 成體幹細胞
- 胚胎幹細胞
幹細胞類型
- 造血幹細胞
- 間質幹細胞
- 前驅細胞
- 其他
分化幹細胞
- 脂肪組織來源的幹細胞
- 骨髓來源幹細胞
- 臍帶血幹細胞
透過行政途徑
- 關節內
- 冠狀動脈內部
- 肌肉內部
- 心肌內部
- 椎管內腔
- 靜脈
- 外科植入
- 其他
按治療區域
- 自體免疫/發炎性疾病
- 心血管疾病
- 代謝性疾病
- 肌肉骨骼疾病
- 腫瘤性疾病
- 神經系統疾病
- 眼科疾病
- 其他
最終用戶
- 門診手術中心
- 醫院
- 專科診所
按地區
- 北美洲
- 歐洲
- 亞太地區
- 其他地區
目錄
第1章:序言
第2章:調查方法
第3章 市場動態
第4章 宏觀經濟指標
第5章執行摘要
第6章:引言
第7章 市場狀況
第8章:公司簡介
- 章節概要
- Anterogen
- Athersys
- CHA Biotech
- Cytopeutics
- Hope Biosciences
- Mesoblast
- Pluristem Therapeutics
- Takeda Pharmaceutical
- TICEBA
第9章 主要治療領域
第10章:相對競爭與成長評估
第11章:學術研究津貼分析
第12章:臨床試驗分析
第13章:幹細胞製造市場現況及評估合約服務夥伴的關鍵績效指標
第14章:幹細胞療法開發公司和合約生產組織:機會評估
第15章 主要商業化策略
第16章:全球幹細胞治療市場
第17章:幹細胞療法市場(依幹細胞來源分類)
第18章 幹細胞治療市場(依幹細胞來源分類)
第19章:幹細胞療法市場(以幹細胞類型分類)
第20章 幹細胞治療市場(依分化系統分類)
第21章:幹細胞療法市場(依給藥途徑分類)
第22章 幹細胞治療市場(依治療領域分類)
第23章:幹細胞治療市場(依最終用戶分類)
第24章 幹細胞治療市場(依地區分類)
第25章 結論
第26章:高階主管洞察
第27章附錄一:表格形式數據
第28章 附錄二:公司與組織列表
STEM CELL THERAPY MARKET: OVERVIEW
As per Roots Analysis, the global stem cell therapy market is estimated to grow from USD 321 million in the current year to USD 1,290 million by 2035, registering a CAGR of 16.7% across the forecast period.
Stem Cell Therapy Market: Growth and Trends
Stem cell therapies represent one of the most promising frontiers within regenerative medicine. These therapies harness the innate ability of stem cells to replace damaged tissue, restore organ function and address the root cause of disease, rather than merely managing its symptoms. As per the recent data, more than 50% of the global population is currently living with some form of chronic illness, a burden that has intensified the search for durable, disease-modifying treatment alternatives. Since the first bone marrow transplant in the 1950s, advances in cell biology and regenerative medicine have accelerated the development of stem cell-based therapies. These interventions are designed to address unmet needs across a broad range of disease indications.
To date, close to 25 stem cell therapies have secured regulatory approval from the USFDA. Some notable examples include EYE-01M, Alofisel(R), MACI, Stempeucel(R) and Strimvelis(R). Additionally, more than 280 stem cell-based product candidates are being evaluated across various stages of development by over 120 industry players worldwide. Their progress is supported by an active clinical pipeline comprising more than 540 ongoing and completed trials involving over 52,000 patients globally. The applicability of stem cell therapies now spans more than 25 distinct therapeutic areas, with cardiovascular, neurological, musculoskeletal and autoimmune / inflammatory disorders emerging as the primary areas of clinical and commercial focus.
The market has also benefited from heightened regulatory support for regenerative therapies. For instance, the USFDA released guidance in September 2025 to promote adaptive trial designs and accelerated approval pathways for cell-based treatments. Continued capital inflows, an expanding contract manufacturing ecosystem, and positive late-stage clinical results across neurodegenerative, cardiovascular, and autoimmune indications are strengthening confidence in the long-term commercial potential of stem cell therapies.
Growth Drivers: Factors Fueling Market Expansion
Market growth is being propelled by the rising global burden of chronic and degenerative disorders for which conventional pharmacological interventions offer largely palliative, rather than curative, benefit. The consequent unmet need is driving sustained investment into cell-based regenerative platforms capable of restoring tissue and organ function. This momentum is further reinforced by an increasingly favorable regulatory climate, with agencies across North America, Europe and Japan introducing expedited review pathways and adaptive trial frameworks tailored specifically to advanced and cell-based therapies.
Additional impetus is being provided by the growing maturity of the stem cell manufacturing ecosystem. Further, the availability of specialized contract development and manufacturing organizations (CDMOs) is enabling smaller developers to scale production without the burden of establishing proprietary manufacturing infrastructure. Government and philanthropic funding from organizations such as the National Institutes of Health (NIH) and the California Institute for Regenerative Medicine continues to drive early-stage research. Meanwhile, growing venture capital investment is helping advance promising academic discoveries into clinical-stage assets.
Market Challenges: Critical Barriers Hindering Progress
Despite the encouraging outlook, the stem cell therapy market continues to contend with several structural challenges. A major challenge is the technical and operational complexity of developing and manufacturing stem cell-based products. These therapies require specialized infrastructure, stringent quality control, and highly skilled personnel, making development difficult for smaller companies and slowing pipeline advancement.
Reimbursement uncertainty, the high cost of therapy development and administration, and evolving regulatory expectations across geographies further complicate market entry and commercialization strategies. Additionally, the field's historical association with ethical considerations around embryonic stem cell sourcing continues to influence the pace of adoption in certain regions, reinforcing the relative commercial preference for adult stem cell-derived products. Collectively, these factors underscore the need for well-defined manufacturing partnerships, robust regulatory strategy and differentiated clinical positioning among market participants.
Stem Cell Therapy Market: Key Insights
The report delves into the current state of the stem cell therapy market and identifies potential growth opportunities for the market players. Some key findings include:
- Driven by the rising burden of chronic and degenerative disorders and the limitations of conventional treatment paradigms, more than 120 industry and non-industry players are currently engaged in the development of stem cell-based therapies, evaluating over 280 product candidates across various stages of development.
- Close to 25 stem cell therapies have received regulatory approval to date; notable examples include EYE-01M, Alofisel(R), MACI, Stempeucel(R) and Strimvelis(R), reflecting a maturing translational pathway from bench to bedside.
- Mesenchymal stem cells represent the most extensively investigated cell type within the current pipeline, owing to their favorable immunomodulatory profile, ease of isolation and broad applicability across multiple therapeutic areas.
- Cardiovascular, neurological, musculoskeletal and autoimmune / inflammatory disorders are presently the primary focus areas for stem cell therapy developers, collectively accounting for a majority of pipeline activity.
- More than 540 clinical trials evaluating novel stem cell therapies, enrolling over 52,000 patients, have been registered to date; a majority of these studies are being conducted at centers across the US.
- Over USD 600 million has been awarded in the form of grants by government and philanthropic bodies to research institutes engaged in stem cell therapy-related projects, underscoring sustained public sector commitment to this field.
- More than 80 industry and non-industry players, based across different regions, presently offer contract development and manufacturing services catering to the specific needs of stem cell therapy developers.
- Products based on bone marrow-derived adult stem cells are anticipated to continue dominating the market over the mid-to-long term, while adoption of therapies administered via novel and minimally invasive routes is expected to rise steadily.
- Given the robust pipeline of novel stem cell therapy candidates, sustained R&D investment and improving regulatory clarity, the stem cell therapy market is well-positioned to witness sustained double-digit growth through 2035.
Stem Cell Therapy Market Segments
The market sizing and opportunity analysis has been segmented across the following parameters:
By Source of Stem Cell
- Allogeneic Therapies
- Autologous Therapies
By Origin of Stem Cell
- Adult Stem Cells
- Embryonic Stem Cells
By Type of Stem Cell
- Hematopoietic Stem Cells
- Mesenchymal Stem Cells
- Progenitor Cells
- Others
By Lineage of Stem Cell
- Adipose Tissue Derived Stem Cells
- Bone Marrow Derived Stem Cells
- Cord Blood Derived Stem Cells
By Route of Administration
- Intraarticular
- Intracoronary
- Intramuscular
- Intramyocardial
- Intrathecal
- Intravenous
- Surgical Implantation
- Others
By Therapeutic Area
- Autoimmune / Inflammatory Disorders
- Cardiovascular Disorders
- Metabolic Disorders
- Musculoskeletal Disorders
- Oncological Disorders
- Neurological Disorders
- Ophthalmic Disorders
- Others
By End Users
- Ambulatory Surgery Centers
- Hospitals
- Specialty Clinics
By Geographical Regions
- North America
- Europe
- Asia-Pacific
- Rest of the World
Stem Cell Therapy Market: Key Segments
Allogeneic Therapies Poised to Gain Share of the Market in Future
Based on Roots Analysis market assessment, autologous approaches continue to command a high share of ongoing clinical activity owing to their favorable immunological profile, allogeneic "off-the-shelf", stem cell therapies are gaining momentum on account of their scalability, cost-efficiency and shorter turnaround time to patient administration. This shift is expected to play an important role in shaping commercial strategy among developers seeking to optimize manufacturing economics.
Mesenchymal Stem Cell (MSC)-Based Therapies Lead the Market
Based on the Roots Analysis market report, mesenchymal stem cell (MSC)-based therapies currently hold the highest share as it represents the most active area of pipeline development. This growing pipeline of mesenchymal stem cell-based drugs reflects their well-documented immunomodulatory and regenerative properties. Additionally, relative ease of isolation from multiple tissue sources, and broad applicability across autoimmune, orthopedic and cardiovascular indications.
North America Expected to Retain Market Leadership
North America is projected to remain the largest regional market for stem cell therapies through 2035. This dominance is supported by a well-established regenerative medicine ecosystem, a high concentration of therapy developers and CDMOs, favorable reimbursement dynamics for advanced therapies, and continued grant funding from bodies such as the NIH.
Asia-Pacific to Emerge as a Highest Growing Regional Market
The Asia-Pacific stem cell therapy market is anticipated to register higher CAGR over the forecast period. This growth is driven by an expanding base of domestic developers, increasing clinical trial activity, improving regulatory clarity in key markets such as Japan and South Korea, and rising healthcare investment across the region.
Example Players in Stem Cell Therapy Market
- Anterogen
- Athersys
- CHA Biotech
- Cytopeutics
- Hope Biosciences
- Mesoblast
- Pluristem Therapeutics
- Takeda Pharmaceutical
- TICEBA
Expert Interview and Industry Insights
The opinions and insights presented in this study have been influenced by discussions conducted with multiple industry stakeholders. The research report features detailed transcripts of interviews held with, among others, the following industry representatives:
- Founder and Chief Executive Officer, Seraxis
- Chief Executive Officer, Xcelthera
- Co-Founder and Chief Scientist, Kadimastem
- Director and Chief Operating Officer, Heartseed
- Director and Chairman, Department of Cardiac Surgery, University of Rostock
- President, Bio Elpida
- Professor and American Red Cross Chair in Transfusion Medicine, University of Minnesota
- Manager of Business Development, Waisman Biomanufacturing
- Department Leader, Cell Therapy Innovation and Development, YposKesi
STEM CELL THERAPY MARKET: RESEARCH COVERAGE
- Market Sizing and Opportunity Analysis: An in-depth, top-down analysis of the global stem cell therapy market, covering key segments including source of stem cell, origin of stem cell, type of stem cell, lineage of stem cell, route of administration, therapeutic area, end users and geographical regions.
- Market Introduction: A review of the historical evolution of stem cell research, classification of stem cells (by source, origin and potency), modes of administration, applications and associated development challenges, alongside a summary of regulatory guidelines across North America, Europe and Japan.
- Market Landscape: A comprehensive assessment of the marketed and clinical-stage stem cell therapy pipeline, analyzed by phase of development, source, origin, type, lineage and potency of stem cell, target indication, therapeutic area and route of administration, supported by tree map, heptagon, grid and world map representations of industry activity.
- Company Profiles: In-depth profiles of prominent players engaged in the stem cell therapy domain, featuring information on year of establishment, location of headquarters, company size, product portfolio and recent developments.
- Key Therapeutic Areas: A disease-specific assessment of over 20 target indications spanning autoimmune / inflammatory, cardiovascular, dermatological, metabolic, oncological and neurological disorders, including epidemiology, current treatment options and the corresponding stem cell therapy pipeline.
- Assessment of Relative Competition and Growth: A proprietary 2X2 framework evaluating existing competition and growth opportunity across established and emerging therapeutic areas, within both established and emerging geographies.
- Academic Grants Analysis: An analysis of grants awarded by the National Institutes of Health (NIH) for stem cell therapy-related research, based on year of award, amount awarded, funding mechanism, therapeutic area, and recipient organization, along with a multivariate grant attractiveness analysis.
- Clinical Trial Analysis: An analysis of completed, ongoing and planned clinical trials, based on trial registration year, phase, recruitment status, sponsor / collaborator type, study design, patient enrollment, therapeutic area and geography.
- Stem Cell Manufacturing Landscape and CDMO Evaluation: A review of the contract manufacturing landscape for stem cell therapies, featuring information on industry and non-industry CDMOs (by year of establishment, company size, scale of manufacturing, services offered and location), along with a KPI framework for evaluating prospective manufacturing partners.
- Developers and CMOs: Opportunity Assessment: A gap analysis comparing the clinical and commercial capabilities of therapy developers against the availability of contract manufacturing capacity, across North America, Europe and Asia-Pacific / Rest of the World.
- Key Commercialization Strategies: An assessment of strategies adopted by developers before and after therapy approval, including profiles of key approved stem cell therapies and an evaluation of opportunities and challenges associated with unapproved therapies.
- Market Sizing and Forecast, By Segment and Geography: Historical trends (since 2020) and forecasted estimates (till 2035) for the global stem cell therapy market, distributed by source, origin, type and lineage of stem cell, route of administration, therapeutic area, end users and geographical regions, supported by conservative, base and optimistic scenario analyses.
Key Questions Answered in this Report
- What is the current, and expected future, size of the stem cell therapy market?
- What is the anticipated CAGR of the stem cell therapy market during the forecast period, till 2035?
- Which are the leading companies engaged in the development of stem cell therapies?
- Which source, origin and type of stem cell is likely to dominate the market during the forecast period?
- Which therapeutic area offers the most attractive growth opportunity for stem cell therapy developers?
- Which region is likely to lead the stem cell therapy market, and which region is expected to grow the fastest?
- What are the key drivers, restraints, opportunities and challenges shaping this market?
- What is the prevailing contract manufacturing landscape for stem cell therapy developers, and which KPIs matter most when selecting a manufacturing partner?
Reasons to Buy this Report
This report is designed to give distributors, channel partners, and investors a decisive analytical edge in a fast-consolidating market. Its core differentiators include:
- The report provides a comprehensive, top-down market analysis, offering detailed revenue projections for the overall market and its specific sub-segments, valuable to both established market leaders and emerging entrants.
- It offers stakeholders a comprehensive overview of the market, including key drivers, barriers, opportunities and challenges, empowering data-driven strategic decision-making.
- It aids businesses in identifying and validating future growth opportunities across therapeutic areas and geographies.
- It supports the identification of unmet patient and customer demand by mapping the needs, preferences and behavior of key stakeholder groups.
- It equips new entrants with the requisite market intelligence to design and execute successful go-to-market and commercialization strategies.
- It enables more effective communication with investors, partners and other stakeholders, supporting the development of stronger business relationships.
Additional Benefits
- Complementary PPT Insights Pack
- Complementary Excel Data Packs for all Analytical Modules in the Report
- 15% Free Content Customization
- Detailed Report Walkthrough Session with Research Team
- Free Updated report if the report is 6-12 months old or older
TABLE OF CONTENTS
1. PREFACE
- 1.1. Introduction
- 1.2. Market Share Insights
- 1.3. Key Market Insights
- 1.4. Report Coverage
- 1.5. Key Questions Answered
- 1.6. Chapter Outlines
2. RESEARCH METHODOLOGY
- 2.1. Chapter Overview
- 2.2. Research Assumptions
- 2.2.1. Market Landscape and Market Trends
- 2.2.2. Market Forecast and Opportunity Analysis
- 2.2.3. Comparative Analysis
- 2.3. Database Building
- 2.3.1. Data Collection
- 2.3.2. Data Validation
- 2.3.3. Data Analysis
- 2.4. Project Methodology
- 2.4.1. Secondary Research
- 2.4.1.1. Annual Reports
- 2.4.1.2. Academic Research Papers
- 2.4.1.3. Company Websites
- 2.4.1.4. Investor Presentations
- 2.4.1.5. Regulatory Filings
- 2.4.1.6. White Papers
- 2.4.1.7. Industry Publications
- 2.4.1.8. Conferences and Seminars
- 2.4.1.9. Government Portals
- 2.4.1.10. Media and Press Releases
- 2.4.1.11. Newsletters
- 2.4.1.12. Industry Databases
- 2.4.1.13. Roots Proprietary Databases
- 2.4.1.14. Paid Databases and Sources
- 2.4.1.15. Social Media Portals
- 2.4.1.16. Other Secondary Sources
- 2.4.2. Primary Research
- 2.4.2.1. Types of Primary Research
- 2.4.2.1.1. Qualitative Research
- 2.4.2.1.2. Quantitative Research
- 2.4.2.1.3. Hybrid Approach
- 2.4.2.2. Advantages of Primary Research
- 2.4.2.3. Techniques for Primary Research
- 2.4.2.3.1. Interviews
- 2.4.2.3.2. Surveys
- 2.4.2.3.3. Focus Groups
- 2.4.2.3.4. Observational Research
- 2.4.2.3.5. Social Media Interactions
- 2.4.2.4. Key Opinion Leaders Considered in Primary Research
- 2.4.2.4.1. Company Executives (CXOs)
- 2.4.2.4.2. Board of Directors
- 2.4.2.4.3. Company Presidents and Vice Presidents
- 2.4.2.4.4. Research and Development Heads
- 2.4.2.4.5. Technical Experts
- 2.4.2.4.6. Subject Matter Experts
- 2.4.2.4.7. Scientists
- 2.4.2.4.8. Doctors and Other Healthcare Providers
- 2.4.2.5. Ethics and Integrity
- 2.4.2.5.1. Research Ethics
- 2.4.2.5.2. Data Integrity
- 2.4.2.1. Types of Primary Research
- 2.4.3. Analytical Tools and Databases
- 2.4.1. Secondary Research
- 2.5. Robust Quality Control
3. MARKET DYNAMICS
- 3.1. Chapter Overview
- 3.2. Forecast Methodology
- 3.2.1. Top-down Approach
- 3.2.2. Bottom-up Approach
- 3.2.3. Hybrid Approach
- 3.3. Market Assessment Framework
- 3.3.1. Total Addressable Market (TAM)
- 3.3.2. Serviceable Addressable Market (SAM)
- 3.3.3. Serviceable Obtainable Market (SOM)
- 3.3.4. Currently Acquired Market (CAM)
- 3.4. Forecasting Tools and Techniques
- 3.4.1. Qualitative Forecasting
- 3.4.2. Correlation
- 3.4.3. Regression
- 3.4.4. Extrapolation
- 3.4.5. Convergence
- 3.4.6. Sensitivity Analysis
- 3.4.7. Scenario Planning
- 3.4.8. Data Visualization
- 3.4.9. Time Series Analysis
- 3.4.10. Forecast Error Analysis
- 3.5. Key Considerations
- 3.5.1. Demographics
- 3.5.2. Government Regulations
- 3.5.3. Reimbursement Scenarios
- 3.5.4. Market Access
- 3.5.5. Supply Chain
- 3.5.6. Industry Consolidation
- 3.5.7. Pandemic / Unforeseen Disruptions Impact
- 3.6. Limitations
4. MACRO-ECONOMIC INDICATORS
- 4.1. Chapter Overview
- 4.2. Market Dynamics
- 4.2.1. Time Period
- 4.2.1.1. Historical Trends
- 4.2.1.2. Current and Forecasted Estimates
- 4.2.2. Currency Coverage
- 4.2.2.1. Major Currencies Affecting the Market
- 4.2.2.2. Factors Affecting Currency Fluctuations
- 4.2.2.3. Impact of Currency Fluctuations on the Industry
- 4.2.3. Foreign Currency Exchange Rate
- 4.2.3.1. Impact of Foreign Exchange Rate Volatility on the Market
- 4.2.3.2. Strategies for Mitigating Foreign Exchange Risk
- 4.2.4. Recession
- 4.2.4.1. Assessment of Current Economic Conditions and Potential Impact on the Market
- 4.2.4.2. Historical Analysis of Past Recessions and Lessons Learnt
- 4.2.5. Inflation
- 4.2.5.1. Measurement and Analysis of Inflationary Pressures in the Economy
- 4.2.5.2. Potential Impact of Inflation on the Market Evolution
- 4.2.6. Interest Rates
- 4.2.6.1. Interest Rates and Their Impact on the Market
- 4.2.6.2. Strategies for Managing Interest Rate Risk
- 4.2.7. Commodity Flow Analysis
- 4.2.7.1. Type of Commodity
- 4.2.7.2. Origins and Destinations
- 4.2.7.3. Values and Weights
- 4.2.7.4. Modes of Transportation
- 4.2.8. Global Trade Dynamics
- 4.2.8.1. Import Scenario
- 4.2.8.2. Export Scenario
- 4.2.8.3. Trade Policies
- 4.2.8.4. Strategies for Mitigating the Risks Associated with Trade Barriers
- 4.2.8.5. Impact of Trade Barriers on the Market
- 4.2.9. War Impact Analysis
- 4.2.9.1. Russian-Ukraine War
- 4.2.9.2. Israel-Hamas War
- 4.2.10. COVID Impact / Related Factors
- 4.2.10.1. Global Economic Impact
- 4.2.10.2. Industry-specific Impact
- 4.2.10.3. Government Response and Stimulus Measures
- 4.2.10.4. Future Outlook and Adaptation Strategies
- 4.2.11. Other Indicators
- 4.2.11.1. Fiscal Policy
- 4.2.11.2. Consumer Spending
- 4.2.11.3. Gross Domestic Product
- 4.2.11.4. Employment
- 4.2.11.5. Taxes
- 4.2.11.6. Stock Market Performance
- 4.2.11.7. Cross Border Dynamics
- 4.2.1. Time Period
- 4.3. Conclusion
5. EXECUTIVE SUMMARY
6. INTRODUCTION
- 6.1. Chapter Overview
- 6.2. Overview of Stem Cell Therapies
- 6.2.1. Historical Evolution of Stem Cell Research
- 6.2.2. Classification of Stem Cells
- 6.2.2.1. Based on Source of Stem Cell
- 6.2.2.2. Based on Origin of Stem Cell
- 6.2.2.3. Based on Potency of Stem Cell
- 6.2.3. Administration of Stem Cell Therapies
- 6.2.4. Applications of Stem Cell Therapies
- 6.2.5. Challenges Associated with Development of Stem Cell Therapies
- 6.3. Regulatory Guidelines for Stem Cell Therapies
- 6.3.1. Current Scenario
- 6.3.2. Regulatory Guidelines in North America
- 6.3.3. Regulatory Guidelines in Europe
- 6.3.4. Regulatory Guidelines in Japan
- 6.4. Prevalent Trends Related to Stem Cell Therapies
- 6.4.1. Emerging Focus Areas
- 6.4.2. Key Historical Trends
- 6.4.3. Geographical Activity
- 6.5. Growth Drivers and Roadblocks
7. MARKET LANDSCAPE
- 7.1. Chapter Overview
- 7.2. Stem Cell Therapies: Marketed and Development Pipeline
- 7.2.1. Analysis by Phase of Development
- 7.2.2. Analysis by Source of Stem Cell
- 7.2.3. Analysis by Origin of Stem Cell
- 7.2.4. Analysis by Type of Stem Cell
- 7.2.5. Analysis by Lineage of Stem Cell
- 7.2.6. Analysis by Potency of Stem Cell
- 7.2.7. Analysis by Target Indication
- 7.2.8. Analysis by Therapeutic Area
- 7.2.9. Analysis by Route of Administration
- 7.3. Stem Cell Therapies: Additional Information
- 7.3.1. Information on Dosage and Commercial Rights
- 7.3.2. Information on Designations Awarded
- 7.4. Stem Cell Therapies: List of Technology Platforms
- 7.5. Stem Cell Therapies: List of Therapy Developers
- 7.5.1. Analysis by Year of Establishment
- 7.5.2. Analysis by Company Size
- 7.5.3. Analysis by Location of Headquarters
- 7.5.4. Analysis by Company Size and Location of Headquarters
- 7.5.5. Leading Drug Developers: Analysis by Number of Stem Cell Therapies
- 7.5.6. Leading Drug Developers: 4D Bubble Analysis based on Strength of Pipeline, Target Indication and Company Size
- 7.6. Heptagon Representation: Analysis by Phase of Development and Key Therapeutic Area
- 7.7. Grid Representation: Analysis by Phase of Development, Source of Stem Cell and Therapeutic Area
- 7.8. Tree Map Representation: Analysis by Therapeutic Area and Size of the Company
- 7.9. World Map Representation: Analysis of Regional Activity
8. COMPANY PROFILES
- 8.1. Chapter Overview
- 8.1.1. Anterogen
- 8.1.1.1. Company Overview
- 8.1.1.2. Product Portfolio
- 8.1.1.3. Recent Developments and Future Outlook
- 8.1.2. Athersys
- 8.1.3. CHA Biotech
- 8.1.4. Cytopeutics
- 8.1.5. Hope Biosciences
- 8.1.6. Mesoblast
- 8.1.7. Pluristem Therapeutics
- 8.1.8. Takeda Pharmaceutical
- 8.1.9. TICEBA
- 8.1.1. Anterogen
9. KEY THERAPEUTIC AREAS
- 9.1. Chapter Overview
- 9.2. Autoimmune / Inflammatory Disorders
- 9.2.1. Crohn's Disease
- 9.2.1.1. Disease Description
- 9.2.1.2. Epidemiology
- 9.2.1.3. Current Treatment Options
- 9.2.1.4. Side Effects of Current Treatment Options
- 9.2.1.5. Stem Cell Therapies for Crohn's Disease
- 9.2.2. Ulcerative Colitis
- 9.2.2.1. Disease Description
- 9.2.2.2. Epidemiology
- 9.2.2.3. Current Treatment Options
- 9.2.2.4. Side Effects of Current Treatment Options
- 9.2.2.5. Stem Cell Therapies for Ulcerative Colitis
- 9.2.1. Crohn's Disease
- 9.3. Cardiovascular Disorders
- 9.3.1. Critical Limb Ischemia
- 9.3.1.1. Disease Description
- 9.3.1.2. Epidemiology
- 9.3.1.3. Current Treatment Options
- 9.3.1.3.1. Pharmacological Interventions
- 9.3.1.3.2. Endovascular Treatments
- 9.3.1.3.3. Surgical Interventions
- 9.3.1.4. Stem Cell Therapies for Critical Limb Ischemia
- 9.3.2. Heart Failure
- 9.3.2.1. Disease Description
- 9.3.2.2. Epidemiology
- 9.3.2.3. Current Treatment Options
- 9.3.2.3.1. Pharmacological Interventions
- 9.3.2.3.2. Therapeutic Devices
- 9.3.2.3.3. Surgical Interventions
- 9.3.2.4. Stem Cell Therapies for Heart Failure
- 9.3.3. Myocardial Infarction
- 9.3.3.1. Disease Description
- 9.3.3.2. Epidemiology
- 9.3.3.3. Current Treatment Options
- 9.3.3.3.1. Pharmacological Interventions
- 9.3.3.3.2. Surgical Interventions
- 9.3.3.4. Stem Cell Therapies for Myocardial Infarction
- 9.3.1. Critical Limb Ischemia
- 9.4. Dermatological Disorders
- 9.4.1. Acne Vulgaris
- 9.4.1.1. Disease Description
- 9.4.1.2. Epidemiology
- 9.4.1.3. Current Treatment Options
- 9.4.1.4. Side Effects of Current Treatment Options
- 9.4.1.5. Stem Cell Therapies for Acne Vulgaris
- 9.4.1. Acne Vulgaris
- 9.5. Metabolic Disorders
- 9.5.1. Diabetes
- 9.5.1.1. Disease Description
- 9.5.1.2. Associated Health Risks / Complications
- 9.5.1.3. Epidemiology
- 9.5.1.4. Disease Diagnosis
- 9.5.1.5. Current Treatment Options
- 9.5.1.5.1. Insulin Therapies
- 9.5.1.5.2. Non-Insulin Therapies
- 9.5.1.6. Side Effects of Current Treatment Options
- 9.5.1.7. Stem Cell Therapies for Diabetes
- 9.5.2. Non-alcoholic Steatohepatitis (NASH)
- 9.5.2.1. Disease Description
- 9.5.2.2. Epidemiology
- 9.5.2.3. Current Treatment Options
- 9.5.2.4. Stem Cell Therapies for NASH
- 9.5.1. Diabetes
- 9.6. Oncological Disorders
- 9.6.1. Bladder Cancer
- 9.6.1.1. Disease Description
- 9.6.1.2. Epidemiology
- 9.6.1.3. Current Treatment Options
- 9.6.1.4. Stem Cell Therapies for Bladder Cancer
- 9.6.2. Breast Cancer
- 9.6.2.1. Disease Description
- 9.6.2.2. Epidemiology
- 9.6.2.3. Current Treatment Options
- 9.6.2.4. Stem Cell Therapies for Breast Cancer
- 9.6.3. Colorectal Cancer
- 9.6.3.1. Disease Description
- 9.6.3.2. Epidemiology
- 9.6.3.3. Current Treatment Options
- 9.6.3.4. Side Effects of Current Treatment Options
- 9.6.3.5. Stem Cell Therapies for Colorectal Cancer
- 9.6.4. Kidney Cancer
- 9.6.4.1. Disease Description
- 9.6.4.2. Epidemiology
- 9.6.4.3. Current Treatment Options
- 9.6.4.4. Stem Cell Therapies for Kidney Cancer
- 9.6.5. Liver Cancer
- 9.6.5.1. Introduction
- 9.6.5.2. Epidemiology
- 9.6.5.3. Current Treatment Options
- 9.6.5.4. Stem Cell Therapies for Liver Cancer
- 9.6.6. Lung Cancer
- 9.6.6.1. Disease Description
- 9.6.6.2. Epidemiology
- 9.6.6.3. Current Treatment Options
- 9.6.6.4. Side Effects of Current Treatment Options
- 9.6.6.5. Stem Cell Therapies for Lung Cancer
- 9.6.7. Ovarian Cancer
- 9.6.7.1. Disease Description
- 9.6.7.2. Epidemiology
- 9.6.7.3. Current Treatment Options
- 9.6.7.4. Stem Cell Therapies for Ovarian Cancer
- 9.6.8. Pancreatic Cancer
- 9.6.8.1. Disease Description
- 9.6.8.2. Epidemiology
- 9.6.8.3. Current Treatment Options
- 9.6.8.4. Stem Cell Based Therapies for Pancreatic Cancer
- 9.6.1. Bladder Cancer
- 9.7. Neurological Disorders
- 9.7.1. Alzheimer's Disease
- 9.7.1.1. Disease Description
- 9.7.1.2. Epidemiology
- 9.7.1.3. Symptoms of the Disease
- 9.7.1.4. Causes of Alzheimer's Disease
- 9.7.1.5. Stages of Alzheimer's Disease
- 9.7.1.6. Current Treatment Options
- 9.7.1.7. Stem Cell Therapies for Alzheimer's Disease
- 9.7.2. Parkinson's Disease
- 9.7.2.1. Disease Description
- 9.7.2.2. Epidemiology
- 9.7.2.3. Current Treatment Options
- 9.7.2.3.1. Pharmacological Management of Parkinson's Disease
- 9.7.2.3.2. Non-Pharmacological Management of Parkinson's Disease
- 9.7.2.3.3. Management of Parkinson's Disease Using Dietary Supplements
- 9.7.2.4. Stem Cell Therapies for Parkinson's Disease
- 9.7.1. Alzheimer's Disease
10. ASSESSMENT OF RELATIVE COMPETITION AND GROWTH
- 10.1. Chapter Overview
- 10.2. Assumptions and Methodology
- 10.3. Analysis of Relative Competition and Growth Opportunities
- 10.3.1. Established Therapeutic Areas in Emerging Regions
- 10.3.2. Established Therapeutic Areas in Established Regions
- 10.3.3. Emerging Therapeutic Areas in Emerging Regions
- 10.3.4. Emerging Therapeutic Areas in Established Regions
11. ACADEMIC GRANTS ANALYSIS
- 11.1. Chapter Overview
- 11.2. Scope and Methodology
- 11.3. Stem Cell Therapies: Analysis of Grants Awarded by the National Institutes of Health (NIH)
- 11.3.1. Analysis by Year of Award
- 11.3.2. Analysis by Amount Awarded
- 11.3.3. Analysis by Administering Institute Center
- 11.3.4. Analysis by Funding Institute Center
- 11.3.5. Analysis by Support Period
- 11.3.6. Analysis by Funding Institute Center and Support Period
- 11.3.7. Most Popular NIH Spending Categorizations
- 11.3.8. Analysis by Funding Mechanism
- 11.3.9. Emerging Focus Areas
- 11.3.10. Analysis by Source of Stem Cell
- 11.3.11. Analysis by Origin of Stem Cell
- 11.3.12. Analysis by Type of Stem Cell
- 11.3.13. Analysis by Lineage of Stem Cell
- 11.3.14. Analysis by Potency of Stem Cell
- 11.3.15. Analysis by Therapeutic Area
- 11.3.16. Analysis by Type of Grant Application
- 11.3.17. Popular NIH Departments
- 11.3.18. Analysis by Study Section
- 11.3.19. Analysis by Types of Recipient Organizations
- 11.3.20. Popular Recipient Organizations
- 11.3.21. Analysis by Grant Mechanism
- 11.3.22. Prominent Program Officers
- 11.3.23. Regional Distribution of Recipient Organizations
- 11.4. Grant Attractiveness Analysis
12. CLINICAL TRIAL ANALYSIS
- 12.1. Chapter Overview
- 12.2. Scope and Methodology
- 12.3. Stem Cell Therapies: Clinical Trial Analysis
- 12.3.1. Analysis by Trial Registration Year
- 12.3.2. Analysis by Trial Phase
- 12.3.3. Analysis by Number of Patients Enrolled by Trial Registration Year
- 12.3.4. Analysis by Study Design
- 12.3.5. Analysis by Trial Recruitment Status
- 12.3.6. Analysis by Sponsor / Collaborator
- 12.3.7. Leading Industry Sponsors: Based on Number of Registered Trials
- 12.3.8. Analysis by Trial Focus
- 12.3.9. Analysis by Type of Stem Cell
- 12.3.10. Analysis by Therapeutic Area
- 12.3.11. Analysis by Type of Stem Cell and Therapeutic Area
- 12.3.12. Geographical Analysis by Number of Clinical Trials
- 12.3.13. Geographical Analysis by Trial Recruitment Status
- 12.3.14. Geographical Analysis by Enrolled Patient Population
13. STEM CELL MANUFACTURING MARKET LANDSCAPE AND KPIs FOR EVALUATING CONTRACT SERVICES PARTNERS
- 13.1. Chapter Overview
- 13.2. Stem Cell Therapy Manufacturing
- 13.2.1. Need for Stem Cell Therapy Contract Manufacturing
- 13.2.2. Advantages of Outsourcing Stem Cell Therapy Manufacturing
- 13.2.3. Guidelines for Selecting a Contract Manufacturing Organization (CMO) Partner
- 13.2.4. Stem Cell Therapy CMOs: List of Industry Players
- 13.2.4.1. Analysis by Year of Establishment
- 13.2.4.2. Analysis by Company Size
- 13.2.4.3. Analysis by Scale of Stem Cell Manufacturing
- 13.2.4.4. Analysis by Location of Headquarters
- 13.2.4.5. Analysis by Location of Manufacturing Facilities
- 13.2.4.6. Analysis by Types of Services Offered
- 13.2.4.7. Analysis by Source and Origin of Stem Cell
- 13.2.5. Stem Cell Therapy CMOs: List of Non-industry Players
- 13.2.5.1. Analysis by Year of Establishment
- 13.2.5.2. Analysis by Scale of Stem Cell Manufacturing
- 13.2.5.3. Analysis by Location of Headquarters
- 13.2.5.4. Analysis by Location of Manufacturing Facilities
- 13.2.5.5. Analysis by Types of Services Offered
- 13.2.5.6. Analysis by Source and Origin Stem Cell
- 13.3. Stem Cell Therapy Manufacturing: KPI Analysis
- 13.3.1. KPI Definitions
- 13.3.1.1. Financial Indicators
- 13.3.1.1.1. Big Pharma Perspective
- 13.3.1.1.2. Contract Manufacturers' Perspective
- 13.3.1.2. Process and Capability Indicators
- 13.3.1.2.1. Big Pharma Perspective
- 13.3.1.2.2. Contract Manufacturers' Perspective
- 13.3.1.3. Market Reputation Indicators
- 13.3.1.3.1. Big Pharma Perspective
- 13.3.1.3.2. Contract Manufacturers' Perspective
- 13.3.1.1. Financial Indicators
- 13.3.1. KPI Definitions
- 13.4. Concluding Remarks
14. STEM CELL THERAPY DEVELOPERS AND CMOs: OPPORTUNITY ASSESSMENT
- 14.1. Chapter Overview
- 14.2. Therapy Developers and CMOs in North America
- 14.2.1. Gap Analysis by Scale of Stem Cell Manufacturing
- 14.2.2. Gap Analysis by Source of Stem Cell
- 14.2.3. Gap Analysis by Origin of Stem Cell
- 14.3. Therapy Developers and CMOs in Europe
- 14.3.1. Gap Analysis by Scale of Stem Cell Manufacturing
- 14.3.2. Gap Analysis by Source of Stem Cell
- 14.3.3. Gap Analysis by Origin of Stem Cell
- 14.4. Therapy Developers and CMOs in Asia-Pacific and Rest of the World
- 14.4.1. Gap Analysis by Scale of Stem Cell Manufacturing
- 14.4.2. Gap Analysis by Source of Stem Cell
- 14.4.3. Gap Analysis by Origin of Stem Cell
- 14.5. Concluding Remarks
15. KEY COMMERCIALIZATION STRATEGIES
- 15.1. Chapter Overview
- 15.2. Successful Drug Launch Strategy: ROOTS Framework
- 15.3. Successful Drug Launch Strategy: Product Differentiation
- 15.4. Commonly Adopted Commercialization Strategies based on Stage of Product Development
- 15.5. Key Approved Stem Cell Therapies: Profiles
- 15.5.1. CARTISTEM(R)
- 15.5.2. HiQCell(R)
- 15.5.3. Prochymal(R)
- 15.5.4. Strimvelis(R)
- 15.6. Key Commercialization Strategies Adopted by Stem Cell Therapy Developers
- 15.6.1. Strategies Adopted before Therapy Approval
- 15.6.1.1. Participation in Global Events
- 15.6.1.2. Collaboration with Stakeholders and Pharmaceutical Firms
- 15.6.1.3. Seeking Approval for Multiple Target Indications
- 15.6.1.4. Seeking Special Therapy Designations and Other Credentials
- 15.6.1.5. Leveraging Uniqueness to Establish Competitive Edge
- 15.6.1.6. Anticipation of Likely Market Dynamics and Trends
- 15.6.1.7. Outsourcing Manufacturing Operations
- 15.6.2. Strategies Adopted Post Therapy Approval
- 15.6.2.1. Geographical Expansion
- 15.6.2.2. Participation in Global Events
- 15.6.2.3. Patient Assistance Programs
- 15.6.2.4. Miscellaneous Programs
- 15.6.1. Strategies Adopted before Therapy Approval
- 15.7. Opportunities and Challenges with Unapproved Therapies
- 15.8. Concluding Remarks
16. GLOBAL STEM CELL THERAPY MARKET
- 16.1. Chapter Overview
- 16.2. Key Assumptions and Methodology
- 16.3. Stem Cell Therapy Market, Historical Trends (Since 2020) and Forecasted Estimates (Till 2035)
- 16.3.1. Scenario Analysis
- 16.3.1.1. Conservative Scenario
- 16.3.1.2. Base Scenario
- 16.3.1.3. Optimistic Scenario
- 16.3.2. Key Market Segmentations
- 16.3.1. Scenario Analysis
- 16.4. Data Triangulation and Validation
17. STEM CELL THERAPY MARKET, BY SOURCE OF STEM CELL
- 17.1. Chapter Overview
- 17.2. Key Assumptions and Methodology
- 17.3. Stem Cell Therapy Market: Distribution by Source of Stem Cell
- 17.3.1. Stem Cell Therapy Market for Allogeneic Therapies, Historical Trends (Since 2020) and Forecasted Estimates (Till 2035)
- 17.3.2. Stem Cell Therapy Market for Autologous Therapies, Historical Trends (Since 2020) and Forecasted Estimates (Till 2035)
- 17.4. Data Triangulation and Validation
18. STEM CELL THERAPY MARKET, BY ORIGIN OF STEM CELL
- 18.1. Chapter Overview
- 18.2. Key Assumptions and Methodology
- 18.3. Stem Cell Therapy Market: Distribution by Origin of Stem Cell
- 18.3.1. Stem Cell Therapy Market for Adult Stem Cells, Historical Trends (Since 2020) and Forecasted Estimates (Till 2035)
- 18.3.2. Stem Cell Therapy Market for Embryonic Stem Cells, Historical Trends (Since 2020) and Forecasted Estimates (Till 2035)
- 18.4. Data Triangulation and Validation
19. STEM CELL THERAPY MARKET, BY TYPE OF STEM CELL
- 19.1. Chapter Overview
- 19.2. Key Assumptions and Methodology
- 19.3. Stem Cell Therapy Market: Distribution by Type of Stem Cell
- 19.3.1. Stem Cell Therapy Market for Hematopoietic Stem Cells, Historical Trends (Since 2020) and Forecasted Estimates (Till 2035)
- 19.3.2. Stem Cell Therapy Market for Mesenchymal Stem Cells, Historical Trends (Since 2020) and Forecasted Estimates (Till 2035)
- 19.3.3. Stem Cell Therapy Market for Progenitor Cells, Historical Trends (Since 2020) and Forecasted Estimates (Till 2035)
- 19.3.4. Stem Cell Therapy Market for Other Stem Cells, Historical Trends (Since 2020) and Forecasted Estimates (Till 2035)
- 19.4. Data Triangulation and Validation
20. STEM CELL THERAPY MARKET, BY LINEAGE OF STEM CELL
- 20.1. Chapter Overview
- 20.2. Key Assumptions and Methodology
- 20.3. Stem Cell Therapy Market: Distribution by Lineage of Stem Cell
- 20.3.1. Stem Cell Therapy Market for Adipose Tissue Derived Stem Cells, Historical Trends (Since 2020) and Forecasted Estimates (Till 2035)
- 20.3.2. Stem Cell Therapy Market for Bone Marrow Derived Stem Cells, Historical Trends (Since 2020) and Forecasted Estimates (Till 2035)
- 20.3.3. Stem Cell Therapy Market for Cord Blood Derived Stem Cells, Historical Trends (Since 2020) and Forecasted Estimates (Till 2035)
- 20.4. Data Triangulation and Validation
21. STEM CELL THERAPY MARKET, BY ROUTE OF ADMINISTRATION
- 21.1. Chapter Overview
- 21.2. Key Assumptions and Methodology
- 21.3. Stem Cell Therapy Market: Distribution by Route of Administration
- 21.3.1. Stem Cell Therapy Market for Intraarticular Therapies, Historical Trends (Since 2020) and Forecasted Estimates (Till 2035)
- 21.3.2. Stem Cell Therapy Market for Intracoronary Therapies, Historical Trends (Since 2020) and Forecasted Estimates (Till 2035)
- 21.3.3. Stem Cell Therapy Market for Intramuscular Therapies, Historical Trends (Since 2020) and Forecasted Estimates (Till 2035)
- 21.3.4. Stem Cell Therapy Market for Intramyocardial Therapies, Historical Trends (Since 2020) and Forecasted Estimates (Till 2035)
- 21.3.5. Stem Cell Therapy Market for Intrathecal Therapies, Historical Trends (Since 2020) and Forecasted Estimates (Till 2035)
- 21.3.6. Stem Cell Therapy Market for Intravenous Therapies, Historical Trends (Since 2020) and Forecasted Estimates (Till 2035)
- 21.3.7. Stem Cell Therapy Market for Surgical Implants, Historical Trends (Since 2020) and Forecasted Estimates (Till 2035)
- 21.3.8. Stem Cell Therapy Market for Other Routes of Administration, Historical Trends (Since 2020) and Forecasted Estimates (Till 2035)
- 21.4. Data Triangulation and Validation
22. STEM CELL THERAPY MARKET, BY THERAPEUTIC AREA
- 22.1. Chapter Overview
- 22.2. Key Assumptions and Methodology
- 22.3. Stem Cell Therapy Market: Distribution by Therapeutic Area
- 22.3.1. Stem Cell Therapy Market for Autoimmune / Inflammatory Disorders, Historical Trends (Since 2020) and Forecasted Estimates (Till 2035)
- 22.3.2. Stem Cell Therapy Market for Cardiovascular Disorders, Historical Trends (Since 2020) and Forecasted Estimates (Till 2035)
- 22.3.3. Stem Cell Therapy Market for Metabolic Disorders, Historical Trends (Since 2020) and Forecasted Estimates (Till 2035)
- 22.3.4. Stem Cell Therapy Market for Musculoskeletal Disorders, Historical Trends (Since 2020) and Forecasted Estimates (Till 2035)
- 22.3.5. Stem Cell Therapy Market for Oncological Disorders, Historical Trends (Since 2020) and Forecasted Estimates (Till 2035)
- 22.3.6. Stem Cell Therapy Market for Neurological Disorders, Historical Trends (Since 2020) and Forecasted Estimates (Till 2035)
- 22.3.7. Stem Cell Therapy Market for Ophthalmic Disorders, Historical Trends (Since 2020) and Forecasted Estimates (Till 2035)
- 22.3.8. Stem Cell Therapy Market for Others, Historical Trends (Since 2020) and Forecasted Estimates (Till 2035)
- 22.4. Data Triangulation and Validation
23. STEM CELL THERAPY MARKET, BY END USERS
- 23.1. Chapter Overview
- 23.2. Key Assumptions and Methodology
- 23.3. Stem Cell Therapy Market: Distribution by End Users
- 23.3.1. Stem Cell Therapy Market for Ambulatory Surgery Centers, Historical Trends (Since 2020) and Forecasted Estimates (Till 2035)
- 23.3.2. Stem Cell Therapy Market for Hospitals, Historical Trends (Since 2020) and Forecasted Estimates (Till 2035)
- 23.3.3. Stem Cell Therapy Market for Specialty Clinics, Historical Trends (Since 2020) and Forecasted Estimates (Till 2035)
- 23.4. Data Triangulation and Validation
24. STEM CELL THERAPY MARKET, BY GEOGRAPHICAL REGIONS
- 24.1. Chapter Overview
- 24.2. Key Assumptions and Methodology
- 24.3. Stem Cell Therapy Market: Distribution by Geographical Regions
- 24.3.1. Stem Cell Therapy Market in North America, Historical Trends (Since 2020) and Forecasted Estimates (Till 2035)
- 24.3.2. Stem Cell Therapy Market in Europe, Historical Trends (Since 2020) and Forecasted Estimates (Till 2035)
- 24.3.3. Stem Cell Therapy Market in Asia-Pacific, Historical Trends (Since 2020) and Forecasted Estimates (Till 2035)
- 24.3.4. Stem Cell Therapy Market in Rest of the World, Historical Trends (Since 2020) and Forecasted Estimates (Till 2035)
- 24.4. Market Dynamics Assessment
- 24.4.1. Market Movement Analysis
- 24.4.2. Penetration-Growth (P-G) Matrix
- 24.5. Data Triangulation and Validation
25. CONCLUDING INSIGHTS
26. EXECUTIVE INSIGHTS
27. APPENDIX I: TABULATED DATA
28. APPENDIX II: LIST OF COMPANIES AND ORGANIZATIONS
List of Tables
- Table 6.1 Differences between Stem Cell Therapies and Other Biologics
- Table 7.1 Stem Cell Therapies: Marketed and Development Pipeline
- Table 7.2 Stem Cell Therapies Pipeline: Information on Target Indication, Therapeutic Area and Route of Administration
- Table 7.3 Stem Cell Therapies Pipeline: Information on Dosage and Commercial Rights
- Table 7.4 Stem Cell Therapies Pipeline: Information on Special Designations
- Table 7.5 Stem Cell Therapies Pipeline: Information on Technology Platforms
- Table 7.6 Stem Cell Therapies Pipeline: List of Therapy Developers
- Table 8.1 List of Companies Profiles
- Table 8.2 Anterogen: Company Profile
- Table 8.3 Product Portfolio: Clinical-Stage Stem Cell Therapies
- Table 8.4 Anterogen: Recent Developments and Future Outlook
- Table 8.5 Athersys: Company Profile
- Table 8.6 Product Portfolio: Clinical-Stage Stem Cell Therapies
- Table 8.7 Athersys: Recent Developments and Future Outlook
- Table 8.8 CHA Biotech: Company Profile
- Table 8.9 Product Portfolio: Clinical-Stage Stem Cell Therapies
- Table 8.10 CHA Biotech: Recent Developments and Future Outlook
- Table 8.11 Cytopeutics: Company Profile
- Table 8.12 Product Portfolio: Clinical-Stage Stem Cell Therapies
- Table 8.13 Cytopeutics: Recent Developments and Future Outlook
- Table 8.14 Hope Biosciences: Company Profile
- Table 8.15 Product Portfolio: Clinical-Stage Stem Cell Therapies
- Table 8.16 Hope Biosciences: Recent Developments and Future Outlook
- Table 8.17 Mesoblast: Company Profile
- Table 8.18 Product Portfolio: Clinical-Stage Stem Cell Therapies
- Table 8.19 Mesoblast: Recent Developments and Future Outlook
- Table 8.20 Pluristem Therapeutics: Company Profile
- Table 8.21 Product Portfolio: Clinical-Stage Stem Cell Therapies
- Table 8.22 Pluristem Therapeutics: Recent Developments and Future Outlook
- Table 8.23 Takeda Pharmaceutical: Company Profile
- Table 8.24 Product Portfolio: Clinical-Stage Stem Cell Therapies
- Table 8.25 Takeda Pharmaceutical: Recent Developments and Future Outlook
- Table 8.26 TICEBA: Company Profile
- Table 8.27 Product Portfolio: Clinical-Stage Stem Cell Therapies
- Table 8.28 TICEBA: Recent Developments and Future Outlook
- Table 9.1 Crohn's Disease: Current Treatment Options
- Table 9.2 Crohn's Disease: Side Effects of Current Treatment Options
- Table 9.3 Crohn's Disease: Stem Cell Therapeutics Pipeline
- Table 9.4 Ulcerative Colitis: Current Treatment Options
- Table 9.5 Ulcerative Colitis: Side Effects of Current Treatment Options
- Table 9.6 Ulcerative Colitis: Stem Cell Therapeutics Pipeline
- Table 9.7 Peripheral Arterial Diseases: List of Marketed Drugs
- Table 9.8 Critical Limb Ischemia: Stem Cell Therapeutics Pipeline
- Table 9.9 Heart Failure: List of Marketed Drugs
- Table 9.10 Heart Failure: Stem Cell Therapeutics Pipeline
- Table 9.11 Heart Failure: List of Marketed Drugs
- Table 9.12 Myocardial Infarction: List of Marketed Drugs
- Table 9.13 Myocardial Infarction: Stem Cell Therapeutics Pipeline
- Table 9.14 Acne Vulgaris: Current Treatment Options
- Table 9.15 Acne Vulgaris: Side Effects of Current Treatment Options
- Table 9.16 Acne Vulgaris: Stem Cell Therapeutics Pipeline
- Table 9.17 Diabetes: Current Treatment Options
- Table 9.18 Diabetes: Side Effects of Current Treatment Options
- Table 9.19 Diabetes: Stem Cell Therapeutics Pipeline
- Table 9.20 Non-Alcoholic Steatohepatitis: Stem Cell Therapeutics Pipeline
- Table 9.21 Bladder Cancer: List of Marketed Targeted Therapeutics
- Table 9.22 Breast Cancer: List of Marketed Targeted Therapeutics
- Table 9.23 Colorectal Cancer: Side Effects of Current Treatments
- Table 9.24 Kidney Cancer: List of Marketed Targeted Therapeutics
- Table 9.25 Liver Cancer: List of Marketed Targeted Therapeutics
- Table 9.26 Lung Cancer: List of Marketed Targeted Therapeutics
- Table 9.27 Lung Cancer: Side Effects of Current Treatments
- Table 9.28 Ovarian Cancer: List of Marketed Targeted Therapeutics
- Table 9.29 Pancreatic Cancer: List of Marketed Targeted Therapeutics
- Table 9.30 Pancreatic Cancer: Stem Cell Therapeutics Pipeline
- Table 9.31 Alzheimer's Disease: Current Treatment Options
- Table 9.32 Alzheimer's Disease: Stem Cell Therapeutics Pipeline
- Table 9.33 Parkinson's Disease: Current Treatment Options
- Table 9.34 Parkinson's Disease: Stem Cell Therapeutics Pipeline
- Table 11.1 Grant Analysis: List of Most Attractive Grants
- Table 27.1 Stem Cell Therapies: Distribution by Phase of Development
- Table 27.2 Stem Cell Therapies: Distribution by Source of Stem Cell
- Table 27.3 Stem Cell Therapies: Distribution by Origin of Stem Cell
- Table 27.4 Stem Cell Therapies: Distribution by Type of Stem Cell
- Table 27.5 Stem Cell Therapies: Distribution by Lineage of Stem Cell
- Table 27.6 Stem Cell Therapies: Distribution by Potency of Stem Cell
- Table 27.7 Stem Cell Therapies: Distribution by Target Indication
- Table 27.8 Stem Cell Therapies: Distribution by Therapeutic Area
- Table 27.9 Stem Cell Therapies: Distribution by Route of Administration
- Table 27.10 Stem Cell Therapy Developers: Distribution by Year of Establishment
- Table 27.11 Stem Cell Therapy Developers: Distribution by Company Size
- Table 27.12 Stem Cell Therapy Developers: Distribution by Location of Headquarters
- Table 27.13 Stem Cell Therapy Developers: Distribution by Company Size and Location of Headquarters
- Table 27.14 Leading Stem Cell Therapy Developers: Distribution by Number of Stem Cell Therapies
- Table 27.15 Grant Analysis: Cumulative Trend by Year of Award, Since 2015
- Table 27.16 Grant Analysis: Cumulative Trend by Amount Awarded, Since 2015 (USD Million)
- Table 27.17 Grant Analysis: Distribution by Administering Institute Center
- Table 27.18 Grant Analysis: Distribution by Funding Institute Center
- Table 27.19 Grant Analysis: Distribution by Support Period
- Table 27.20 Grant Analysis: Distribution by Funding Institute Center and Support Period
- Table 27.21 Grant Analysis: Most Popular NIH Funding Categorizations
- Table 27.22 Grant Analysis: Distribution by Funding Mechanism
- Table 27.23 Grant Analysis: Emerging Focus Areas
- Table 27.24 Grant Analysis: Distribution by Source of Stem Cell
- Table 27.25 Grant Analysis: Distribution by Origin of Stem Cell
- Table 27.26 Grant Analysis: Distribution by Type of Stem Cell
- Table 27.27 Grant Analysis: Year-Wise Trend in Activity for Different Types of Stem Cells
- Table 27.28 Grant Analysis: Year-Wise Trend in Amount Awarded for Different Types of Stem Cells (USD Million)
- Table 27.29 Grant Analysis: Distribution by Lineage of Stem Cell
- Table 27.30 Grant Analysis: Distribution by Potency of Stem Cell
- Table 27.31 Grant Analysis: Distribution by Therapeutic Area
- Table 27.32 Grant Analysis: Year-Wise Trend in Activity for Popular Therapeutic Areas
- Table 27.33 Grant Analysis: Year-Wise Trend in Amount Awarded for Popular Therapeutic Areas (USD Million)
- Table 27.34 Grant Analysis: Distribution by Type of Grant Application
- Table 27.35 Grant Analysis: Popular NIH Departments
- Table 27.36 Grant Analysis: Distribution by Study Section
- Table 27.37 Grant Analysis: Types of Recipient Organizations
- Table 27.38 Grant Analysis: Popular Recipient Organizations
- Table 27.39 Grant Analysis: Distribution by Grant Mechanism
- Table 27.40 Grant Analysis: Prominent Program Officers
- Table 27.41 Grant Analysis: Regional Distribution of Recipient Organizations
- Table 27.42 Grant Analysis: Categorizations based on Weighted Attractiveness Scores
- Table 27.43 Grant Analysis: Multivariate Grant Attractiveness Analysis
- Table 27.44 Clinical Trial Analysis: Scope and Methodology
- Table 27.45 Clinical Trial Analysis: Distribution by Trial Status
- Table 27.46 Clinical Trial Analysis: Cumulative Distribution of Trials by Registration Year, Pre-2021
- Table 27.47 Clinical Trial Analysis: Distribution by Trial Phase
- Table 27.48 Clinical Trial Analysis: Distribution by Number of Patients Enrolled by Trial Registration Year, Since 2021
- Table 27.49 Clinical Trial Analysis: Distribution by Study Design
- Table 27.50 Clinical Trial Analysis: Cumulative Year-wise Trend by Trial Recruitment Status
- Table 27.51 Clinical Trial Analysis: Distribution by Type of Sponsor / Collaborator
- Table 27.52 Clinical Trial Analysis: Leading Industry Players
- Table 27.53 Clinical Trial Analysis: Distribution by Focus Area
- Table 27.54 Clinical Trial Analysis: Distribution by Type of Stem Cell
- Table 27.55 Clinical Trial Analysis: Cumulative Distribution by Type of Stem Cell and Trial Registration Year
- Table 27.56 Clinical Trial Analysis: Distribution by Therapeutic Area
- Table 27.57 Clinical Trial Analysis: Year-Wise Trend in Activity for Popular Therapeutic Areas
- Table 27.58 Clinical Trial Analysis: Distribution by Patient Enrollment and Therapeutic Area
- Table 27.59 Clinical Trial Analysis: Year-Wise Trend in Patient Enrollment (in thousands) for Popular Therapeutic Areas
- Table 27.60 Clinical Trial Analysis: Distribution by Type of Stem Cell and Therapeutic Area
- Table 27.61 Clinical Trial Analysis: Geographical Distribution by Number of Trials
- Table 27.62 Clinical Trial Analysis: Geographical Distribution by Trial Registration Year and Recruitment Status
- Table 27.63 Clinical Trial Analysis: Geographical Distribution by Enrolled Patient Population
- Table 27.64 Key Steps Involved in the Manufacturing of Stem Cell Therapies
- Table 27.65 Stem Cell Therapy CMOs (Industry): Distribution by Year of Establishment
- Table 27.66 Stem Cell Therapy CMOs (Industry): Distribution by Company Size
- Table 27.67 Stem Cell Therapy CMOs (Industry): Distribution by Scale of Manufacturing
- Table 27.68 Stem Cell Therapy CMOs (Industry): Distribution by Location of Headquarters
- Table 27.69 Stem Cell Therapy CMOs (Industry): Distribution by Location of Manufacturing Facilities
- Table 27.70 Stem Cell Therapy CMOs (Industry): Distribution by Types of Services Offered
- Table 27.71 Stem Cell Therapy CMOs (Industry): Distribution by Source of Stem Cell
- Table 27.72 Stem Cell Therapy CMOs (Industry): Distribution by Origin of Stem Cell
- Table 27.73 Stem Cell Therapy CMOs (Non-industry): Distribution by Year of Establishment
- Table 27.74 Stem Cell Therapy CMOs (Non-industry): Distribution by Scale of Manufacturing
- Table 27.75 Stem Cell Therapy CMOs (Non-industry): Distribution by Location of Headquarters
- Table 27.76 Stem Cell Therapy CMOs (Non-industry): Distribution by Location of Manufacturing Facilities
- Table 27.77 Stem Cell Therapy CMOs (Non-industry): Distribution by Types of Services Offered
- Table 27.78 Stem Cell Therapy CMOs (Non-industry): Distribution by Source of Stem Cell
- Table 27.79 Stem Cell Therapy CMOs (Non-industry): Distribution by Origin of Stem Cell
- Table 27.80 Overall Stem Cell Therapies Market, till 2035 (USD Million)
- Table 27.81 Stem Cell Therapies Market: Distribution by Source of Stem Cell
- Table 27.82 Stem Cell Therapies Market for Allogeneic Therapies, till 2035 (USD Million)
- Table 27.83 Stem Cell Therapies Market for Autologous Therapies, till 2035 (USD Million)
- Table 27.84 Stem Cell Therapies Market: Distribution by Origin of Stem Cell
- Table 27.85 Stem Cell Therapies Market for Adult Stem Cells, till 2035 (USD Million)
- Table 27.86 Stem Cell Therapies Market for Embryonic Stem Cells, till 2035 (USD Million)
- Table 27.87 Stem Cell Therapies Market: Distribution by Type of Stem Cell
- Table 27.88 Stem Cell Therapies Market for Hematopoietic Stem Cells, till 2035 (USD Million)
- Table 27.89 Stem Cell Therapies Market for Mesenchymal Stem Cells, till 2035 (USD Million)
- Table 27.90 Stem Cell Therapies Market for Progenitor Cells, till 2035 (USD Million)
- Table 27.91 Stem Cell Therapies Market for Others, till 2035 (USD Million)
- Table 27.92 Stem Cell Therapies Market: Distribution by Lineage of Stem Cell
- Table 27.93 Stem Cell Therapies Market for Adipose Tissue Derived Stem Cells, till 2035 (USD Million)
- Table 27.94 Stem Cell Therapies Market for Bone Marrow Derived Stem Cells, till 2035 (USD Million)
- Table 27.95 Stem Cell Therapies Market for Cord Blood Derived Stem Cells, till 2035 (USD Million)
- Table 27.96 Stem Cell Therapies Market: Distribution by Route of Administration
- Table 27.97 Stem Cell Therapies Market for Intraarticular Therapies, till 2035 (USD Million)
- Table 27.98 Stem Cell Therapies Market for Intracoronary Therapies, till 2035 (USD Million)
- Table 27.99 Stem Cell Therapies Market for Intramuscular Therapies, till 2035 (USD Million)
- Table 27.100 Stem Cell Therapies Market for Intramyocardial Therapies, till 2035 (USD Million)
- Table 27.101 Stem Cell Therapies Market for Intrathecal Therapies, till 2035 (USD Million)
- Table 27.102 Stem Cell Therapies Market for Intravenous Therapies, till 2035 (USD Million)
- Table 27.103 Stem Cell Therapies Market for Surgical Implants, till 2035 (USD Million)
- Table 27.104 Stem Cell Therapies Market for Other Route of Administration, till 2035 (USD Million)
- Table 27.105 Stem Cell Therapies Market: Distribution by Therapeutic Area
- Table 27.106 Stem Cell Therapies Market for Autoimmune / Inflammatory Disorders, till 2035 (USD Million)
- Table 27.107 Stem Cell Therapies Market for Cardiovascular Disorders, till 2035 (USD Million)
- Table 27.108 Stem Cell Therapies Market for Metabolic Disorders, till 2035 (USD Million)
- Table 27.109 Stem Cell Therapies Market for Musculoskeletal Disorders, till 2035 (USD Million)
- Table 27.110 Stem Cell Therapies Market for Neurological Disorders, till 2035 (USD Million)
- Table 27.111 Stem Cell Therapies Market for Oncological Disorders, till 2035 (USD Million)
- Table 27.112 Stem Cell Therapies Market for Ophthalmic Disorders, till 2035 (USD Million)
- Table 27.113 Stem Cell Therapies Market for Others, till 2035 (USD Million)
- Table 27.114 Stem Cell Therapies Market: Distribution by End Users
- Table 27.115 Stem Cell Therapies Market for Ambulatory Surgery Centers, till 2035 (USD Million)
- Table 27.116 Stem Cell Therapies Market for Hospitals, till 2035 (USD Million)
- Table 27.117 Stem Cell Therapies Market for Specialty Clinics, till 2035 (USD Million)
- Table 27.118 Stem Cell Therapies Market: Distribution by Key Geographical Regions
- Table 27.119 Stem Cell Therapies Market in North America, till 2035 (USD Million)
- Table 27.120 Stem Cell Therapies Market in Europe, till 2035 (USD Million)
- Table 27.121 Stem Cell Therapies Market in Asia-Pacific, till 2035 (USD Million)
- Table 27.122 Stem Cell Therapies Market in Rest of the World, till 2035 (USD Million)
List of Figures
- Figure 2.1 Research Methodology: Project Methodology
- Figure 2.2 Research Methodology: Data Sources for Secondary Research
- Figure 2.3 Research Methodology: Robust Quality Control
- Figure 3.1 Market Dynamics: Forecast Methodology
- Figure 3.2 Market Dynamics: Market Assessment Framework
- Figure 4.1 Lessons Learnt from Past Recessions
- Figure 5.1 Executive Summary: Overall Market Landscape
- Figure 5.2 Executive Summary: Market Trends
- Figure 5.3 Executive Summary: Market Forecast and Opportunity Analysis
- Figure 6.1 Cellular Lineages Used for the Isolation of Stem Cells
- Figure 6.2 Steps Involved in the Development and Administration of Stem Cell Therapies
- Figure 6.3 Classification of Stem Cells
- Figure 6.4 Classification based on Source of Stem Cell
- Figure 6.5 Differences between Allogeneic and Autologous Stem Cell Therapies
- Figure 6.6 Classification based on Origin of Stem Cell
- Figure 6.7 Classification based on Potency of Stem Cell
- Figure 6.8 Key Application Areas for Stem Cell Therapies
- Figure 6.9 Emerging Focus Areas: Google News
- Figure 6.10 Historical Timeline: Analysis of Google Trends
- Figure 6.11 Geographical Activity: Analysis of Google Trends
- Figure 6.12 Stem Cell Therapies: Key Growth Drivers and Roadblocks
- Figure 7.1 Stem Cell Therapies: Distribution by Phase of Development
- Figure 7.2 Stem Cell Therapies: Distribution by Source of Stem Cell
- Figure 7.3 Stem Cell Therapies: Distribution by Origin of Stem Cell
- Figure 7.4 Stem Cell Therapies: Distribution by Type of Stem Cell
- Figure 7.5 Stem Cell Therapies: Distribution by Lineage of Stem Cell
- Figure 7.6 Stem Cell Therapies: Distribution by Potency of Stem Cell
- Figure 7.7 Stem Cell Therapies: Distribution by Target Indication
- Figure 7.8 Stem Cell Therapies: Distribution by Therapeutic Area
- Figure 7.9 Stem Cell Therapies: Distribution by Route of Administration
- Figure 7.10 Stem Cell Therapy Developers: Distribution by Year of Establishment
- Figure 7.11 Stem Cell Therapy Developers: Distribution by Company Size
- Figure 7.12 Stem Cell Therapy Developers: Distribution by Location of Headquarters
- Figure 7.13 Stem Cell Therapy Developers: Distribution by Company Size and Location of Headquarters
- Figure 7.14 Leading Stem Cell Therapy Developers: Distribution by Number of Stem Cell Therapies
- Figure 7.15 Leading Stem Cell Therapy Developers: 4D Bubble Analysis based on Strength of Pipeline, Number of Therapies, Target Indication and Company Size
- Figure 7.16 Heptagon Representation: Distribution by Phase of Development and Key Therapeutic Area
- Figure 7.17 Grid Representation: Distribution by Phase of Development, Source of Stem Cell and Therapeutic Area
- Figure 7.18 Tree Map Representation: Distribution by Therapeutic Area and Size of the Company
- Figure 7.19 World Map Representation: Regional Activity
- Figure 9.1 Critical Limb Ischemia: Risk Factors
- Figure 9.2 Critical Limb Ischemia: Symptoms
- Figure 9.3 Heart Failure: Types
- Figure 9.4 Heart Failure: Risk Factors
- Figure 9.5 Heart Failure: Symptoms
- Figure 9.6 Myocardial Infarction: Risk Factors
- Figure 9.7 Myocardial Infarction: Symptoms
- Figure 9.8 Diabetes: Diagnostic Limits for Plasma Glucose Levels
- Figure 9.9 Diabetes: Non-Insulin Therapies
- Figure 9.10 Bladder Cancer: Global Epidemiological Distribution
- Figure 9.11 Breast Cancer: Global Epidemiological Distribution
- Figure 9.12 Kidney Cancer: Global Epidemiological Distribution
- Figure 9.13 Liver Cancer: Global Epidemiological Distribution
- Figure 9.14 Lung Cancer: Global Epidemiological Distribution
- Figure 9.15 Ovarian Cancer: Global Epidemiological Distribution
- Figure 9.16 Pancreatic Cancer: Global Epidemiological Distribution
- Figure 9.17 Dementia: Global Epidemiological Distribution
- Figure 9.18 Alzheimer's Disease: Signs and Symptoms
- Figure 9.19 Alzheimer's Disease: Normal Brain versus Diseased Brain
- Figure 9.20 Alzheimer's Disease: Phases of Disease Progression
- Figure 9.21 Parkinson's Disease: Gender-wise Incidence Rates
- Figure 9.22 Parkinson's Disease: Non-Pharmacological Treatment Options
- Figure 9.23 Parkinson's Disease: Surgical Interventions
- Figure 9.24 Parkinson's Disease: Dietary Supplements
- Figure 10.1 Relative Competition and Growth Opportunities Related to Stem Cell Therapies: Analytical Output
- Figure 10.2 Relative Competition and Growth Opportunities Related to Established Therapeutic Areas in Emerging Regions
- Figure 10.3 Relative Competition and Growth Opportunities Related to Established Therapeutic Areas in Established Regions
- Figure 10.4 Relative Competition and Growth Opportunities Related to Emerging Therapeutic Areas in Emerging Regions
- Figure 10.5 Relative Competition and Growth Opportunities Related to Emerging Therapeutic Areas in Established Regions
- Figure 11.1 Grant Analysis: Cumulative Trend by Year of Award, Since 2015
- Figure 11.2 Grant Analysis: Cumulative Trend by Amount Awarded, Since 2015 (USD Million)
- Figure 11.3 Grant Analysis: Distribution by Administering Institute Center
- Figure 11.4 Grant Analysis: Distribution by Funding Institute Center
- Figure 11.5 Grant Analysis: Distribution by Support Period
- Figure 11.6 Grant Analysis: Distribution by Funding Institute Center and Support Period
- Figure 11.7 Grant Analysis: Most Popular NIH Funding Categorizations
- Figure 11.8 Grant Analysis: Distribution by Funding Mechanism
- Figure 11.9 Grant Analysis: Emerging Focus Areas
- Figure 11.10 Grant Analysis: Distribution by Source of Stem Cell
- Figure 11.11 Grant Analysis: Distribution by Origin of Stem Cell
- Figure 11.12 Grant Analysis: Distribution by Type of Stem Cell
- Figure 11.13 Grant Analysis: Year-Wise Trend in Activity for Different Types of Stem Cells
- Figure 11.14 Grant Analysis: Year-Wise Trend in Amount Awarded for Different Types of Stem Cells (USD Million)
- Figure 11.15 Grant Analysis: Distribution by Lineage of Stem Cell
- Figure 11.16 Grant Analysis: Distribution by Potency of Stem Cell
- Figure 11.17 Grant Analysis: Distribution by Therapeutic Area
- Figure 11.18 Grant Analysis: Year-Wise Trend in Activity for Popular Therapeutic Areas
- Figure 11.19 Grant Analysis: Year-Wise Trend in Amount Awarded for Popular Therapeutic Areas (USD Million)
- Figure 11.20 Grant Analysis: Distribution by Type of Grant Application
- Figure 11.21 Grant Analysis: Popular NIH Departments
- Figure 11.22 Grant Analysis: Distribution by Study Section
- Figure 11.23 Grant Analysis: Types of Recipient Organizations
- Figure 11.24 Grant Analysis: Popular Recipient Organizations
- Figure 11.25 Grant Analysis: Distribution by Grant Mechanism
- Figure 11.26 Grant Analysis: Prominent Program Officers
- Figure 11.27 Grant Analysis: Regional Distribution of Recipient Organizations
- Figure 11.28 Grant Analysis: Categorizations based on Weighted Attractiveness Scores
- Figure 11.29 Grant Analysis: Multivariate Grant Attractiveness Analysis
- Figure 12.1 Clinical Trial Analysis: Scope and Methodology
- Figure 12.2 Clinical Trial Analysis: Distribution by Trial Status
- Figure 12.3 Clinical Trial Analysis: Cumulative Distribution of Trials by Registration Year, Pre-2021
- Figure 12.4 Clinical Trial Analysis: Distribution by Trial Phase
- Figure 12.5 Clinical Trial Analysis: Distribution by Number of Patients Enrolled by Trial Registration Year, Since 2021
- Figure 12.6 Clinical Trial Analysis: Distribution by Study Design
- Figure 12.7 Clinical Trial Analysis: Cumulative Year-wise Trend by Trial Recruitment Status
- Figure 12.8 Clinical Trial Analysis: Distribution by Type of Sponsor / Collaborator
- Figure 12.9 Clinical Trial Analysis: Leading Industry Players
- Figure 12.10 Clinical Trial Analysis: Distribution by Focus Area
- Figure 12.11 Clinical Trial Analysis: Distribution by Type of Stem Cell
- Figure 12.12 Clinical Trial Analysis: Cumulative Distribution by Type of Stem Cell and Trial Registration Year
- Figure 12.13 Clinical Trial Analysis: Distribution by Therapeutic Area
- Figure 12.14 Clinical Trial Analysis: Year-Wise Trend in Activity for Popular Therapeutic Areas
- Figure 12.15 Clinical Trial Analysis: Distribution by Patient Enrollment and Therapeutic Area
- Figure 12.16 Clinical Trial Analysis: Year-Wise Trend in Patient Enrollment (in thousands) for Popular Therapeutic Areas
- Figure 12.17 Clinical Trial Analysis: Distribution by Type of Stem Cell and Therapeutic Area
- Figure 12.18 Clinical Trial Analysis: Geographical Distribution by Number of Trials
- Figure 12.19 Clinical Trial Analysis: Geographical Distribution by Trial Registration Year and Recruitment Status
- Figure 12.20 Clinical Trial Analysis: Geographical Distribution by Enrolled Patient Population
- Figure 13.1 Key Steps Involved in the Manufacturing of Stem Cell Therapies
- Figure 13.2 Stem Cell Therapy CMOs (Industry): Distribution by Year of Establishment
- Figure 13.3 Stem Cell Therapy CMOs (Industry): Distribution by Company Size
- Figure 13.4 Stem Cell Therapy CMOs (Industry): Distribution by Scale of Manufacturing
- Figure 13.5 Stem Cell Therapy CMOs (Industry): Distribution by Location of Headquarters
- Figure 13.6 Stem Cell Therapy CMOs (Industry): Distribution by Location of Manufacturing Facilities
- Figure 13.7 Stem Cell Therapy CMOs (Industry): Distribution by Types of Services Offered
- Figure 13.8 Stem Cell Therapy CMOs (Industry): Distribution by Source of Stem Cell
- Figure 13.9 Stem Cell Therapy CMOs (Industry): Distribution by Origin of Stem Cell
- Figure 13.10 Stem Cell Therapy CMOs (Non-industry): Distribution by Year of Establishment
- Figure 13.11 Stem Cell Therapy CMOs (Non-industry): Distribution by Scale of Manufacturing
- Figure 13.12 Stem Cell Therapy CMOs (Non-industry): Distribution by Location of Headquarters
- Figure 13.13 Stem Cell Therapy CMOs (Non-industry): Distribution by Location of Manufacturing Facilities
- Figure 13.14 Stem Cell Therapy CMOs (Non-industry): Distribution by Types of Services Offered
- Figure 13.15 Stem Cell Therapy CMOs (Non-industry): Distribution by Source of Stem Cell
- Figure 13.16 Stem Cell Therapy CMOs (Non-industry): Distribution by Origin of Stem Cell
- Figure 13.17 Financial Indicators: Comparative Analysis of KPIs Considered by Big Pharma Companies
- Figure 13.18 Financial Indicators: Big Pharma Perspective
- Figure 13.19 Financial Indicators: Contract Manufacturers' Perspective
- Figure 13.20 Process / Capability Indicators: Big Pharma Perspective
- Figure 13.21 Process / Capability Indicators: Contract Manufacturers' Perspective
- Figure 13.22 Market Reputation Indicators: Comparative Analysis of KPIs of Big Pharma Companies
- Figure 13.23 Market Reputation Indicators: Big Pharma Perspective
- Figure 13.24 Market Reputation Indicators: Contract Manufacturers' Perspective
- Figure 14.1 Opportunity Assessment in North America: Gap Analysis by Scale of Stem Cell Manufacturing
- Figure 14.2 Opportunity Assessment in North America: Gap Analysis by Source of Stem Cell
- Figure 14.3 Opportunity Assessment in North America: Gap Analysis by Origin of Stem Cell
- Figure 14.4 Opportunity Assessment in Europe: Gap Analysis by Scale of Stem Cell Manufacturing
- Figure 14.5 Opportunity Assessment in Europe: Gap Analysis by Source of Stem Cell
- Figure 14.6 Opportunity Assessment in Europe: Gap Analysis by Origin of Stem Cell
- Figure 14.7 Opportunity Assessment in Asia-Pacific and Rest of the World: Gap Analysis by Scale of Stem Cell Manufacturing
- Figure 14.8 Opportunity Assessment in Asia-Pacific and Rest of the World: Gap Analysis by Source of Stem Cell
- Figure 14.9 Opportunity Assessment in Asia-Pacific and Rest of the World: Gap Analysis by Origin of Stem Cell
- Figure 14.10 Stem Cell Therapy Developers and CMOs: Mapping Regional Presence
- Figure 14.11 Stem Cell Therapy Developers and CMOs: Mapping Capabilities
- Figure 15.1 Successful Drug Launch Strategy: ROOTS Framework
- Figure 15.2 Commonly Adopted Commercialization Strategies based on Development Stage of the Product
- Figure 15.3 Harvey Ball Analysis: Commercialization Strategies Adopted by Companies Focused on Stem Cell Therapies
- Figure 15.4 Approved Stem Cell Therapies: Historical Timeline of Geographical Expansion
- Figure 16.1 Overall Stem Cell Therapies Market, till 2035 (USD Million)
- Figure 17.1 Stem Cell Therapies Market: Distribution by Source of Stem Cell
- Figure 17.2 Stem Cell Therapies Market for Allogeneic Therapies, till 2035 (USD Million)
- Figure 17.3 Stem Cell Therapies Market for Autologous Therapies, till 2035 (USD Million)
- Figure 18.1 Stem Cell Therapies Market: Distribution by Origin of Stem Cell
- Figure 18.2 Stem Cell Therapies Market for Adult Stem Cells, till 2035 (USD Million)
- Figure 18.3 Stem Cell Therapies Market for Embryonic Stem Cells, till 2035 (USD Million)
- Figure 19.1 Stem Cell Therapies Market: Distribution by Type of Stem Cell
- Figure 19.2 Stem Cell Therapies Market for Hematopoietic Stem Cells, till 2035 (USD Million)
- Figure 19.3 Stem Cell Therapies Market for Mesenchymal Stem Cells, till 2035 (USD Million)
- Figure 19.4 Stem Cell Therapies Market for Progenitor Cells, till 2035 (USD Million)
- Figure 19.5 Stem Cell Therapies Market for Others, till 2035 (USD Million)
- Figure 20.1 Stem Cell Therapies Market: Distribution by Lineage of Stem Cell
- Figure 20.2 Stem Cell Therapies Market for Adipose Tissue Derived Stem Cells, till 2035 (USD Million)
- Figure 20.3 Stem Cell Therapies Market for Bone Marrow Derived Stem Cells, till 2035 (USD Million)
- Figure 20.4 Stem Cell Therapies Market for Cord Blood Derived Stem Cells, till 2035 (USD Million)
- Figure 21.1 Stem Cell Therapies Market: Distribution by Route of Administration
- Figure 21.2 Stem Cell Therapies Market for Intraarticular Therapies, till 2035 (USD Million)
- Figure 21.3 Stem Cell Therapies Market for Intracoronary Therapies, till 2035 (USD Million)
- Figure 21.4 Stem Cell Therapies Market for Intramuscular Therapies, till 2035 (USD Million)
- Figure 21.5 Stem Cell Therapies Market for Intramyocardial Therapies, till 2035 (USD Million)
- Figure 21.6 Stem Cell Therapies Market for Intrathecal Therapies, till 2035 (USD Million)
- Figure 21.7 Stem Cell Therapies Market for Intravenous Therapies, till 2035 (USD Million)
- Figure 21.8 Stem Cell Therapies Market for Surgical Implants, till 2035 (USD Million)
- Figure 21.9 Stem Cell Therapies Market for Other Route of Administration, till 2035 (USD Million)
- Figure 22.1 Stem Cell Therapies Market: Distribution by Therapeutic Area
- Figure 22.2 Stem Cell Therapies Market for Autoimmune / Inflammatory Disorders, till 2035 (USD Million)
- Figure 22.3 Stem Cell Therapies Market for Cardiovascular Disorders, till 2035 (USD Million)
- Figure 22.4 Stem Cell Therapies Market for Metabolic Disorders, till 2035 (USD Million)
- Figure 22.5 Stem Cell Therapies Market for Musculoskeletal Disorders, till 2035 (USD Million)
- Figure 22.6 Stem Cell Therapies Market for Neurological Disorders, till 2035 (USD Million)
- Figure 22.7 Stem Cell Therapies Market for Oncological Disorders, till 2035 (USD Million)
- Figure 22.8 Stem Cell Therapies Market for Ophthalmic Disorders, till 2035 (USD Million)
- Figure 22.9 Stem Cell Therapies Market for Others, till 2035 (USD Million)
- Figure 23.1 Stem Cell Therapies Market: Distribution by End Users
- Figure 23.2 Stem Cell Therapies Market for Ambulatory Surgery Centers, till 2035 (USD Million)
- Figure 23.3 Stem Cell Therapies Market for Hospitals, till 2035 (USD Million)
- Figure 23.4 Stem Cell Therapies Market for Specialty Clinics, till 2035 (USD Million)
- Figure 24.1 Stem Cell Therapies Market: Distribution by Key Geographical Regions
- Figure 24.2 Stem Cell Therapies Market in North America, till 2035 (USD Million)
- Figure 24.3 Stem Cell Therapies Market in Europe, till 2035 (USD Million)
- Figure 24.4 Stem Cell Therapies Market in Asia-Pacific, till 2035 (USD Million)
- Figure 24.5 Stem Cell Therapies Market in Rest of the World, till 2035 (USD Million)

 2034年獸用幹細胞療法市場預測-依療法、細胞來源、動物種類、應用、最終使用者和地區分類的全球分析
 幹細胞療法市場分析及預測(至2035年):依類型、產品、服務、技術、應用、流程、最終使用者、模式及階段分類
 犬類幹細胞治療市場規模、佔有率、成長、全球產業分析、區域趨勢及2026-2034年預測。
 幹細胞療法市場:2026-2032年全球市場預測(依療法、細胞來源、技術、給藥方法、應用、治療領域和最終用戶分類)
 全球幹細胞療法市場:按細胞來源、類型、治療應用、最終用戶和地區分類-預測至2035年
 幹細胞療法市場:按細胞來源、應用、最終用戶和地區分類
 獸醫幹細胞療法市場規模、佔有率和趨勢分析報告:按產品、動物、應用、最終用途、地區和細分市場預測(2026-2033 年)伴侶動物再生醫學市場規模、佔有率和趨勢分析報告:按產品、動物、應用、最終用途、地區和細分市場分類(2026-2033 年)胎盤幹細胞療法治療神經系統疾病市場分析及預測(至2035年):按類型、產品、服務、技術、應用、最終用戶、流程、階段、解決方案和治療方法
 動物幹細胞療法市場-全球產業規模、佔有率、趨勢、機會、預測:按類型、應用、地區和競爭格局分類,2021-2031年