

 |
市場調查報告書
商品編碼
2107343
護膚市場:按應用、產品類型、銷售管道、包裝、產品類型、性別、成分和地區分類的趨勢和預測(至2035年)Skincare Market by Type of Product by Application, Type of Product (by Body Part), Distribution Channel, Type of Packaging, Product Category, Gender, Ingredient and Geography - Trends and Forecast Till 2035 |
||||||

護膚市場概覽
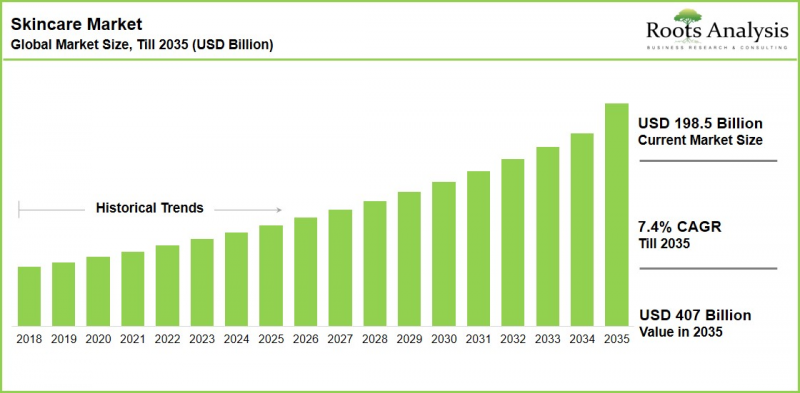
全球護膚市場預計到 2035 年將以 7.4% 的驚人複合年成長率成長,從今年的 1985 億美元成長到 2035 年的 4,070 億美元。
護膚市場:成長與趨勢
護膚已從偶爾的奢侈享受轉變為多步驟的日常護理,成為消費者日常生活的一部分,不受收入水平或地理的限制。可支配收入的增加、社交媒體對全球美容標準的日益普及,以及人們對污染、日曬和生活壓力等長期因素對皮膚健康影響的認知不斷提高,都推動了護膚品需求的成長。
傳統上,護膚品的購買決策主要受品牌知名度和價格驅動。然而,如今消費者對成分有了更深入的了解,他們會分析活性成分(例如類視色素、胜肽、透明質酸和菸鹼醯胺)的配方。他們也更傾向於選擇那些功效聲明有臨床或皮膚病學證據支持的品牌。這提升了研發在品牌差異化中的作用,並加速了傳統消費品公司收購或與以臨床為導向的D2C(直接面對消費者)護膚品牌合作的趨勢。
為此,製造商正加大對多功能配方、源自清潔永續來源的成分以及人工智慧皮膚診斷等個人化技術的投入。主要市場的監管機構也關注成分安全揭露和永續包裝標準,鼓勵整個產業提高配方透明度。總而言之,這些變化表明,市場正從單純追求銷售成長轉向基於功效、個人化和信任的價值成長。
成長驅動力:推動全球護膚市場擴張的因素
推動市場擴張的主要動力是全球消費者日益增強的日常自我護理意識。消費者不再依賴單一的多效合一產品,而是將多種護膚產品結合使用。產品配方技術的進步以及包括人工智慧驅動的皮膚診斷平台在內的數位化工具的應用,進一步促進了這一行為轉變,這些平台能夠更好地與客戶參與並提供個人化服務。
尤其值得一提的是,個人化護膚正成為一股重要潮流。這是因為,與通用配方相比,根據個人膚質量身定做的產品被認為能提供更穩定的效果。此外,消費者日益關注合成成分對健康和環境的長期影響,這推動了對清潔潔淨標示和天然成分產品的需求成長。這一趨勢促使天然成分的採購量增加,並推動了整個價值鏈中綠色化學領域的持續投資。
市場挑戰:阻礙進展的主要障礙
儘管市場需求旺盛,護膚市場仍面臨諸多挑戰。大眾市場和自有品牌的價格競爭加劇,導致中價位產品的利潤率下降;同時,成分宣稱趨同的產品越來越多,消費者難以根據功效區分不同產品。此外,主要市場對成分標籤和永續包裝的監管日益嚴格,也增加了合規成本,尤其對於監管資源有限的中小型品牌和新興品牌而言更是如此。
護膚市場:關鍵洞察
本報告分析了全球護膚產業的現狀,並指出了價值鏈上各相關人員可以利用的潛在成長機會。主要發現包括:
- 早期階段資金持續流入:專注於護膚的品牌和平台持續吸引種子輪和早期階段的資金籌措。這反映出投資人對以功效為導向、數位化原生發展的護膚企業,尤其是在印度和東南亞等高成長市場,依然保持著濃厚的興趣。
- 透過策略性收購積極進行產業重組:領先的美容和消費品集團持續收購具有創新性和臨床驗證的護膚品牌,以強化其高階和皮膚科相關化妝品產品組合。隨著老牌巨頭尋求快速確立品類領導地位的途徑,這一趨勢預計將持續下去。
- 亞太地區作為創新和銷售量中心:該地區擁有全球最大的消費群,並有著根深蒂固的多步驟護膚習慣,是全球高階品牌產品推出的主要銷售來源和有利市場。
- 成熟市場的優質化:在北美和歐洲部分地區,市場正顯著轉向經臨床支援、皮膚科醫生推薦的「皮膚護理」產品,即使銷售量成長放緩,也能實現更高的定價。
- 值得關注的關鍵點:各地區有關成分透明度和永續包裝的法律規範的發展速度,很可能成為決定競爭地位的關鍵因素,也是投資者和企業應該密切關注的指標。
護膚市場區隔
市場規模和機會分析是根據以下參數進行細分的:
按產品類型(按應用)
- 洗面乳
- 潤膚霜
- 抗衰老產品
- 防曬油
- 其他
依產品類型(依身體部位)
- 臉部保養產品
- 身體保養產品
- 唇部和眼部護理產品
按銷售管道
- 線上銷售管道
- 實體店面銷售管道
- 便利商店
- 超級市場
- 藥局
按包裝類型
- 管子
- 瓶子
- 瓶子
- 其他
產品類型
- 奢華護膚產品
- 大眾護膚品
性別
- 男性
- 女士
- 其他
按成分
- 天然成分
- 化學成分
按地區
- 北美洲
- 美國
- 加拿大
- 墨西哥
- 歐洲
- 德國
- 法國
- 義大利
- 英國
- 西班牙
- 其他歐洲國家
- 亞太地區
- 中國
- 日本
- 韓國
- 印度
- 澳洲
- 亞太其他地區
- 拉丁美洲
- 巴西
- 阿根廷
- 其他拉丁美洲
- 中東和非洲
- 非洲
- 阿拉伯聯合大公國
- 其他中東和非洲地區
護膚市場:關鍵市場區隔洞察
以使用量計算,洗面乳佔據最大的市場佔有率。
市場調查顯示,依產品類型分類,潔面產品佔據護膚市場最大佔有率(約42%)。其主導地位主要源於潔面是幾乎所有護膚流程中必不可少的一步,每天早晚各一次,而保濕霜和護理產品則可以根據需要選擇性使用。消費者對「雙重清潔」的認知度正在不斷提高,尤其是在千禧世代和Z世代消費者中,他們越來越重視去除污染物、皮脂、防曬油和彩妝殘留,這進一步推動了該品類產品的重複購買。
同時,抗衰老產品預計在預測期內將以7.2%的複合年成長率領先。這一成長主要得益於年輕消費者對預防性護膚的早期接受、皮膚科醫生和意見主導發起的關於視網醇、肽和煙醯胺等活性成分的宣傳活動日益增多,以及全部區域不斷成長的老年消費者群體尋求有效解決老齡化相關問題的方案。
依身體部位分類,臉部產品是市場主導力量。
臉部保養產品佔據最大的市場佔有率。這一高佔有率源於幾乎所有年齡層對臉部外觀的普遍關注。同時,唇部護理和眼部護理產品正成為成長最快的細分市場,這主要得益於消費者對這些敏感部位日益成長的關注,尤其是那些尋求緩解疲勞和細紋解決方案的職場人士。
線下銷售管道佔據最大的市場佔有率。
線下銷售管道,包括超級市場、美妝專賣店、藥局和皮膚科診所,目前佔據最大的市場佔有率。這一高佔有率反映了消費者,尤其是在亞洲、非洲和拉丁美洲等發展中市場,在購買產品前進行實體檢查的持續趨勢。
然而,預計在整個預測期內,線上銷售管道的複合年成長率將最高。這一高速成長主要得益於電子商務平台的影響力日益增強、個人化數位建議以及網紅購物體驗在年輕消費者群體中的普及。
瓶裝產品佔據最大的市場佔有率。
由於瓶裝產品用途廣泛,能夠滿足各種產品形式的需求,且消費者滲透率高,因此在護膚包裝領域佔據最大佔有率。而軟管包裝則是成長最快的包裝形式,符合消費者對衛生、便攜性和永續性的偏好,尤其適用於防曬油、祛痘產品和其他對污染敏感的配方。
雖然女性是最大的消費群體,但男士護膚正成為成長最快的細分市場。
由於保養品與自我護理和整裝儀容有著深厚的文化淵源,且女性普遍傾向於進行多步驟的護膚程序,因此整裝儀容護膚仍然主要由女性消費。然而,隨著千禧世代和Z世代男性也越來越注重儀容打理,並且各大品牌加大對針對男性肌膚問題的配方研發投入,例如解決剃須後灼熱感和油脂分泌過剩等問題,男士護膚市場正迅速崛起,成為成長最快的細分市場。
亞太地區佔最大佔有率,而北美地區的複合年成長率更高。
我們的預測顯示,亞太地區將佔據全球護膚市場最大的區域佔有率(近35%)。這一主導地位得益於中國、日本、韓國和印度等國家根深蒂固的文化背景,這些國家非常重視日常皮膚護理,以及迅速壯大的中產階級消費族群。
同時,預計北美地區在預測期內將以7.0%的複合年成長率實現最高成長。這一成長主要得益於消費者對經臨床驗證的「皮膚護理」產品的顯著偏好,以及對先進的、潔淨標示的護膚方案的日益普及。
護膚市場主要公司示例
- Amorepacific
- Beiersdorf
- Chanel
- Coty
- Estee Lauder
- Galderma
- Johnson & Johnson
- Kao Corporation
- L'Oreal
- LVMH
- Procter & Gamble
- Shiseido
- Unilever
護膚市場:研究範圍
- 市場規模與機會分析:對全球護膚市場進行詳細分析,涵蓋所有主要細分市場,包括產品類型、分銷管道、包裝、產品類型、性別、成分類型和地區。
- 護膚市場概覽:本報告對競爭格局進行了詳細評估,涵蓋了製造商的成立年份、公司規模、總部所在地、產品類型、應用、配方、包裝和目標性別細分市場。
- 公司簡介:詳細介紹護膚產業領導者。資訊包括成立年份、總部所在地、公司規模、經營團隊、產品系列、財務績效和近期措施。
- 波特五力分析:本分析定性地考察了影響該行業的五種競爭力量:新進入者的威脅、買方的議價能力、供應商的議價能力、替代品的威脅以及現有競爭對手之間的競爭。
- 大趨勢分析:對塑造產業的大趨勢進行定性評估,包括無水美容、人工智慧和擴增實境驅動的個人化、數位化和電子商務、清潔和永續美容以及不斷變化的監管準則。
- 市場影響分析:本分析檢視了影響護膚市場成長軌跡的關鍵促進因素、限制因素、機會與挑戰。
本報告解答的主要問題
- 護膚市場的主要參與者有哪些?
- 哪些地區正在推動護膚市場的發展?哪些地區成長速度最快?
- 護膚產業的主要趨勢有哪些?
- 哪些因素可能會影響該市場的未來發展?
- 護膚品生產商面臨的主要挑戰是什麼?
- 目前和未來的市場規模是多少?
- 到 2035 年,該市場的複合年成長率是多少?
- 目前和未來的市場機會在主要細分市場中的分佈如何?
購買本報告的理由
Roots Analysis 將專有的一手研究與嚴格的二手檢驗相結合,提供關於護膚市場的情報,超越了單純的市場規模估算,為相關人員提供所需的深刻見解,以便他們能夠自信地採取行動。
- 詳細且多方面的細分:市場分析基於九個不同的參數,包括產品應用、用途部位、分銷管道、包裝、類別、性別、成分類型和地區,幫助相關人員識別與其業務相關的特定機會。
- 基於三種情景的預測模型:針對每個細分市場,建立保守、基本和樂觀情景,使投資者和策略團隊能夠針對各種可能的市場趨勢對假設進行壓力測試,而不是依賴單一的估計值。
- 投資者企業資料:詳細介紹護膚行業領先公司和新興企業的財務表現、經營團隊、產品系列和近期策略舉措,以協助進行實質審查、基準測試和競爭分析。
- 追蹤交易和資金籌措趨勢:本報告涵蓋了護膚行業的最新資金籌措輪次、併購交易和合作活動,即時洞察資本和戰略利益的集中方向。
- 免費分析成果:您購買的產品包含一個可編輯的 Excel 資料包(相容於所有分析模組)和一個免費的 PowerPoint 摘要,從而加快相關人員在工作中利用研究成果的速度。
目錄
第1章 背景
第2章:調查方法
第3章 經濟及其他項目特定考量因素
第4章執行摘要
第5章:引言
第6章 市場概況:護膚市場的主要公司
第7章:公司簡介
- 章節概要
- 護膚市場的主要公司
- Amorepacific
- Coty
- Estee Lauder
- Galderma
- Kao
- L'Oreal
- LVMH
- Procter &Gamble
- Shiseido
- Unilever
- 護膚市場的其他公司
- Beiersdorf
- Chanel
- Colgate-Palmolive
- Clarins
- Cult Beauty
- Deciem
- Johnson &Johnson
- Natura &Co
- Revlon
- Shanghai Jahwa
第8章:波特五力模型分析
第9章:護膚市場:大趨勢分析
第10章 市場影響分析:促進因素、阻礙因素、機會與挑戰
第11章:全球護膚市場
第12章:護膚市場,依產品類型(依應用)分類
第13章:護膚市場,依產品類型(依身體部位)分類
第14章:護膚市場(依通路分類)
第15章:護膚市場(依線下通路分類)
第16章:護膚市場(依包裝類型分類)
第17章:護膚市場(依產品類型)
第18章:護膚市場(依性別分類)
第19章:護膚市場(依成分分類)
第20章:護膚市場(依地區分類)
第21章:高階主管洞察
第22章附錄1:表格形式數據
第23章 附錄2:公司與組織列表
SKINCARE MARKET: OVERVIEW
As per Roots Analysis, the global skincare market is estimated to grow from USD 198.5 billion in the current year to USD 407 billion by 2035, at an impressive CAGR of 7.4%, during the forecast period, till 2035.
Skincare Market: Growth and Trends
Skin care has moved from an occasional cosmetic indulgence to a routine, multi-step daily practice for consumers across income brackets and geographies. Rising disposable income, greater exposure to global beauty standards through social media, and growing awareness of the long-term effects of pollution, sun exposure, and lifestyle stress on skin condition are together sustaining demand for skincare products.
Historically, skincare purchasing decisions were driven primarily by brand recognition and price. However, consumers are now increasingly ingredient-literate, analysing formulations for actives such as retinoids, peptides, hyaluronic acid, and niacinamide. They are favoring brands that can substantiate efficacy claims with clinical or dermatological evidence. This has elevated the role of research and development in brand differentiation and is prompting legacy consumer goods companies to acquire or partner with clinically oriented, direct-to-consumer skincare brands.
In response, manufacturers are investing in multifunctional formulations, clean and sustainably sourced ingredients, and personalization technologies such as AI-enabled skin diagnostics. Regulatory bodies across major markets have also focused on ingredient safety disclosures and sustainable packaging norms, pushing the industry toward greater formulation transparency. Taken together, these shifts indicate a market that is transitioning from broad-based volume growth toward value growth anchored in efficacy, personalization, and trust.
Growth Drivers: Factors Fueling Expansion of the Global Skincare Market
A primary driver of market expansion is the growing awareness of everyday self-care routines among the global population. Consumers are layering multiple products into their regimens rather than relying on a single all-purpose item. This behavioural shift has been reinforced by technological progress in product formulation and use of digital tools, including artificial intelligence-enabled skin assessment platforms, for customer engagement and personalization.
Personalized skincare, in particular, is emerging as a key trend, as products tailored to an individual's skin profile are perceived to deliver more consistent outcomes than generic formulations. In addition, mounting consumer concern regarding the long-term health and environmental impact of synthetic ingredients has fueled demand for clean-label and naturally derived products. This trend is prompting sustained investment in natural sourcing and green chemistry across the value chain.
Market Challenges: Critical Barriers Hindering Progress
Despite high demand, the skincare market is witnessing several challenges. Increasing price competition from mass-market and private-label brands is reducing mid-tier margins, while the growing volume of similar ingredient claims is making it difficult for consumers to distinguish products based on efficacy. Additionally, tightening regulatory scrutiny of ingredient disclosures and sustainable packaging requirements in key markets is raising compliance costs, particularly for smaller and emerging brands with limited regulatory infrastructure.
Skincare Market: Key Insights
The report examines the current state of the global skincare industry and identifies potential growth opportunities available to stakeholders across the value chain. Some of the key findings include:
- Sustained Early-Stage Capital Flow: Skincare-focused brands and platforms continue to attract seed and early-stage funding, reflecting continued investor appetite for efficacy-driven, digitally native skincare businesses, particularly in high-growth markets such as India and Southeast Asia.
- Active Consolidation by Strategics: Larger beauty and consumer goods conglomerates continue to acquire innovative, clinically positioned skincare brands to strengthen their premium and dermatology based cosmetic portfolios, a trend that is expected to continue as legacy players seek faster routes to category leadership.
- Asia-Pacific as the Innovation and Volume Epicenter: The region combines the largest consumer base with the most culturally embedded, multi-step skincare routines, making it both the leading revenue contributor and a preferred launch market for premium global brands.
- Premiumization in Mature Markets: North America and parts of Europe are witnessing a pronounced shift toward clinically backed, dermatologist-endorsed "dermaceutical" products, supporting higher price realization even amid slower volume growth.
- Key Watch-Point: The pace at which regulatory frameworks around ingredient transparency and sustainable packaging evolve across regions is likely to be a key determinant of competitive positioning and is a metric investor and operators alike should track closely.
Skincare Market Segments
The market sizing and opportunity analysis has been segmented across the following parameters:
By Type of Product (by Application)
- Skin Cleansers
- Skin Moisturizers
- Anti-aging Products
- Sun Protectors
- Others
By Type of Product (by Body Part)
- Facial Care Products
- Body Care Products
- Lip and Eye Care Products
By Distribution Channel
- Online Distribution Channels
- Offline Distribution Channels
- Convenience Stores
- Supermarkets
- Pharmacies
By Type of Packaging
- Tubes
- Bottles
- Jars
- Others
By Product Category
- Luxury Skincare Products
- Mass Skincare Products
By Gender
- Men
- Women
- Other Genders
By Type of Ingredient
- Natural Ingredients
- Chemical Ingredients
By Geographical Regions
- North America
- US
- Canada
- Mexico
- Europe
- Germany
- France
- Italy
- UK
- Spain
- Rest of Europe
- Asia-Pacific
- China
- Japan
- South Korea
- India
- Australia
- Rest of Asia-Pacific
- Latin America
- Brazil
- Argentina
- Rest of Latin America
- Middle East and Africa
- Africa
- UAE
- Rest of Middle East and Africa
Skincare Market: Key Segmentation Insights
Skin Cleansers Hold Highest Share by Application
Based on market assessment, skin cleansers account for the largest share (approximately 42%) of the skincare market by type of product application. This leadership position is largely because cleansing is a a non-negotiable, twice-daily step in nearly every skincare routine, unlike moisturizers or treatment products that may be used more selectively. Rising awareness around double cleansing to remove pollutants, sebum, sunscreen, and makeup residue, particularly among millennial and Gen Z consumers, continues to reinforce repeat purchase frequency within this category.
On the other hand, anti-aging products are projected to register the highest CAGR of 7.2% during the forecast period. Growth is being driven by earlier adoption of preventive skincare among younger consumers, increasing dermatologist and influencer-led education around actives such as retinol, peptides, and niacinamide, and a growing base of older consumers across North America, Europe, and Asia-Pacific seeking effective age-related solutions.
Facial Products Lead the Market by Body Part
Facial care products hold the highest share of the market. This highest share is driven by the universal focus on facial appearance across nearly every age cohort. Meanwhile, lip and eye care products are emerging as the fastest-growing sub-segment, propelled by growing consumer focus on these delicate areas, particularly among working professionals seeking solutions for fatigue and fine lines.
Offline Channel Secures the Highest Share
Offline distribution channels, comprising supermarkets, specialty beauty retailers, pharmacies, and dermatology clinics, currently capture the largest share of the market. This highest share reflects continued consumer preference for physically evaluating products prior to purchase, particularly in developing markets across Asia, Africa, and Latin America.
However, online distribution channels are expected to expand at the fastest CAGR through the forecast period. This highest growth is driven by the growing influence of e-commerce platforms, personalized digital recommendations, and influencer-linked shopping journeys among younger consumers.
Bottles Occupy the Largest Share
Bottles account for the largest share of the skincare packaging segment, owing to their versatility across product formats and strong consumer familiarity. Tubes, meanwhile, are the fastest-growing packaging format, benefiting from their alignment with consumer preferences around hygiene, portability, and sustainability, and are particularly favored for sunscreens, acne treatments, and other contamination-sensitive formulations.
Women Represent the Largest Consumer Base; Men's Skincare Emerges as the Fastest Growing Segment
Women continue to represent the majority share of skincare consumption, supported by deep cultural association of skincare with self-care and grooming, and a greater propensity to follow multi-step routines. The men's skincare segment, however, is emerging as the fastest-growing segment, driven by increasing normalization of grooming routines among millennial and Gen Z men, and growing brand investment in gender-specific formulations targeting concerns such as razor burn and oiliness.
Asia-Pacific Holds the Highest Share and North America Grows at Higher CAGR
According to our projections, Asia-Pacific holds the largest regional share (close to 35%) of the global skincare market. This dominance is underpinned by deep-rooted cultural emphasis on daily skin health rituals across China, Japan, South Korea, and India, alongside a rapidly expanding middle-class consumer base.
Meanwhile, North America is projected to grow at the highest CAGR of 7.0% during the forecast period. This growth is driven by a pronounced consumer shift toward clinically backed "dermaceutical" products and rising adoption of advanced, clean-labeled skincare solutions.
Example Players in Skincare Market
- Amorepacific
- Beiersdorf
- Chanel
- Coty
- Estee Lauder
- Galderma
- Johnson & Johnson
- Kao Corporation
- L'Oreal
- LVMH
- Procter & Gamble
- Shiseido
- Unilever
SKINCARE MARKET: RESEARCH COVERAGE
- Market Sizing and Opportunity Analysis: An in-depth analysis of the global skincare market, covering all key segments, including type of product, distribution channel, packaging, product category, gender, ingredient type, and geography.
- Skincare Market Landscape: A detailed assessment of the competitive landscape, capturing manufacturers by year of establishment, company size, headquarters location, product type, product application, formulation, packaging, and target gender segment.
- Company Profiles: In-depth profiles of prominent players engaged in the skincare industry, featuring information on their year of establishment, headquarters, company size, leadership team, product portfolio, financial performance, and recent initiatives.
- Porter's Five Forces Analysis: A qualitative analysis of the five competitive forces shaping this industry, namely threat of new entrants, bargaining power of buyers, bargaining power of suppliers, threat of substitutes, and rivalry among existing competitors.
- Megatrends Analysis: A qualitative assessment of the megatrends shaping the industry, including waterless beauty, AI and AR-enabled personalization, digitization and e-commerce, clean and sustainable beauty, and evolving regulatory guidelines.
- Market Impact Analysis: An analysis of the key drivers, restraints, opportunities, and challenges influencing the growth trajectory of the skincare market.
Key Questions Answered in this Report
- Which are the leading companies in the skincare market?
- Which region dominates the skincare market, and which is growing fastest?
- What are the key trends observed across the skincare industry?
- What factors are likely to influence the evolution of this market?
- What are the primary challenges faced by skincare product manufacturers?
- What is the current and future market size?
- What is the CAGR of this market through 2035?
- How is the current and future market opportunity distributed across key segments?
Reasons to Buy this Report
Roots Analysis combines proprietary primary research with rigorous secondary validation to deliver skincare market intelligence that goes beyond headline market sizing, equipping stakeholders with the depth of insight needed to act with confidence.
- Granular, Multi-Parameter Segmentation: The market is dissected across nine distinct parameters, including product application, body part, distribution channel, packaging, category, gender, ingredient type, and geography, enabling stakeholders to isolate the precise opportunity relevant to their business.
- Three-Scenario Forecast Modelling: Conservative, base, and optimistic forecast scenarios are built for every segment, allowing investors and strategy teams to stress-test assumptions against a range of plausible market trajectories rather than relying on a single point estimate.
- Investor-Grade Company Intelligence: In-depth profiles of leading and emerging skincare players cover financial performance, leadership composition, product portfolios, and recent strategic initiatives, supporting due diligence, benchmarking, and competitive mapping exercises.
- Deal and Funding Tracking: The report captures recent funding rounds, M&A transactions, and partnership activity across the skincare ecosystem, offering a real-time lens on where capital and strategic interest are concentrated.
- Complimentary Analytical Deliverables: Every purchase includes editable Excel data packs for all analytical modules and a complimentary PowerPoint summary, reducing the time stakeholders need to operationalize the findings internally.
Additional Benefits
- 15% Free Content Customization
- Detailed Report Walkthrough Session with Research Team
- Free Updated report if the report is 6-12 months old or older
TABLE OF CONTENTS
1. BACKGROUND
- 1.1. Context
- 1.2. Project Objectives
2. RESEARCH METHODOLOGY
- 2.1. Chapter Overview
- 2.2. Research Assumptions
- 2.3. Project Methodology
- 2.4. Forecast Methodology
- 2.5. Robust Quality Control
- 2.6. Key Market Segmentations
- 2.7. Key Considerations
- 2.7.1. Demographics
- 2.7.2. Economic Factors
- 2.7.3. Government Regulations
- 2.7.4. Supply Chain
- 2.7.5. COVID Impact
- 2.7.6. Market Access
- 2.7.7. Healthcare Policies
- 2.7.8. Industry Consolidation
3. ECONOMIC AND OTHER PROJECT SPECIFIC CONSIDERATIONS
- 3.1. Chapter Overview
- 3.2. Market Dynamics
- 3.2.1. Time Period
- 3.2.1.1. Historical Trends
- 3.2.1.2. Current and Forecasted Estimates
- 3.2.2. Currency Coverage and Foreign Exchange Rate
- 3.2.2.1. Major Currencies Affecting the Market
- 3.2.2.2. Factors affecting Currency Fluctuations and Foreign Exchange Rates
- 3.2.2.3. Impact of Foreign Exchange Rate Volatility on Market
- 3.2.2.4. Strategies For Mitigating Foreign Exchange Risk
- 3.2.3. Trade Policies
- 3.2.3.1. Impact of Trade Barriers on the Market
- 3.2.3.2. Strategies for Mitigating the Risks Associated with Trade Barriers
- 3.2.4. Recession
- 3.2.4.1. Historical Analysis of Past Recessions and Lessons Learnt
- 3.2.4.2. Assessment of Current Economic Conditions and Potential Impact on the Market
- 3.2.5. Inflation
- 3.2.5.1. Measurement and Analysis of Inflationary Pressures in the Economy
- 3.2.5.2. Potential Impact of Inflation on the Market Evolution
- 3.2.1. Time Period
4. EXECUTIVE SUMMARY
5. INTRODUCTION
- 5.1. Overview of the Skincare Industry
- 5.1.1. Factors Contributing to Improper Skin Health
- 5.2. Rise of the Clean Beauty Movement
- 5.2.1. Key Principles of Clean Beauty
- 5.3. Challenges Prevailing in the Skincare Industry
- 5.4. Recent Developments in the Skincare Industry
- 5.5. Future Perspectives
6. MARKET LANDSCAPE: LEADING PLAYERS IN THE SKINCARE MARKET
- 6.1. Skincare Market: Market Landscape of Leading Players
- 6.1.1. Analysis by Year of Establishment
- 6.1.2. Analysis by Company Size
- 6.1.3. Analysis by Company Size and Year of Establishment
- 6.1.4. Analysis by Location of Headquarters
- 6.1.5. Analysis by Company Size and Location of Headquarters
- 6.1.6. Analysis by Type of Product
- 6.1.7. Analysis by Product Application
- 6.1.8. Analysis by Product Formulation
- 6.1.9. Analysis by Type of Packaging
- 6.1.10. Analysis by Gender
7. COMPANY PROFILES
- 7.1. Chapter Overview
- 7.2. Leading Players in the Skincare Market
- 7.2.1. Amorepacific
- 7.2.1.1. Company Overview
- 7.2.1.2. Product Portfolio
- 7.2.1.3. Financial Details
- 7.2.1.4. Recent Developments and Future Outlook
- 7.2.2. Coty
- 7.2.2.1. Company Overview
- 7.2.2.2. Product Portfolio
- 7.2.2.3. Financial Details
- 7.2.2.4. Recent Developments and Future Outlook
- 7.2.3. Estee Lauder
- 7.2.3.1. Company Overview
- 7.2.3.2. Product Portfolio
- 7.2.3.3. Financial Details
- 7.2.3.4. Recent Developments and Future Outlook
- 7.2.4. Galderma
- 7.2.4.1. Company Overview
- 7.2.4.2. Product Portfolio
- 7.2.4.3. Financial Details
- 7.2.4.4. Recent Developments and Future Outlook
- 7.2.5. Kao
- 7.2.5.1. Company Overview
- 7.2.5.2. Product Portfolio
- 7.2.5.3. Financial Details
- 7.2.5.4. Recent Developments and Future Outlook
- 7.2.6. L'Oreal
- 7.2.6.1. Company Overview
- 7.2.6.2. Product Portfolio
- 7.2.6.3. Financial Details
- 7.2.6.4. Recent Developments and Future Outlook
- 7.2.7. LVMH
- 7.2.7.1. Company Overview
- 7.2.7.2. Product Portfolio
- 7.2.7.3. Financial Details
- 7.2.7.4. Recent Developments and Future Outlook
- 7.2.8. Procter & Gamble
- 7.2.8.1. Company Overview
- 7.2.8.2. Product Portfolio
- 7.2.8.3. Financial Details
- 7.2.8.4. Recent Developments and Future Outlook
- 7.2.9. Shiseido
- 7.2.9.1. Company Overview
- 7.2.9.2. Product Portfolio
- 7.2.9.3. Financial Details
- 7.2.9.4. Recent Developments and Future Outlook
- 7.2.10. Unilever
- 7.2.10.1. Company Overview
- 7.2.10.2. Product Portfolio
- 7.2.10.3. Financial Details
- 7.2.10.4. Recent Developments and Future Outlook
- 7.2.1. Amorepacific
- 7.3. Other Prominent Players in the Skincare Market
- 7.3.1 Beiersdorf
- 7.3.1.1 Company Overview
- 7.3.1.2. Product Portfolio
- 7.3.2. Chanel
- 7.3.2.1 Company Overview
- 7.3.2.2. Product Portfolio
- 7.3.3. Colgate-Palmolive
- 7.3.3.1 Company Overview
- 7.3.3.2. Product Portfolio
- 7.3.4. Clarins
- 7.3.4.1 Company Overview
- 7.3.4.2. Product Portfolio
- 7.3.5. Cult Beauty
- 7.3.5.1 Company Overview
- 7.3.5.2. Product Portfolio
- 7.3.6. Deciem
- 7.3.6.1 Company Overview
- 7.3.6.2. Product Portfolio
- 7.3.7. Johnson & Johnson
- 7.3.7.1 Company Overview
- 7.3.7.2. Product Portfolio
- 7.3.8. Natura & Co
- 7.3.8.1 Company Overview
- 7.3.8.2. Product Portfolio
- 7.3.9. Revlon
- 7.3.9.1 Company Overview
- 7.3.9.2. Product Portfolio
- 7.3.10. Shanghai Jahwa
- 7.3.10.1 Company Overview
- 7.3.10.2. Product Portfolio
- 7.3.1 Beiersdorf
8. PORTER'S FIVE FORCES ANALYSIS
- 8.1. Chapter Overview
- 8.2. Research Methodology
- 8.3. Key Parameters
- 8.3.1. Threats to New Entrants
- 8.3.2. Bargaining Power of Buyers
- 8.3.3. Bargaining Power of Product Providers
- 8.3.4. Threats of Substitute Products
- 8.3.5. Rivalry among Existing Competitors
- 8.4. Harvey Ball Analysis
- 8.5. Concluding Remarks
9. SKINCARE MARKET: MEGATRENDS ANALYSIS
- 9.1 Megatrends in the Skincare Market
- 9.1.1. Adoption of Waterless Beauty Products
- 9.1.2. Personalized Skincare with AI and AR
- 9.1.3. Digitization and E-commerce
- 9.1.4. Inclusion of Innovative Bio-products
- 9.1.5. Adoption of Clean Beauty and Sustainable Practices
- 9.1.6. Promoting Brands on Social Media
- 9.1.7. Influence of Gaming and Metaverse
- 9.1.8. The Evolving Regulatory Guidelines
10. MARKET IMPACT ANALYSIS: DRIVERS, RESTRAINTS, OPPORTUNITIES AND CHALLENGES
- 10.1. Chapter Overview
- 10.2. Market Drivers
- 10.3. Market Restraints
- 10.4. Market Opportunities
- 10.5. Market Challenges
- 10.6. Conclusion
11. GLOBAL SKINCARE MARKET
- 11.1. Assumptions and Methodology
- 11.2. Global Skincare Market, Historical Trends (Since 2018) and Forecasted Estimates (Till 2035)
- 11.2.1. Scenario Analysis
- 11.2.1.1. Conservative Scenario
- 11.2.1.2. Optimistic Scenario
- 11.2.2. Key Market Segmentations
- 11.2.1. Scenario Analysis
12. SKINCARE MARKET, BY TYPE OF PRODUCT (BY APPLICATION)
- 12.1. Assumptions and Methodology
- 12.2. Skincare Market: Distribution by Type of Product (by Application), Till 2035
- 12.2.1. Skincare Market for Skin Cleansers: Historical Trends (Since 2018) and Forecasted Estimates (Till 2035)
- 12.2.2. Skincare Market for Skin Moisturizers: Historical Trends (Since 2018) and Forecasted Estimates (Till 2035)
- 12.2.3. Skincare Market for Anti-aging Products: Historical Trends (Since 2018) and Forecasted Estimates (Till 2035)
- 12.2.4. Skincare Market for Sun Protectors and Others: Historical Trends (Since 2018) and Forecasted Estimates (Till 2035)
- 12.3. Data Triangulation and Validation
13. SKINCARE MARKET, BY TYPE OF PRODUCT (BY BODY PART)
- 13.1. Assumptions and Methodology
- 13.2. Skincare Market: Distribution by Type of Product (by Body Part), Till 2035
- 13.2.1. Skincare Market for Facial Care Products: Historical Trends (Since 2018) and Forecasted Estimates (Till 2035)
- 13.2.2. Skincare Market for Body Care Products: Historical Trends (Since 2018) and Forecasted Estimates (Till 2035)
- 13.2.3. Skincare Market for Lip and Eye Care Products: Historical Trends (Since 2018) and Forecasted Estimates (Till 2035)
- 13.3. Data Triangulation and Validation
14. SKINCARE MARKET, BY DISTRIBUTION CHANNEL
- 14.1. Assumptions and Methodology
- 14.2. Skincare Market: Distribution by Distribution Channel, Till 2035
- 14.2.1. Skincare Market for Online Distribution Channels: Historical Trends (Since 2018) and Forecasted Estimates (Till 2035)
- 14.2.2. Skincare Market for Offline Distribution Channels: Historical Trends (Since 2018) and Forecasted Estimates (Till 2035)
- 14.3. Data Triangulation and Validation
15. SKINCARE MARKET, BY TYPE OF OFFLINE DISTRIBUTION CHANNEL
- 15.1. Assumptions and Methodology
- 15.2. Skincare Market: Distribution by Type of Offline Distribution Channel, Till 2035
- 15.2.1. Skincare Market for Convenience Stores: Historical Trends (Since 2018) and Forecasted Estimates (Till 2035)
- 15.2.2. Skincare Market for Super Markets: Historical Trends (Since 2018) and Forecasted Estimates (Till 2035)
- 15.2.3. Skincare Market for Pharmacies: Historical Trends (Since 2018) and Forecasted Estimates (Till 2035)
- 15.3. Data Triangulation and Validation
16. SKINCARE MARKET, BY TYPE OF PACKAGING
- 16.1. Assumptions and Methodology
- 16.2. Skincare Market: Distribution by Type of Packaging, Till 2035
- 16.2.1. Skincare Market for Tubes: Historical Trends (Since 2018) and Forecasted Estimates (Till 2035)
- 16.2.2. Skincare Market for Bottles: Historical Trends (Since 2018) and Forecasted Estimates (Till 2035)
- 16.2.3. Skincare Market for Jars: Historical Trends (Since 2018) and Forecasted Estimates (Till 2035)
- 16.2.4. Skincare Market for Others: Historical Trends (Since 2018) and Forecasted Estimates (Till 2035)
- 16.3. Data Triangulation and Validation
17. SKINCARE MARKET, BY PRODUCT CATEGORY
- 17.1. Assumptions and Methodology
- 17.2. Skincare Market: Distribution by Product Category, Till 2035
- 17.2.1. Skincare Market for Luxury Skincare Products: Historical Trends (Since 2018) and Forecasted Estimates (Till 2035)
- 17.2.2. Skincare Market for Mass Skincare Products: Historical Trends (Since 2018) and Forecasted Estimates (Till 2035)
- 17.3. Data Triangulation and Validation
18. SKINCARE MARKET, BY GENDER
- 18.1. Assumptions and Methodology
- 18.2. Skincare Market: Distribution by Gender, Till 2035
- 18.2.1. Skincare Market for Men: Historical Trends (Since 2018) and Forecasted Estimates (Till 2035)
- 18.2.2. Skincare Market for Women: Historical Trends (Since 2018) and Forecasted Estimates (Till 2035)
- 18.2.3. Skincare Market for Other Genders: Historical Trends (Since 2018) and Forecasted Estimates (Till 2035)
- 18.3. Data Triangulation and Validation
19. SKINCARE MARKET, BY TYPE OF INGREDIENT
- 19.1. Assumptions and Methodology
- 19.2. Skincare Market: Distribution by Type of Ingredient, Till 2035
- 19.2.1. Skincare Market for Natural Ingredients: Historical Trends (Since 2018) and Forecasted Estimates (Till 2035)
- 19.2.2. Skincare Market for Chemical Ingredients: Historical Trends (Since 2018) and Forecasted Estimates (Till 2035)
- 19.3. Data Triangulation and Validation
20. SKINCARE MARKET, BY GEOGRAPHY
- 20.1. Assumptions and Methodology
- 20.2. Skincare Market: Distribution by Geography, Till 2035
- 20.2.1. Skincare Market in North America: Historical Trends (Since 2018) and Forecasted Estimates (Till 2035)
- 20.2.1.1. Skincare Market in the US: Historical Trends (Since 2018) and Forecasted Estimates (Till 2035)
- 20.2.1.2. Skincare Market in Canada: Historical Trends (Since 2018) and Forecasted Estimates (Till 2035)
- 20.2.1.3. Skincare Market in Mexico: Historical Trends (Since 2018) and Forecasted Estimates (Till 2035)
- 20.2.2. Skincare Market in Europe: Historical Trends (Since 2018) and Forecasted Estimates (Till 2035)
- 20.2.2.1. Skincare Market in Germany: Historical Trends (Since 2018) and Forecasted Estimates (Till 2035)
- 20.2.2.2. Skincare Market in France: Historical Trends (Since 2018) and Forecasted Estimates (Till 2035)
- 20.2.2.3. Skincare Market in Italy: Historical Trends (Since 2018) and Forecasted Estimates (Till 2035)
- 20.2.2.4. Skincare Market in the UK: Historical Trends (Since 2018) and Forecasted Estimates (Till 2035)
- 20.2.2.5. Skincare Market in Spain: Historical Trends (Since 2018) and Forecasted Estimates (Till 2035)
- 20.2.2.6. Skincare Market in Rest of Europe: Historical Trends (Since 2018) and Forecasted Estimates (Till 2035)
- 20.2.3. Skincare Market in Asia-Pacific: Historical Trends (Since 2018) and Forecasted Estimates (Till 2035)
- 20.2.3.1. Skincare Market in China: Historical Trends (Since 2018) and Forecasted Estimates (Till 2035)
- 20.2.3.2. Skincare Market in Japan: Historical Trends (Since 2018) and Forecasted Estimates (Till 2035)
- 20.2.3.3. Skincare Market in South Korea: Historical Trends (Since 2018) and Forecasted Estimates (Till 2035)
- 20.2.3.4. Skincare Market in India: Historical Trends (Since 2018) and Forecasted Estimates (Till 2035)
- 20.2.3.5. Skincare Market in Australia: Historical Trends (Since 2018) and Forecasted Estimates (Till 2035)
- 20.2.3.6. Skincare Market in Rest of Asia-Pacific: Historical Trends (Since 2018) and Forecasted Estimates (Till 2035)
- 20.2.4. Skincare Market in Latin America: Historical Trends (Since 2018) and Forecasted Estimates (Till 2035)
- 20.2.4.1. Skincare Market in Brazil: Historical Trends (Since 2018) and Forecasted Estimates (Till 2035)
- 20.2.4.2. Skincare Market in Argentina: Historical Trends (Since 2018) and Forecasted Estimates (Till 2035)
- 20.2.4.3. Skincare Market in Rest of Latin America: Historical Trends (Since 2018) and Forecasted Estimates (Till 2035)
- 20.2.5. Skincare Market in Middle East and Africa: Historical Trends (Since 2018) and Forecasted Estimates (Till 2035)
- 20.2.5.1. Skincare Market in Africa: Historical Trends (Since 2018) and Forecasted Estimates (Till 2035)
- 20.2.5.2. Skincare Market in UAE: Historical Trends (Since 2018) and Forecasted Estimates (Till 2035)
- 20.2.5.3. Skincare Market in Rest of Middle East and Africa: Historical Trends (Since 2018) and Forecasted Estimates (Till 2035)
- 20.2.1. Skincare Market in North America: Historical Trends (Since 2018) and Forecasted Estimates (Till 2035)
- 20.3. Data Triangulation and Validation
21. EXECUTIVE INSIGHTS
22. APPENDIX 1: TABULATED DATA
23. APPENDIX 2: LIST OF COMPANIES AND ORGANIZATIONS
List of Tables
- Table 6.1 List of Leading Skincare Product Manufacturers
- Table 7.1 Amorepacific: Product Portfolio
- Table 7.2 Coty: Product Portfolio
- Table 7.3 Estee Lauder: Product Portfolio
- Table 7.4 Galderma: Product Portfolio
- Table 7.5 Kao: Product Portfolio
- Table 7.6 L'Oreal: Product Portfolio
- Table 7.7 LVMH: Product Portfolio
- Table 7.8 Procter & Gamble: Product Portfolio
- Table 7.9 Shiseido: Product Portfolio
- Table 7.10 Unilever: Product Portfolio
- Table 7.11 Beiersdorf: Product Portfolio
- Table 7.12 Chanel: Product Portfolio
- Table 7.13 Colgate-Palmolive: Product Portfolio
- Table 7.14 Clarins: Product Portfolio
- Table 7.15 Cult Beauty: Product Portfolio
- Table 7.16 Deciem: Product Portfolio
- Table 7.17 Johnson & Johnson: Product Portfolio
- Table 7.18 Natura & Co: Product Portfolio
- Table 7.19 Revlon: Product Portfolio
- Table 7.20 Shanghai Jahwa: Product Portfolio
- Table 22.1 Skincare Market: Distribution by Year of Establishment
- Table 22.2 Skincare Market: Distribution by Company Size
- Table 22.3 Skincare Market: Distribution by Company Size and Year of Establishment
- Table 22.4 Skincare Market: Distribution by Location of Headquarters
- Table 22.5 Skincare Market: Distribution by Company Size and Location of Headquarters
- Table 22.6 Skincare Market: Distribution by Type of Product
- Table 22.7 Skincare Market: Distribution by Product Application
- Table 22.8 Skincare Market: Distribution by Product Formulation
- Table 22.9 Skincare Market: Distribution by Type of Packaging
- Table 22.10 Skincare Market: Distribution by Gender
- Table 22.11 Amorepacific: Annual Revenues, FY 2021- FY 2023 (USD Billion)
- Table 22.12 Coty: Annual Revenues, FY 2021- FY 2023 (USD Billion)
- Table 22.13 Estee Lauder: Annual Revenues, FY 2021- FY 2023 (USD Billion)
- Table 22.14 Galderma: Annual Revenues, FY 2021-FY 2023 (USD Billion)
- Table 22.15 Kao: Annual Revenues, FY 2018-FY 2023 (JPY Billion)
- Table 22.16 L'Oreal: Annual Revenues, FY 2021-FY 2023 (EUR Billion)
- Table 22.17 LVMH: Annual Revenues, FY 2021-FY 2023 (EUR Billion)
- Table 22.18 Procter & Gamble: Annual Revenues, FY 2021-FY 2023 (USD Billion)
- Table 22.19 Shiseido: Annual Revenues, FY 2021-FY 2023 (JPY Billion)
- Table 22.20 Unilever: Annual Revenues, FY 2021-FY 2023 (EUR Billion)
- Table 22.21 Global Skincare Market, Historical Trends (Since 2018) (USD Billion)
- Table 22.22 Global Skincare Market, Forecasted Estimates (Till 2035): Conservative, Base and Optimistic Scenarios (USD Billion)
- Table 22.23 Skincare Market: Distribution by Type of Product (by Application), Till 2035 (USD Billion)
- Table 22.24 Skincare Market for Skin Cleansers: Historical Trends (Since 2018) (USD Billion)
- Table 22.25 Skincare Market for Skin Cleansers: Forecasted Estimates (Till 2035), Conservative, Base and Optimistic Scenarios (USD Billion)
- Table 22.26 Skincare Market for Skin Moisturizers: Historical Trends (Since 2018) (USD Billion)
- Table 22.27 Skincare Market for Skin Moisturizers: Forecasted Estimates (Till 2035), Conservative, Base and Optimistic Scenarios
- Table 22.28 Skincare Market for Anti-aging Products: Historical Trends (Since 2018) (USD Billion)
- Table 22.29 Skincare Market for Anti-aging Products: Forecasted Estimates (Till 2035), Conservative, Base and Optimistic Scenarios (USD Billion)
- Table 22.30 Skincare Market for Sun Protectors and Others: Historical Trends (Since 2018) (USD Billion)
- Table 22.31 Skincare Market for Sun Protectors and Others: Forecasted Estimates (Till 2035), Conservative, Base and Optimistic Scenarios (USD Billion)
- Table 22.32 Skincare Market: Distribution by Type of Product (by Body Part), Till 2035 (USD Billion)
- Table 22.33 Skincare Market for Facial Care Products: Historical Trends (Since 2018) (USD Billion)
- Table 22.34 Skincare Market for Facial Care Products: Forecasted Estimates (Till 2035), Conservative, Base and Optimistic Scenarios (USD Billion)
- Table 22.35 Skincare Market for Body Care Products: Historical Trends (Since 2018) (USD Billion)
- Table 22.36 Skincare Market for Body Care Products: Forecasted Estimates (Till 2035), Conservative, Base and Optimistic Scenarios (USD Billion)
- Table 22.37 Skincare Market for Lip and Eye Care Products: Historical Trends (Since 2018) (USD Billion)
- Table 22.38 Skincare Market for Lip and Eye Care Products: Forecasted Estimates (Till 2035), Conservative, Base and Optimistic Scenarios (USD Billion)
- Table 22.39 Skincare Market: Distribution by Distribution Channel, Till 2035 (USD Billion)
- Table 22.40 Skincare Market for Online Distribution Channels: Historical Trends (Since 2018) (USD Billion)
- Table 22.41 Skincare Market for Online Distribution Channels: Forecasted Estimates (Till 2035), Conservative, Base and Optimistic Scenarios (USD Billion)
- Table 22.42 Skincare Market for Offline Distribution Channels: Historical Trends (Since 2018) (USD Billion)
- Table 22.43 Skincare Market for Offline Distribution Channels: Forecasted Estimates (Till 2035), Conservative, Base and Optimistic Scenarios (USD Billion)
- Table 22.44 Skincare Market: Distribution by Type of Offline Distribution Channel, Till 2035 (USD Billion)
- Table 22.45 Skincare Market for Convenience Stores: Historical Trends (Since 2018) (USD Billion)
- Table 22.46 Skincare Market for Convenience Stores: Forecasted Estimates (Till 2035), Conservative, Base and Optimistic Scenarios (USD Billion)
- Table 22.47 Skincare Market for Super Markets: Historical Trends (Since 2018) (USD Billion)
- Table 22.48 Skincare Market for Super Markets: Forecasted Estimates (Till 2035), Conservative, Base and Optimistic Scenarios (USD Billion)
- Table 22.49 Skincare Market for Pharmacies: Historical Trends (Since 2018) (USD Billion)
- Table 22.50 Skincare Market for Pharmacies: Forecasted Estimates (Till 2035), Conservative, Base and Optimistic Scenarios (USD Billion)
- Table 22.51 Skincare Market: Distribution by Type of Packaging, Till 2035 (USD Billion)
- Table 22.52 Skincare Market for Tubes: Historical Trends (Since 2018) (USD Billion)
- Table 22.53 Skincare Market for Tubes: Forecasted Estimates (Till 2035), Conservative, Base and Optimistic Scenarios (USD Billion)
- Table 22.54 Skincare Market for Bottles: Historical Trends (Since 2018) (USD Billion)
- Table 22.55 Skincare Market for Bottles: Forecasted Estimates (Till 2035), Conservative, Base and Optimistic Scenarios (USD Billion)
- Table 22.56 Skincare Market for Jars: Historical Trends (Since 2018) (USD Billion)
- Table 22.57 Skincare Market for Jars: Forecasted Estimates (Till 2035), Conservative, Base and Optimistic Scenarios (USD Billion)
- Table 22.58 Skincare Market for Other Type of Packaging: Historical Trends (Since 2018) (USD Billion)
- Table 22.59 Skincare Market for Other Type of Packaging: Forecasted Estimates (Till 2035), Conservative, Base and Optimistic Scenarios (USD Billion)
- Table 22.60 Skincare Market: Distribution by Product Category, Till 2035 (USD Billion)
- Table 22.61 Skincare Market for Luxury Skincare Products: Historical Trends (Since 2018) (USD Billion)
- Table 22.62 Skincare Market for Luxury Skincare Products: Forecasted Estimates (Till 2035), Conservative, Base and Optimistic Scenarios (USD Billion)
- Table 22.63 Skincare Market for Mass Skincare Products: Historical Trends (Since 2018) (USD Billion)
- Table 22.64 Skincare Market for Mass Skincare Products: Forecasted Estimates (Till 2035), Conservative, Base and Optimistic Scenarios (USD Billion)
- Table 22.65 Skincare Market: Distribution by Gender, Till 2035 (USD Billion)
- Table 22.66 Skincare Market for Men: Historical Trends (Since 2018) (USD Billion)
- Table 22.67 Skincare Market for Men: Forecasted Estimates (Till 2035), Conservative, Base and Optimistic Scenarios (USD Billion)
- Table 22.68 Skincare Market for Women: Historical Trends (Since 2018) (USD Billion)
- Table 22.69 Skincare Market for Women: Forecasted Estimates (Till 2035), Conservative, Base and Optimistic Scenarios (USD Billion)
- Table 22.70 Skincare Market for Other Genders: Historical Trends (Since 2018) (USD Billion)
- Table 22.71 Skincare Market for Other Genders: Forecasted Estimates (Till 2035), Conservative, Base and Optimistic Scenarios (USD Billion)
- Table 22.72 Skincare Market: Distribution by Type of Ingredient, Till 2035 (USD Billion)
- Table 22.73 Skincare Market for Natural Ingredients: Historical Trends (Since 2018) (USD Billion)
- Table 22.74 Skincare Market for Natural Ingredients: Forecasted Estimates (Till 2035), Conservative, Base and Optimistic Scenarios (USD Billion)
- Table 22.75 Skincare Market for Chemical Ingredients: Historical Trends (Since 2018) (USD Billion)
- Table 22.76 Skincare Market for Chemical Ingredients: Forecasted Estimates (Till 2035), Conservative, Base and Optimistic Scenarios (USD Billion)
- Table 22.77 Skincare Market: Distribution by Geography, Till 2035 (USD Billion)
- Table 22.78 Skincare Market in North America: Historical Trends (Since 2018) (USD Billion)
- Table 22.79 Skincare Market in North America: Forecasted Estimates (Till 2035), Conservative, Base and Optimistic Scenarios (USD Billion)
- Table 22.80 Skincare Market in the US: Historical Trends (Since 2018) (USD Billion)
- Table 22.81 Skincare Market in the US: Forecasted Estimates (Till 2035), Conservative, Base and Optimistic Scenarios (USD Billion)
- Table 22.82 Skincare Market in Canada: Historical Trends (Since 2018) (USD Billion)
- Table 22.83 Skincare Market in Canada: Forecasted Estimates (Till 2035), Conservative, Base and Optimistic Scenarios (USD Billion)
- Table 22.84 Skincare Market in Mexico: Historical Trends (Since 2018) (USD Billion)
- Table 22.85 Skincare Market in Mexico: Forecasted Estimates (Till 2035), Conservative, Base and Optimistic Scenarios (USD Billion)
- Table 22.86 Skincare Market in Europe: Historical Trends (Since 2018) (USD Billion)
- Table 22.87 Skincare Market in Europe: Forecasted Estimates (Till 2035), Conservative, Base and Optimistic Scenarios (USD Billion)
- Table 22.88 Skincare Market in Germany: Historical Trends (Since 2018) (USD Billion)
- Table 22.89 Skincare Market in Germany: Forecasted Estimates (Till 2035), Conservative, Base and Optimistic Scenarios (USD Billion)
- Table 22.90 Skincare Market in France: Historical Trends (Since 2018) (USD Billion)
- Table 22.91 Skincare Market in France: Forecasted Estimates (Till 2035), Conservative, Base and Optimistic Scenarios (USD Billion)
- Table 22.92 Skincare Market in Italy: Historical Trends (Since 2018) (USD Billion)
- Table 22.93 Skincare Market in Italy: Forecasted Estimates (Till 2035), Conservative, Base and Optimistic Scenarios (USD Billion)
- Table 22.94 Skincare Market in the UK: Historical Trends (Since 2018) (USD Billion)
- Table 22.95 Skincare Market in the UK: Forecasted Estimates (Till 2035), Conservative, Base and Optimistic Scenarios (USD Billion)
- Table 22.96 Skincare Market in Spain: Historical Trends (Since 2018) (USD Billion)
- Table 22.97 Skincare Market in Spain: Forecasted Estimates (Till 2035), Conservative, Base and Optimistic Scenarios (USD Billion)
- Table 22.98 Skincare Market in Rest of Europe: Historical Trends (Since 2018) (USD Billion)
- Table 22.99 Skincare Market in Rest of Europe: Forecasted Estimates (Till 2035), Conservative, Base and Optimistic Scenarios (USD Billion)
- Table 22.100 Skincare Market in Asia-Pacific: Historical Trends (Since 2018) (USD Billion)
- Table 22.101 Skincare Market in Asia-Pacific: Forecasted Estimates (Till 2035), Conservative, Base and Optimistic Scenarios (USD Billion)
- Table 22.102 Skincare Market in China: Historical Trends (Since 2018) (USD Billion)
- Table 22.103 Skincare Market in China: Forecasted Estimates (Till 2035), Conservative, Base and Optimistic Scenarios (USD Billion)
- Table 22.104 Skincare Market in Japan: Historical Trends (Since 2018) (USD Billion)
- Table 22.105 Skincare Market in Japan: Forecasted Estimates (Till 2035), Conservative, Base and Optimistic Scenarios (USD Billion)
- Table 22.106 Skincare Market in South Korea: Historical Trends (Since 2018) (USD Billion)
- Table 22.107 Skincare Market in South Korea: Forecasted Estimates (Till 2035), Conservative, Base and Optimistic Scenarios (USD Billion)
- Table 22.108 Skincare Market in India: Historical Trends (Since 2018) (USD Billion)
- Table 22.109 Skincare Market in India: Forecasted Estimates (Till 2035), Conservative, Base and Optimistic Scenarios (USD Billion)
- Table 22.110 Skincare Market in Australia: Historical Trends (Since 2018) (USD Billion)
- Table 22.111 Skincare Market in Australia: Forecasted Estimates (Till 2035), Conservative, Base and Optimistic Scenarios (USD Billion)
- Table 22.112 Skincare Market in Rest of Asia-Pacific: Historical Trends (Since 2018) (USD Billion)
- Table 22.113 Skincare Market in Rest of Asia-Pacific: Forecasted Estimates (Till 2035), Conservative, Base and Optimistic Scenarios (USD Billion)
- Table 22.114 Skincare Market in Latin America: Historical Trends (Since 2018) (USD Billion)
- Table 22.115 Skincare Market in Latin America: Forecasted Estimates (Till 2035), Conservative, Base and Optimistic Scenarios (USD Billion)
- Table 22.116 Skincare Market in Brazil: Historical Trends (Since 2018) (USD Billion)
- Table 22.117 Skincare Market in Brazil: Forecasted Estimates (Till 2035), Conservative, Base and Optimistic Scenarios (USD Billion)
- Table 22.118 Skincare Market in Argentina: Historical Trends (Since 2018) (USD Billion)
- Table 22.119 Skincare Market in Argentina: Forecasted Estimates (Till 2035), Conservative, Base and Optimistic Scenarios (USD Billion)
- Table 22.120 Skincare Market in Rest of Latin America: Historical Trends (Since 2018) (USD Billion)
- Table 22.121 Skincare Market in Rest of Latin America: Forecasted Estimates (Till 2035), Conservative, Base and Optimistic Scenarios (USD Billion)
- Table 22.122 Skincare Market in Middle East and Africa: Historical Trends (Since 2018) (USD Billion)
- Table 22.123 Skincare Market in Middle East and Africa: Forecasted Estimates (Till 2035), Conservative, Base and Optimistic Scenarios (USD Billion)
- Table 22.124 Skincare Market in Africa: Historical Trends (Since 2018) (USD Billion)
- Table 22.125 Skincare Market in Africa: Forecasted Estimates (Till 2035), Conservative, Base and Optimistic Scenarios (USD Billion)
- Table 22.126 Skincare Market in UAE: Historical Trends (Since 2018) (USD Billion)
- Table 22.127 Skincare Market in UAE: Forecasted Estimates (Till 2035), Conservative, Base and Optimistic Scenarios (USD Billion)
- Table 22.128 Skincare Market in Rest of Middle East and Africa: Historical Trends (Since 2018) (USD Billion)
- Table 22.129 Skincare Market in Rest of Middle East and Africa: Forecasted Estimates (Till 2035), Conservative, Base and Optimistic Scenarios (USD Billion)
List of Figures
- Figure 2.1 Research Methodology: Project Methodology
- Figure 2.2 Research Methodology: Forecast Methodology
- Figure 4.1 Executive Summary: Market Landscape of Leading Players
- Figure 4.2 Executive Summary: Market Sizing and Opportunity Analysis
- Figure 5.1 Factors Contributing to Improper Skin Health
- Figure 5.2 Key Principles of Clean Beauty
- Figure 5.3 Challenges Prevailing in the Skincare Industry
- Figure 6.1 Skincare Market: Distribution by Year of Establishment
- Figure 6.2 Skincare Market: Distribution by Company Size
- Figure 6.3 Skincare Market: Distribution by Company Size and Year of Establishment
- Figure 6.4 Skincare Market: Distribution by Location of Headquarters
- Figure 6.5 Skincare Market: Distribution by Company Size and Location of Headquarters
- Figure 6.6 Skincare Market: Distribution by Type of Product
- Figure 6.7 Skincare Market: Distribution by Product Application
- Figure 6.8 Skincare Market: Distribution by Product Formulation
- Figure 6.9 Skincare Market: Distribution by Type of Packaging
- Figure 6.10 Skincare Market: Distribution by Gender
- Figure 7.1 Amorepacific: Annual Revenues, FY 2021- FY 2023 (USD Billion)
- Figure 7.2 Coty: Annual Revenues, FY 2021- FY 2023 (USD Billion)
- Figure 7.3 Estee Lauder: Annual Revenues, FY 2021- FY 2023 (USD Billion)
- Figure 7.4 Galderma: Annual Revenues, FY 2021-FY 2023 (USD Billion)
- Figure 7.5 Kao: Annual Revenues, FY 2018-FY 2023 (JPY Billion)
- Figure 7.6 L'Oreal: Annual Revenues, FY 2021-FY 2023 (EUR Billion)
- Figure 7.7 LVMH: Annual Revenues, FY 2021-FY 2023 (EUR Billion)
- Figure 7.8 Procter & Gamble: Annual Revenues, FY 2021-FY 2023 (USD Billion)
- Figure 7.9 Shiseido: Annual Revenues, FY 2021-FY 2023 (JPY Billion)
- Figure 7.10 Unilever: Annual Revenues, FY 2021-FY 2023 (EUR Billion)
- Figure 8.1 Porter's Five Forces Analysis: Research Methodology
- Figure 8.2 Harvey Ball Analysis
- Figure 8.3 Concluding Remarks
- Figure 9.1 Megatrends in the Skincare Market
- Figure 10.1 Market Drivers
- Figure 10.2 Market Restraints
- Figure 10.3 Market Opportunities
- Figure 10.4 Market Challenges
- Figure 11.1 Global Skincare Market, Historical Trends (Since 2018) and Forecasted Estimates (Till 2035) (USD Billion)
- Figure 11.2 Global Skincare Market, Forecasted Estimates (till 2035): Conservative Scenario
- Figure 11.3 Global Skincare Market, Forecasted Estimates (till 2035): Optimistic Scenario
- Figure 12.1 Skincare Market: Distribution by Type of Product (by Application), Till 2035
- Figure 12.2 Skincare Market for Skin Cleansers: Historical Trends (Since 2018) and Forecasted Estimates (Till 2035) (USD Billion)
- Figure 12.3 Skincare Market for Skin Moisturizers: Historical Trends (Since 2018) and Forecasted Estimates (Till 2035) (USD Billion)
- Figure 12.4 Skincare Market for Anti-aging Products: Historical Trends (Since 2018) and Forecasted Estimates (Till 2035) (USD Billion)
- Figure 12.5 Skincare Market for Sun Protectors and Others: Historical Trends (Since 2018) and Forecasted Estimates (Till 2035) (USD Billion)
- Figure 13.1 Skincare Market: Distribution by Type of Product (by Body Part), Till 2035
- Figure 13.2 Skincare Market for Facial Care Products: Historical Trends (Since 2018) and Forecasted Estimates (Till 2035) (USD Billion)
- Figure 13.3 Skincare Market for Body Care Products: Historical Trends (Since 2018) and Forecasted Estimates (Till 2035) (USD Billion)
- Figure 13.4 Skincare Market for Lip and Eye Care Products: Historical Trends (Since 2018) and Forecasted Estimates (Till 2035) (USD Billion)
- Figure 14.1 Skincare Market: Distribution by Distribution Channel, Till 2035
- Figure 14.2 Skincare Market for Online Distribution Channels: Historical Trends (Since 2018) and Forecasted Estimates (Till 2035) (USD Billion)
- Figure 14.3 Skincare Market for Offline Distribution Channels: Historical Trends (Since 2018) and Forecasted Estimates (Till 2035) (USD Billion)
- Figure 15.1 Skincare Market: Distribution by Type of Offline Distribution Channel, Till 2035
- Figure 15.2 Skincare Market for Convenience Stores: Historical Trends (Since 2018) and Forecasted Estimates (Till 2035) (USD Billion)
- Figure 15.3 Skincare Market for Super Markets: Historical Trends (Since 2018) and Forecasted Estimates (Till 2035) (USD Billion)
- Figure 15.4 Skincare Market for Pharmacies: Historical Trends (Since 2018) and Forecasted Estimates (Till 2035) (USD Billion)
- Figure 16.1 Skincare Market: Distribution by Type of Packaging, Till 2035
- Figure 16.2 Skincare Market for Tubes: Historical Trends (Since 2018) and Forecasted Estimates (Till 2035) (USD Billion)
- Figure 16.3 Skincare Market for Bottles: Historical Trends (Since 2018) and Forecasted Estimates (Till 2035) (USD Billion)
- Figure 16.4 Skincare Market for Jars: Historical Trends (Since 2018) and Forecasted Estimates (Till 2035) (USD Billion)
- Figure 16.5 Skincare Market for Others: Historical Trends (Since 2018) and Forecasted Estimates (Till 2035) (USD Billion)
- Figure 17.1 Skincare Market: Distribution by Product Category, Till 2035
- Figure 17.2 Skincare Market for Luxury Skincare Products: Historical Trends (Since 2018) and Forecasted Estimates (Till 2035) (USD Billion)
- Figure 17.3 Skincare Market for Mass Skincare Products: Historical Trends (Since 2018) and Forecasted Estimates (Till 2035) (USD Billion)
- Figure 18.1 Skincare Market: Distribution by Gender, Till 2035
- Figure 18.2 Skincare Market for Men: Historical Trends (Since 2018) and Forecasted Estimates (Till 2035) (USD Billion)
- Figure 18.3 Skincare Market for Women: Historical Trends (Since 2018) and Forecasted Estimates (Till 2035) (USD Billion)
- Figure 18.4 Skincare Market for Other Genders: Historical Trends (Since 2018) and Forecasted Estimates (Till 2035) (USD Billion)
- Figure 19.1 Skincare Market: Distribution by Type of Ingredient, Till 2035
- Figure 19.2 Skincare Market for Natural Ingredients: Historical Trends (Since 2018) and Forecasted Estimates (Till 2035)
- Figure 19.3 Skincare Market for Chemical Ingredients: Historical Trends (Since 2018) and Forecasted Estimates (Till 2035)
- Figure 20.1 Skincare Market: Distribution by Geography, Till 2035
- Figure 20.2 Skincare Market in North America: Historical Trends (Since 2018) and Forecasted Estimates (Till 2035) (USD Billion)
- Figure 20.3 Skincare Market in the US: Historical Trends (Since 2018) and Forecasted Estimates (Till 2035) (USD Billion)
- Figure 20.4 Skincare Market in Canada: Historical Trends (Since 2018) and Forecasted Estimates (Till 2035) (USD Billion)
- Figure 20.5 Skincare Market in Mexico: Historical Trends (Since 2018) and Forecasted Estimates (Till 2035) (USD Billion)
- Figure 20.6 Skincare Market in Europe: Historical Trends (Since 2018) and Forecasted Estimates (Till 2035) (USD Billion)
- Figure 20.7 Skincare Market in Germany: Historical Trends (Since 2018) and Forecasted Estimates (Till 2035) (USD Billion)
- Figure 20.8 Skincare Market in France: Historical Trends (Since 2018) and Forecasted Estimates (Till 2035) (USD Billion)
- Figure 20.9 Skincare Market in Italy: Historical Trends (Since 2018) and Forecasted Estimates (Till 2035) (USD Billion)
- Figure 20.10 Skincare Market in the UK: Historical Trends (Since 2018) and Forecasted Estimates (Till 2035) (USD Billion)
- Figure 20.11 Skincare Market in Spain: Historical Trends (Since 2018) and Forecasted Estimates (Till 2035) (USD Billion)
- Figure 20.12 Skincare Market in Rest of Europe: Historical Trends (Since 2018) and Forecasted Estimates (Till 2035) (USD Billion)
- Figure 20.13 Skincare Market in Asia-Pacific: Historical Trends (Since 2018) and Forecasted Estimates (Till 2035) (USD Billion)
- Figure 20.14 Skincare Market in China: Historical Trends (Since 2018) and Forecasted Estimates (Till 2035) (USD Billion)
- Figure 20.15 Skincare Market in Japan: Historical Trends (Since 2018) and Forecasted Estimates (Till 2035) (USD Billion)
- Figure 20.16 Skincare Market in South Korea: Historical Trends (Since 2018) and Forecasted Estimates (Till 2035) (USD Billion)
- Figure 20.17 Skincare Market in India: Historical Trends (Since 2018) and Forecasted Estimates (Till 2035) (USD Billion)
- Figure 20.18 Skincare Market in Australia: Historical Trends (Since 2018) and Forecasted Estimates (Till 2035) (USD Billion)
- Figure 20.19 Skincare Market in Rest of Asia-Pacific: Historical Trends (Since 2018) and Forecasted Estimates (Till 2035) (USD Billion)
- Figure 20.20 Skincare Market in Latin America: Historical Trends (Since 2018) and Forecasted Estimates (Till 2035) (USD Billion)
- Figure 20.21 Skincare Market in Brazil: Historical Trends (Since 2018) and Forecasted Estimates (Till 2035) (USD Billion)
- Figure 20.22 Skincare Market in Argentina: Historical Trends (Since 2018) and Forecasted Estimates (Till 2035) (USD Billion)
- Figure 20.23 Skincare Market in Rest of Latin America: Historical Trends (Since 2018) and Forecasted Estimates (Till 2035) (USD Billion)
- Figure 20.24 Skincare Market in Middle East and Africa: Historical Trends (Since 2018) and Forecasted Estimates (Till 2035) (USD Billion)
- Figure 20.25 Skincare Market in Africa: Historical Trends (Since 2018) and Forecasted Estimates (Till 2035) (USD Billion)
- Figure 20.26 Skincare Market in UAE: Historical Trends (Since 2018) and Forecasted Estimates (Till 2035) (USD Billion)
- Figure 20.27 Skincare Market in Rest of Middle East and Africa: Historical Trends (Since 2018) and Forecasted Estimates (Till 2035) (USD Billion)

 皮膚科藥物:利用皮膚健康領域的機會促進CHC發展
 大麻蛋白護膚市場規模、佔有率和成長分析:按產品類型、應用、膚質、分銷管道、最終用戶和地區分類 - 2026-2033 年行業預測
 皮膚健康營養市場預測至2034年—按營養素類型、形態、皮膚問題、原料來源、分銷管道和地區分類的全球分析
 眼霜市場機會、成長要素、產業趨勢分析及2026-2035年預測。
 更年期護膚市場報告:趨勢、預測及競爭分析(至2035年)護膚品市場報告:趨勢、預測及競爭分析(至2035年)
 美國水護膚市場規模、佔有率和成長分析:按產品類型、膚質、分銷管道、最終用戶、應用和地區分類-2026-2033年產業預測
 藻類護膚品市場規模、佔有率及成長分析:按產品類型、藻類成分類型、應用、分銷管道、終端用戶和地區分類-2026-2033年產業預測2034年生物活性護膚成分市場預測-按成分類型、原料、功能、應用、最終用戶和地區分類的全球分析
 護膚品市場洞察、競爭格局及市場預測 - 2034 年