


 |
市場調查報告書
商品編碼
2107338
全球外泌體療法市場:依療法類型、目標適應症、治療領域、給藥途徑及地區分類-趨勢及至2040年的預測Exosome Therapy Market: Distribution by Type of Therapeutic, Target Indication, Therapeutic Area, Route of Administration and Geography - Trends and Global Forecasts, till 2040 |
||||||

外泌體療法市場概覽
全球外泌體療法市場預計將從今年的 3,200 萬美元成長到 2040 年的 14.05 億美元,在整個預測期內實現 41.1% 的複合年成長率。
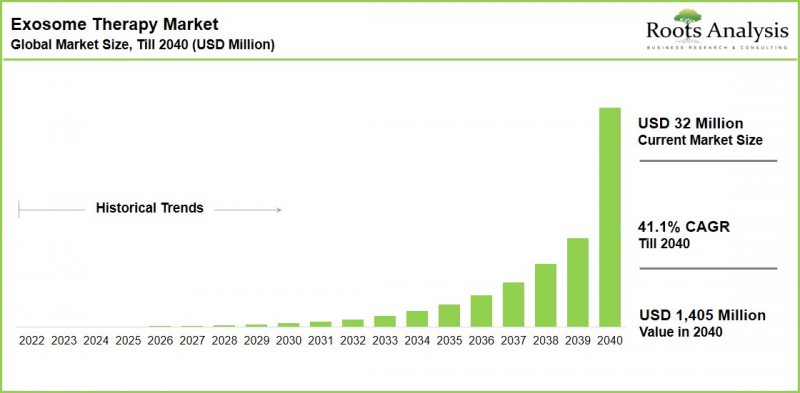
外泌體療法市場:成長與趨勢
利用細胞外囊泡的療法已從學術研究發展成為備受推崇的臨床治療方法。與傳統生物製藥相比,其優勢在於更高的標靶特異性、更強的組織再生能力和更低的全身性發炎反應。這些特性促使企業贊助商和非企業研究團隊積極進行研發專案。一項針對200多項已發表的、評估間質幹細胞來源外泌體臨床前應用的研究綜述顯示,超過70%的病例顯示出可測量的療效,這一數據持續支撐著投資者和授權方對該領域的濃厚興趣。
自新冠疫情爆發以來,臨床實驗藥物申請數量的持續成長進一步推動了市場成長動能。這主要是由於申辦方尋求監管部門批准,以便將外泌體候選藥物推進人體臨床試驗。對於經銷商和通路合作夥伴而言,這代表著一個快速成長(儘管仍處於早期階段)的市場機遇,他們可以藉此在預期中的臨床和商業性開發浪潮到來之前搶佔先機。
成長驅動力:支持市場擴張的因素
眼科、皮膚科、肌肉骨骼科和結直腸科疾病負擔的日益加重是外泌體療法市場成長的主要促進因素。此外,研發活動的增加以及政府對外泌體生產和表徵基礎設施投入的加強也是推動市場成長的因素。鑑於視網膜和眼科適應症方面臨床證據的積累,眼內給藥正逐漸成為一種特別活躍的給藥途徑。製藥業研發投資向新興經濟體的廣泛轉移預計也將進一步推動市場成長,並在預測期內擴大分銷和供應鏈合作夥伴的目標市場。
市場挑戰:阻礙進展的主要障礙
儘管長期成長前景光明,但開發外泌體療法的公司仍面臨技術和商業性的挑戰。治療製劑品質不足、細菌污染風險以及非外泌體成分的存在阻礙了生產的一致性。此外,細胞外囊泡固有的異質性使得跨細胞來源的標準化定量和表徵變得困難。在商業方面,評估該市場的相關人員必須仔細考慮資金籌措風險,已有七個在研產品因受試者招募和資金籌措限制而撤回,這便是明證。
外泌體療法市場:關鍵洞察
本報告對當前外泌體療法市場狀況進行了詳細分析,並指出了分銷合作夥伴、通路仲介業者和服務整合商的潛在成長機會。主要發現包括:
- 目前,外泌體療法研發管線包含近120個候選療法,其中超過40%已進入臨床開發階段。這表明,市場商業性轉折點比表面銷售數據所顯示的來得更快。
- 目前,包括 EXOMSC-COV19(Dermama Biotech Lab)、Dex2(Gustave Roussey Institute)和 SF-MSC-EX(Osmangadzi University)在內的七種基於外泌體的療法正處於後期臨床開發階段,它們構成了一個短期觀察名單,供許可和分銷合作夥伴參考。
- 約 30% 的在研藥物針對乳癌、肺癌、結直腸癌和惡性黑色素瘤等腫瘤領域,外泌體被定位為一種新型靶向藥物遞送載體,用於那些已經建立完善的專業分銷基礎設施的治療領域。
- 超過 60 家製藥公司和學術/研究機構正在積極致力於開發基於外泌體的療法,這反映了一個去中心化、夥伴關係主導的生態系統,非常適合經銷商為監管合規、物流和市場推廣提供支援。
- 策略性授權活動,例如 Coya Therapeutics 於 2022 年與卡內基美隆大學簽署的關於外泌體聚合物混合遞送技術的協議,表明獲得平台技術正在成為開發公司之間的差異化因素,並且是投資者和合作夥伴進行實質審查的重要指標。
- EVerZom 在一輪資金籌措中籌集了 1000 萬歐元,用於推進其針對炎症性疾病的外泌體生物療法,並開始其在研項目的臨床開發。
- 監管機構正在加強對不合規外泌體產品行銷的監管,進一步凸顯了基於 IND(新藥研究)的臨床開發途徑在確保該領域商業性合法性方面的重要性。
外泌體療法的市場區隔
市場規模和機會分析是根據以下參數進行細分的:
治療類型
- 同種
- 本土種植
根據指示
- 退化性半月軟骨
- 大皰性先天性水皰症
- 肛門周圍瘻管
- 色素性視網膜炎
按治療區域
- 皮膚病
- 肌肉骨骼疾病
- 眼科疾病
- 直腸疾病
按劑型
- 液體
- 氣霧劑
透過行政途徑
- 瘻管
- 關節內
- 眼
按地區
- 北美洲
- 歐洲
- 亞太地區
- 其他地區
目錄
第1章:序言
第2章執行摘要
第3章:引言
第4章:外泌體療法:市場現狀
第5章:外泌體療法:公司簡介
- Coya Therapeutics
- Evox Therapeutics
- Curexsys
- EV Therapeutics
- SHIFTBIO
第6章 外泌體療法:藥物概況
第7章:臨床試驗分析
第8章:學術研究津貼分析
第9章:全球事件分析
第10章夥伴關係與合作
第11章:資金籌措與投資分析
第12章:新創公司健康指數
第13章案例研究:外泌體開發與生產公司
第14章:藥物失效分析
第15章:市場規模計算與機會分析
第16章:高階主管洞見
第17章附錄一:表格形式數據
第18章附錄二:公司與組織列表
EXOSOME THERAPY MARKET: OVERVIEW
As per Roots Analysis, the global exosome therapy market is estimated to grow from USD 32 million in the current year to USD 1,405 million by 2040, registering a CAGR of 41.1% across the forecast period.
Exosome Therapy Market: Growth and Trends
Extracellular vesicle-based therapeutics have moved from an academic curiosity to a closely watched clinical modality. Their appeal lies in target specificity, enhanced tissue regeneration and reduced systemic inflammation relative to conventional biologics, characteristics that have drawn both industry sponsors and non-industry research groups into active development programs. A review of over 200 published studies evaluating mesenchymal stem cell derived exosomes for preclinical use reported measurable benefit in more than 70% of cases, a data point that continues to anchor investor and licensing interest in the space.
The market growth momentum has been reinforced by a steady rise in investigational new drug filings since the COVID-19 pandemic, as sponsors seek regulatory clearance to move exosome candidates into human trials. For distributors and channel partners, this represents an early but fast-widening window to establish positioning ahead of the anticipated wave of clinical and commercial launches.
Growth Drivers: Factors Fueling Market Expansion
Growth in the exosome therapy market is being driven by rising disease burden across ophthalmic, dermatological, musculoskeletal, and rectal disorders. Further, expanding research and development activity... and increasing government funding directed at exosome production and characterization infrastructure. Intra-ocular administration is emerging as a particularly active route, supported by a growing body of clinical evidence in retinal and ophthalmic indications. The broader shift of pharmaceutical R&D investment toward emerging economies is expected to add further momentum, widening the addressable base for distribution and supply chain partners over the forecast period.
Market Challenges: Critical Barriers Hindering Progress
Despite favorable long-term growth, exosome therapy developers continue to face technical and commercial challenges. Weak therapy preparations, bacterial contamination risk, and the presence of non-exosomal components complicate manufacturing consistency. Further, the inherent heterogeneity of extracellular vesicles makes standardized quantification and characterization difficult across cell sources. On the commercial side, the withdrawal of seven pipeline candidates due to enrolment and funding constraints, illustrate the financing risk that stakeholders evaluating this market need to underwrite.
Exosome Therapy Market: Key Insights
The report delves into the current state of the Exosome Therapy market and identifies potential growth opportunities for distribution partners, channel intermediaries, and service integrators. Some key findings include:
- The exosome therapeutics pipeline presently features close to 120 therapeutic candidates, with more than 40% already in clinical stage development, indicating that the market's commercial inflection point is approaching faster than headline revenue figures suggest.
- Seven exosome therapies, including EXOMSC-COV19 (Dermama Biotech Lab), Dex2 (Gustave Roussy Institute) and SF-MSC-EX (Osmangazi University), are currently in advanced clinical stages, forming a near-term watchlist for licensing and distribution partners.
- Approximately 30% of pipeline candidates target oncology indications, including breast, lung, colon cancer and melanoma, positioning exosomes as an emerging targeted drug delivery vehicle in a therapeutic area that already commands significant specialty distribution infrastructure.
- More than 60 pharmaceutical companies and academic or research institutes are actively engaged in exosome therapeutic development, reflecting a fragmented, partnership-driven ecosystem well suited to distributors offering regulatory, logistics and go-to-market support.
- Strategic in-licensing activity, such as Coya Therapeutics' 2022 agreement with Carnegie Mellon University for exosome-polymer hybrid delivery technology illustrates how platform technology access is becoming a differentiator among developers, an important due-diligence signal for investors and partners alike.
- EVerZom raised EUR 10 million in a funding round to advance exosome-based biotherapies targeting inflammatory diseases and to initiate clinical development of its pipeline programs.
- Regulatory scrutiny increased around non-compliant exosome product marketing, reinforcing the importance of IND-backed clinical development pathways for commercial legitimacy in this space.
Exosome Therapy Market Segments
The market sizing and opportunity analysis has been segmented across the following parameters:
By Type of Therapeutic
- Allogeneic
- Autologous
By Target Disease Indication
- Degenerative Meniscal Injury
- Dystrophic Epidermolysis Bullosa
- Fistula Perianal
- Retinitis Pigmentosa
By Therapeutic Area
- Dermatological Disorders
- Musculoskeletal Disorders
- Ophthalmic Diseases
- Rectal Disorders
By Type of Formulation
- Liquid
- Aerosol
By Route of Administration
- Fistula Tract
- Intra-articular
- Intra-ocular
By Geographical Regions
- North America
- Europe
- Asia-Pacific
- Rest of the World
Exosome Therapy Market: Key Segments
Ophthalmic Diseases Lead the Market
Based on Roots Analysis market assessment, ophthalmic diseases are expected to account for the largest share of therapeutic area revenues. This highest share is supported by a robust clinical pipeline targeting retinal and ocular surface disorders. In addition, the relatively advanced development of intra-ocular delivery platforms, which enable localized administration, improve therapeutic exposure at the target site, and reduce systemic adverse effects, supporting the highest share. Together, these advantages position ophthalmology as one of the most commercially promising applications for exosome-based therapeutics.
Intra-Ocular Route of Administration Dominates the Market
In terms of route of administration, exosome therapeutics designed for intra-ocular delivery are expected to register higher CAGR throughout the forecast period. This is primarily due to the growing focus on ophthalmic disorders, where localized ocular delivery enables higher therapeutic concentrations at the target site while minimizing systemic exposure, making it a well-suited approach for exosome-based therapies.
Oncology Dominates the Market
Based on the Roots Analysis market report, oncology dominates the market. This can be attributed to the growing focus on oncology, with nearly 30% of exosome therapeutics currently under development targeting cancers such as breast cancer, lung cancer, melanoma, and colorectal cancer. This trend reflects the increasing interest in using exosomes as targeted drug delivery vehicles. Although the segment remains in the early stages of clinical development, its robust pipeline highlights strong long-term commercial and partnership opportunities for stakeholders positioned ahead of market maturation.
Asia-Pacific Dominates the Market and Registers Higher CAGR
Based on the proprietary report, Asia-Pacific holds the highest share and is likely to remain dominant in the future. This growth is being driven by increasing investments in regenerative medicine and advanced biologics, a rapidly expanding pipeline of exosome-based therapeutics, and the growing number of clinical trials across China, Japan, South Korea, and India.
Governments across the region are strengthening support for cell and gene therapy innovation through funding initiatives, translational research programs, and evolving regulatory frameworks. These fundings initiatives will accelerate the progression of exosome candidates toward commercialization.
Moreover, the emergence of regional biomanufacturing capabilities and strategic collaborations to scale exosome production is increasing demand for specialized logistics, GMP-compliant manufacturing support, and temperature-controlled distribution networks, positioning Asia-Pacific as a key future hub for exosome therapy development and commercialization.
Example Players in Exosome Therapy Market
- Cellular Biomedicine Group
- Coya Therapeutics
- Curexsys
- EV Therapeutics
- Evox Therapeutics
- ExoCoBio
- ILIAS Biologics
- Rion
- SHIFTBIO
Expert Interview and Industry Insights
The opinions and insights presented in the full study were shaped by discussions with multiple stakeholders across the exosome therapeutics value chain. The research report features detailed transcripts of interviews held with the following industry participants:
- Chief Business Officer, Small Company, US
- Chief Business Officer, Mid-Sized Company, South Korea
- R&D and Innovation Manager, Very Small Company, Portugal
EXOSOME THERAPY MARKET: RESEARCH COVERAGE
- Market Landscape: A detailed assessment of the current pipeline, segmented by phase of development, technology platform, type of payload, derived source, target disease indication, therapeutic area, route of administration, type of therapy, dosing frequency and line of treatment, along with a profile of developer companies by year of establishment, size and headquarters location.
- Company Profiles: In-depth profiles of key exosome therapeutics developers, including company overview, product portfolio and recent developments and future outlook.
- Drug Profiles: Elaborate profiles of the leading exosome therapy candidates in the highest phase of development, including product portfolio and detailed clinical trial information.
- Clinical Trial Analysis: A detailed analysis of completed and ongoing clinical trials by trial status, registration year, sponsor type, study design, patient enrolment, age category, trial location, and geography.
- Academic Grant Analysis: An in-depth analysis of academic grants awarded for exosome therapeutics research since 2017, covering funding institute, support period, purpose of grant, recipient organization, and grant activity code.
- Global Event Analysis: An assessment of global industry events related to exosome therapeutics, by year, platform, region, active organizers, speakers, and participant profile.
- Partnerships and Collaborations: An analysis of research, licensing, manufacturing, product development, and M&A partnerships inked in this space since 2017, by partnership type, technology platform, target indication and geography.
- Funding and Investment Analysis: A detailed analysis of grant, seed, venture capital, IPO, secondary offering, and debt financing instances since 2017, by amount invested, purpose, target indication, therapeutic area, and geography.
- Start-Up Health Indexing: A proprietary Roots Analysis framework assessing start-ups by pipeline strength, pipeline maturity, indication diversity, partnership activity, and financial support.
- Case Study (Exosome Development and Manufacturing Companies): A focused assessment of service providers offering isolation, characterization, purification, engineering, and targeted delivery capabilities, segmented by scale of operation and scalability.
- Drug Failure Analysis: An analysis of exosome therapeutics that were discontinued during clinical development, by target indication, route of administration, sponsor type, and reason for failure.
- Market Sizing and Opportunity Analysis: Year-wise global and regional (North America, Europe, Asia-Pacific, Rest of the World) market projections (2029-2040) segmented by type of therapeutic, target disease indication, therapeutic area, route of administration and leading drug candidates, presented under conservative, base, and optimistic forecast scenarios.
Key Questions Answered in this Report
- What is exosome therapy and how does it compare with conventional biologic modalities?
- What is the current and future size of the exosome therapy market?
- What is the CAGR of the exosome therapy market through 2040?
- Which companies and academic institutes are leading exosome therapeutics development?
- Which target indications and therapeutic areas are expected to generate the most revenue?
- Which route of administration is likely to dominate the market, and why?
- Which region is expected to register the fastest growth, and what is driving it?
- What are the primary technical and financing risks facing exosome therapy developers?
- What opportunities exist for distributors, logistics partners and investors entering this space?
Reasons to Buy this Report
This report is designed to give distributors, channel partners, and investors a decisive analytical edge in a fast-consolidating market. Its core differentiators include:
- Top-Down and Bottom-Up Triangulated Forecasting: Market estimates for Till 2040 are built using a hybrid methodology that cross-validates top-down macro assessments of disease burden and pipeline maturity against bottom-up, candidate-level clinical and commercial data, minimizing forecast bias.
- Comprehensive Database Cover Across 27 Chapters: Comprehensive coverage spanning market sizing, competitive landscape, clinical trial activity, academic grant funding, global events, partnerships, financing, and drug failure analysis, with dedicated regional chapters for North America, Europe, Asia-Pacific, and Rest of the World.
- Primary Research-Backed Insights: Findings are validated through direct interviews with Chief Business Officers and R&D leaders across small and mid-sized exosome developers, ensuring conclusions reflect real operating conditions rather than desk research alone.
- Six-Parameter Actionable Segmentation: Type of therapeutic, target disease indication, therapeutic area, type of formulation, route of administration and geography enable precise opportunity sizing for any go-to-market, licensing, or investment thesis.
- Three-Scenario Forecast Modeling: Conservative, base and optimistic projections account for the funding and clinical-execution risk that has historically affected early-stage exosome developers, supporting more robust investment and partnership decisions.
- Searchable Company and Grant Database: An easily searchable Excel database of all companies, academic institutes, and grant recipients active in exosome therapeutics development, purpose-built for business development and targeted outreach.
Additional Benefits
- Complementary PPT Insights Pack
- Complementary Excel Data Packs for all Analytical Modules in the Report
- 15% Free Content Customization
- Detailed Report Walkthrough Session with Research Team
- Free Updated report if the report is 6-12 months old or older
TABLE OF CONTENTS
1. PREFACE
- 1.1. Scope of the Report
- 1.2 Market Segmentation
- 1.3. Research Methodology
- 1.4. Key Questions Answered
- 1.5. Chapter Outlines
2. EXECUTIVE SUMMARY
3. INTRODUCTION
- 3.1. Overview of Exosomes
- 3.1.1. Types of Extracellular Vesicles
- 3.1.1. Potential Sources of Exosomes
- 3.2. Exosome Biogenesis
- 3.2.1. Exosome Formation and Development Process
- 3.2.2. Secretion of Exosomes
- 3.3. Applications of Exosomes
- 3.4. Mechanism of Exosome Therapy
- 3.4.1. Exosome Drug Therapy
- 3.4.2. Exosome RNAi Therapy
- 3.4.3. Exosome Immunotherapy
- 3.5. Advantages of Exosome Therapy
- 3.6. Risks and Future Perspectives Associated with Exosome Therapeutics
4. EXOSOME THERAPEUTICS: MARKET LANDSCAPE
- 4.1. Analysis Methodology and Key Parameters
- 4.2. Exosome Therapeutics Market Landscape
- 4.2.1. Analysis by Phase of Development
- 4.2.2. Analysis by Technology Platform
- 4.2.3. Analysis by Type of Payload
- 4.2.4. Analysis by Derived Source
- 4.2.5. Analysis by Target Disease Indication(s)
- 4.2.6. Analysis by Therapeutic Area
- 4.2.7. Analysis by Phase of Development and Therapeutic Area
- 4.2.8. Analysis by Therapeutic Area and Route of Administration
- 4.2.9. Analysis by Route of Administration
- 4.2.10 Analysis by Area of Application
- 4.2.11. Analysis by Type of Therapy
- 4.2.12. Analysis by Dosing Frequency
- 4.2.13. Analysis by Type of Therapy (By Method of Composition)
- 4.2.14. Analysis by Line of Treatment
- 4.3. Exosome Therapy Developers
- 4.3.1. Analysis by Year of Establishment
- 4.3.2. Analysis by Company Size
- 4.3.3. Analysis by Location of Headquarters
- 4.3.4. Most Active Players: Analysis by Number of Therapeutics
5. EXOSOME THERAPY: COMPANY PROFILES
- 5.1. Coya Therapeutics
- 5.1.1. Company Overview
- 5.1.2. Product Portfolio
- 5.1.3. Recent Developments and Future Outlook
- 5.2. Evox Therapeutics
- 5.2.1. Company Overview
- 5.2.2. Product Portfolio
- 5.2.3. Recent Developments and Future Outlook
- 5.3. Curexsys
- 5.3.1. Company Overview
- 5.3.2. Product Portfolio
- 5.3.3. Recent Developments and Future Outlook
- 5.4. EV Therapeutics
- 5.4.1. Company Overview
- 5.4.2. Product Portfolio
- 5.4.3. Recent Developments and Future Outlook
- 5.5. SHIFTBIO
- 5.5.1. Company Overview
- 5.5.2. Product Portfolio
- 5.5.3. Recent Developments and Future Outlook
6. EXOSOME THERAPY: DRUG PROFILES
- 6.1. AEGLE Therapeutics
- 6.1.1. Company Overview
- 6.1.2. AGLE-102: Product Portfolio
- 6.1.2.1. AGLE-102: Clinical Trial Information
- 6.1.3. Recent Developments and Future Outlook
- 6.2. AVEM Healthcare
- 6.2.1. Company Overview
- 6.2.2. Ardoxso: Product Portfolio
- 6.2.2.1. Ardoxso: Clinical Trial Information
- 6.2.3. Recent Developments and Future Outlook
- 6.3. Cellular Biomedicine Group
- 6.3.1. Company Overview
- 6.3.2. Financial Information
- 6.3.3. haMPC-Exos: Product Portfolio
- 6.3.3.1. haMPC-Exos: Clinical Trial Information
- 6.3.4. hMSC-Exos: Product Portfolio
- 6.3.4.1. hMSC-Exos: Clinical Trial Information
- 6.3.5. Undisclosed Drug 1: Product Portfolio
- 6.3.5.1. Undisclosed Drug 1: Clinical Trial Information
- 6.3.6. Recent Developments and Future Outlook
- 6.4. OBCTCD24
- 6.4.1. Company Overview
- 6.4.2. CovenD24: Product Portfolio
- 6.4.2.1. CovenD24: Clinical Trial Information
- 6.4.3. Recent Developments and Future Outlook
- 6.5. ReNeuron
- 6.5.1. Company Overview
- 6.5.2. Financial Information
- 6.5.3. Undisclosed Drug 1: Product Portfolio
- 6.5.3.1. Undisclosed Drug 1: Clinical Trial Information
- 6.5.4. Recent Developments and Future Outlook
- 6.6. Stem Cell Medicine
- 6.6.1. Company Overview
- 6.6.2. Undisclosed Drug 1: Product Portfolio
- 6.6.3. Recent Developments and Future Outlook
7. CLINICAL TRIAL ANALYSIS
- 7.1. Analysis Methodology and Key Parameters
- 7.2. Exosome Therapeutics: List of Clinical Trials
- 7.2.1. Analysis by Trial Status
- 7.2.2. Analysis by Trial Registration Year
- 7.2.3. Analysis by Sponsor / Collaborator
- 7.2.4. Analysis by Trial Registration Year and Type of Study
- 7.2.5. Analysis by Trial Registration Year and Trial Status
- 7.2.6. Analysis by Annual Number of Patients Enrolled
- 7.2.7. Analysis by Study Design
- 7.2.8. Analysis by Age Category
- 7.2.9. Analysis by Phase of Development and Trial Status
- 7.2.10. Analysis by Phase of Development and Patients Enrolled
- 7.2.11. Most Active Industry Players: Analysis by Number of Registered Trials
- 7.2.12. Most Active Non-Industry Players: Analysis by Number of Registered Trials
- 7.2.13. Analysis by Trial Location
- 7.2.14. Analysis by Trial Status and Geography
- 7.2.15. Analysis by Trial Status, Patients Enrolled and Geography
8. ACADEMIC GRANT ANALYSIS
- 8.1. Analysis Methodology and Key Parameters
- 8.2. Exosome Therapeutics: List of Academic Grants
- 8.3. Analysis by Year of Grants Awarded
- 8.4. Analysis by Amount Awarded per Year
- 8.5. Analysis by Type of Funding Institute Center
- 8.6. Analysis by Support Period
- 8.7. Analysis by Purpose of Grant
- 8.8. Word Cloud Analysis: Emerging Focus Area
- 8.9. Analysis by Grant Activity Code
- 8.10. Analysis by Location of Recipient Organizations
- 8.11. Popular Recipient Organizations: Analysis by Number of Grants
- 8.12. Popular Recipient Organizations: Analysis by Amount Awarded
- 8.13. Analysis by Type of Recipient Organization
- 8.14. Analysis by Study Section
- 8.15. Analysis by Type of Grant Application
- 8.16. Analysis by Funding Institute Center and Support Year
9. GLOBAL EVENT ANALYSIS
- 9.1. Chapter Overview
- 9.2. Scope and Methodology
- 9.3. List of Global Events Related to Exosomes
- 9.3.1. Analysis by Year of Event
- 9.3.2. Analysis by Event Platform
- 9.3.3. Analysis by Type of Event
- 9.3.4. Analysis by Region
- 9.3.5. Most Active Organizers: Analysis by Number of Events
- 9.3.6. Most Active Speakers: Analysis by Number of Events
- 9.3.7. Most Active Industry Participants: Analysis by Number of Events
- 9.3.8. Most Active Non-Industry Participants: Analysis by Number of Events
- 9.3.9. Analysis by Designation of Participant
- 9.3.10. Analysis by Affiliated Department of Participant
- 9.3.11. Word Cloud Analysis: Evolutionary Trends in Event Agenda / Key Focus Area
10. PARTNERSHIPS AND COLLABORATIONS
- 10.1. Chapter Overview
- 10.2. Partnership Models
- 10.3. Exosome Therapeutics: List of Partnerships and Collaborations
- 10.3.1. Analysis by Year of Partnership
- 10.3.2. Analysis by Type of Partnership
- 10.3.3. Analysis by Year and Type of Partnership
- 10.3.4. Analysis by Company and Type of Partnership
- 10.3.5. Analysis by Type of Technology Platform
- 10.3.6. Analysis by Type of Partner
- 10.3.7. Most Active Players: Analysis by Number of Partnerships
- 10.3.8. Word Cloud Analysis: Emerging Focus Areas
- 10.3.9. Analysis by Target Disease Indication(s)
- 10.3.10. Analysis by Therapeutic Area
- 10.3.11. Analysis by Therapeutic Area and Type of Partnership
- 10.3.12. Regional Distribution of Partnerships
- 10.3.13. Distribution by Geography
11. FUNDING AND INVESTMENT ANALYSIS
- 11.1. Analysis Methodology and Key Parameters
- 11.2. Type of Funding
- 11.3. Exosome Therapeutics: List of Funding Instances
- 11.4. Analysis by Year of Funding
- 11.5. Analysis by Amount Invested
- 11.6. Analysis by Type of Funding
- 11.7. Analysis by Type of Funding and Amount Invested
- 11.8. Analysis by Purpose of Funding
- 11.9. Analysis by Target Disease Indication(s)
- 11.10. Analysis by Therapeutic Area
- 11.11. Most Active Players: Analysis by Number of Funding Instances
- 11.12. Most Active Players: Analysis by Amount Raised
- 11.13. Active Investors: Analysis by Number of Funding Instances
- 11.14. Distribution by Geography
- 11.15. Summary of Funding Activity
12. START-UP HEALTH INDEXING
- 12.1. Analysis Methodology and Key Parameters
- 12.2. Analysis by Pipeline Strength
- 12.3. Analysis by Pipeline Maturity
- 12.4. Analysis by Indication Diversity
- 12.5. Analysis by Number of Partnerships
- 12.6. Analysis by Financial Support
- 12.7. Start-up Health Indexing: Roots Analysis Perspective
- 12.8. Most Active Start-ups
13. CASE STUDY: EXOSOME DEVELOPMENT AND MANUFACTURING COMPANIES
- 13.1. Chapter Overview
- 13.2. Exosome Development and Manufacturing Companies Landscape
- 13.2.1. Analysis by Year of Establishment
- 13.2.2. Analysis by Company Size
- 13.2.3. Analysis by Location of Headquarters
- 13.2.4. Analysis by Location of Headquarters and Company Size
- 13.3. Analysis by Type of Service(s) Offered
- 13.3.1. Analysis by Method of Isolation
- 13.3.2. Analysis by Method of Purification
- 13.3.3. Analysis by Method of Characterization
- 13.3.4. Analysis by Method of Exosome Manufacturing
- 13.3.5. Analysis by Scale of Operation
- 13.3.6. Analysis by Scalability
14. DRUG FAILURE ANALYSIS
- 14.1. Methodology and Key Parameters
- 14.2. Exosome Therapeutics: List of Failed Drug Candidates
- 14.2.1. Analysis by Trial Start and Discontinuation Year
- 14.2.2. Analysis by Trial Status of Discontinuation
- 14.2.3. Analysis by Target Disease Indication(s)
- 14.2.4. Analysis by Route of Administration
- 14.2.5. Analysis by Type of Sponsor
- 14.2.6. Analysis by Reasons for Drug Failure
- 14.2.7. Word Cloud Analysis: Emerging Focus Area
15. MARKET SIZING AND OPPORTUNITY ANALYSIS
- 15.1. Forecast Methodology and Key Assumptions
- 15.2. Global Exosome Therapy Market, Till 2040
- 15.2.1. Exosome Therapy Market for Allogeneic Therapy, Till 2040 (USD Million)
- 15.2.2. Exosome Therapy Market for Autologous Therapy, Till 2040 (USD Million)
- 15.2.3. Exosome Therapy Market for Degenerative Meniscal Injury, 2031-2040 (USD Million)
- 15.2.4. Exosome Therapy Market for Dystrophic Epidermolysis Bullosa, 2030-2040 (USD Million)
- 15.2.5. Exosome Therapy Market for Fistula Perianal, Till 2040 (USD Million)
- 15.2.6. Exosome Therapy Market for Retinitis Pigmentosa, Till 2040 (USD Million)
- 15.2.7. Exosome Therapy Market for Dermatological Disorders, 2030-2040 (USD Million)
- 15.2.8. Exosome Therapy Market for Muscoskeletal Disorders, 2031-2040 (USD Million)
- 15.2.9. Exosome Therapy Market for Ophthalmic Disorders, Till 2040 (USD Million)
- 15.2.10. Exosome Therapy Market for Rectal Disorders, Till 2040 (USD Million)
- 15.2.11. Fistula Tract Exosome Therapy Market, Till 2040 (USD Million)
- 15.2.12. Intra-articular Exosome Therapy Market, 2031-2040 (USD Million)
- 15.2.13. Intra-ocular Exosome Therapy Market, Till 2040 (USD Million)
- 15.2.14. Exosome Therapy Market Geographical Distribution, Till 2040 (USD Million)
- 15.2.15. Erciyes University's Drug: Sales Forecast, Till 2040 (USD Million)
- 15.2.16. Synovial Fluid-Derived Mesenchymal Stem Cells: Sales Forecast, 2031-2040 (USD Million)
- 15.2.17. AGLE-102: Sales Forecast, 2030-2040 (USD Million)
- 15.2.18. Trehan University of Medical Sciences' Drug: Sales Forecast, Till 2040 (USD Million)
- 15.2.19. ReNeuron' Drug: Sales Forecast, Till 2040 (USD Million)
16. EXECUTIVE INSIGHTS
- 16.1. Capricor Therapeutics
- 16.1.1. Company Snapshot
- 16.1.2. Interview Transcript: Chief Business Officer
- 16.2. Exogenus Therapeutics
- 16.2.1. Company Snapshot
- 16.2.2. Interview Transcript: R&D and Innovation Manager
- 16.3. ILIAS Biologics
- 16.3.1. Company Snapshot
- 16.3.2. Interview Transcript: Chief Business Officer
17. APPENDIX 1: TABULATED DATA
18. APPENDIX 2: LIST OF COMPANIES AND ORGANIZATIONS
List of Tables
- Table 4.1 Exosome Therapeutics: Development Pipeline
- Table 4.2 Exosome Therapeutics: List of Developers
- Table 5.1 Codiak BioSciences: Product Portfolio
- Table 5.2 Codiak BioSciences: Clinical Trial Information
- Table 5.3 Recent Developments and Future Outlook
- Table 5.4 Coya Therapeutics: Product Portfolio
- Table 5.5 Recent Developments and Future Outlook
- Table 5.6 Curexsys: Product Portfolio
- Table 5.7 Recent Developments and Future Outlook
- Table 5.8 EV Therapeutics: Product Portfolio
- Table 5.9 Recent Developments and Future Outlook
- Table 5.10 Evox Therapeutics: Product Portfolio
- Table 5.11 Recent Developments and Future Outlook
- Table 5.12 SHIFTBIO: Product Portfolio
- Table 5.13 Recent Developments and Future Outlook
- Table 6.1 AGLE-102: Product Portfolio
- Table 6.2 AGLE-102: Clinical Trial Information
- Table 6.1 Ardoxso: Product Portfolio
- Table 6.2 Ardoxso: Clinical Trial Information
- Table 6.3 Recent Developments and Future Outlook
- Table 6.1 haMPC-Exos: Product Portfolio
- Table 6.2 haMPC-Exos: Clinical Trial Information
- Table 6.3 hMSC-Exos: Product Portfolio
- Table 6.4 hMSC-Exos: Clinical Trial Information
- Table 6.5 Undisclosed Drug 1: Product Portfolio
- Table 6.6 Undisclosed Drug 1: Clinical Trial Information
- Table 6.7 Recent Developments and Future Outlook
- Table 6.1 CovenD24: Product Portfolio
- Table 6.2 CovenD24: Clinical Trial Information
- Table 6.1 Undisclosed Drug 1: Product Portfolio
- Table 6.2 Undisclosed Drug 1: Clinical Trial Information
- Table 6.1 Recent Developments and Future Outlook
- Table 6.2 Undisclosed Drug 1: Product Portfolio
- Table 7.1 Exosome Therapeutics: List of Clinical Trials, 2017-2022
- Table 8.1 Exosome Therapeutics: List of Grants Awarded, Pre-2015-2022
- Table 9.1 Exosome Therapeutics: List of Global Events, 2017-2022
- Table 10.1 Exosome Therapeutics: List of Partnerships and Collaborations, 2017-2022
- Table 11.1 Exosome Therapeutics: List of Funding and Investment, 2017-2022
- Table 12.1 Exosome Therapeutics: List of Start-Ups, 2017-2022
- Table 13.1 Case Study: List of Exosome Service Providers
- Table 17.1 Exosome Therapy Market: Distribution by Phase of Development
- Table 17.2 Exosome Therapy Market: Distribution by Technology Platform
- Table 17.3 Exosome Therapy Market: Distribution by Derived Source
- Table 17.4 Exosome Therapy Market: Distribution by Target Disease Indication(s)
- Table 17.5 Exosome Therapy Market: Distribution by Therapeutic Area
- Table 17.6 Exosome Therapy Market: Distribution by Route of Administration
- Table 17.7 Exosome Therapy Market: Area of Application
- Table 17.8 Exosome Therapy Market: Distribution by Type of Therapy
- Table 17.9 Exosome Therapy Market: Distribution by Dosing Frequency
- Table 17.10 Exosome Therapy Market: Distribution by Type of Therapy (By method of composition)
- Table 17.11 Exosome Therapy Market: Distribution by Line of Treatment
- Table 17.12 Exosome Therapeutics Developers: Distribution by Year of Establishment
- Table 17.13 Exosome Therapeutics Developers: Distribution by Company Size
- Table 17.14 Exosome Therapeutics Developers: Distribution by Location of Headquarters
- Table 17.15 Exosome Therapeutics Developers: Most Active Players: Distribution by Number of Therapeutic Programs
- Table 17.16 Cellular Biomedicine Group: Financial Information, FY 2015- FY 2019 (USD Million)
- Table 17.17 ReNeuron: Financial Information, FY 2018- FY 2022 (USD Million)
- Table 17.18 Clinical Trials Analysis: Distribution by Trial Status
- Table 17.19 Clinical Trials Analysis: Year-wise Distribution by Trial Registration Year, Pre- 2015- 2022
- Table 17.20 Clinical Trials Analysis: Distribution by Sponsor / Collaborator
- Table 17.21 Clinical Trials Analysis: Year-wise Distribution by Registration Year and Type of Study, Pre-2015-2022
- Table 17.22 Clinical Trials Analysis: Year-wise Distribution by Registration Year and Status of Trial, Pre-2015-2022
- Table 17.23 Clinical Trials Analysis: Distribution by Annual Number of Patients Enrolled
- Table 17.24 Clinical Trials Analysis: Distribution by Study Design
- Table 17.25 Clinical Trials Analysis: Distribution by Age Group
- Table 17.26 Clinical Trials Analysis: Distribution by Phase of Development and Trial Status
- Table 17.27 Clinical Trials Analysis: Distribution by Phase of Development and Patient Enrollment
- Table 17.28 Most Active Industry Players: Distribution by Number of Registered Trials
- Table 17.29 Most Active Non-Industry Players: Distribution by Number of Registered Trials
- Table 17.30 Clinical Trials Analysis: Distribution by Trial Location
- Table 17.31 Clinical Trials Analysis: Distribution by Trial Status and Geography
- Table 17.32 Clinical Trials Analysis: Distribution by Trial Status, Patients Enrolled and Geography
- Table 17.33 Academic Grant Analysis: Year-wise Distribution of Number of Grants, Pre-2019-2022
- Table 17.34 Academic Grant Analysis: Year-wise Distribution by Amount of Grant Awarded, Pre-2019-2022 (USD Million)
- Table 17.35 Academic Grant Analysis: Popular NIH Departments: Analysis by Number of Grants
- Table 17.36 Academic Grant Analysis: Analysis by Type of Funding Institute Center
- Table 17.37 Academic Grant Analysis: Distribution by Support Period
- Table 17.38 Academic Grant Analysis: Distribution by Purpose of Grants
- Table 17.39 Academic Grant Analysis: Distribution by Grant Activity Code
- Table 17.40 Academic Grant Analysis: Distribution by Location of Recipients Organizations
- Table 17.41 Academic Grant Analysis: Popular Recipient Organizations: Analysis by Number
- Table 17.42 Academic Grant Analysis: Popular Recipient Organizations: Analysis by Amount
- Table 17.43 Academic Grant Analysis: Distribution by Type of Recipient Organization
- Table 17.44 Academic Grant Analysis: Distribution by Study Section
- Table 17.45 Academic Grant Analysis: Distribution by Type of Grant Application
- Table 17.46 Academic Grant Analysis: Analysis by Funding Institute Center and Support
- Table 17.47 Global Events: Cumulative Half Yearly Trend, 2019-2022
- Table 17.48 Global Events: Distribution by Event Platform
- Table 17.49 Global Events: Distribution by Type of Event
- Table 17.50 Global Events: Distribution by Region
- Table 17.51 Most Active Organizers: Distribution by Number of Events
- Table 17.52 Most Active Speakers: Distribution by Number of Events
- Table 17.53 Most Active Industry Participants: Distribution by Number of Events
- Table 17.54 Most Active Non-Industry Participants: Distribution by Number of Events
- Table 17.55 Global Events: Distribution by Designation of Participant
- Table 17.56 Global Events: Distribution by Affiliated Department of Participant
- Table 17.57 Partnerships and Collaborations: Cumulative Year-wise Trend, 2017-2022
- Table 17.58 Partnerships and Collaborations: Distribution by Type of Partnership
- Table 17.59 Partnerships and Collaborations: Year-wise Distribution by Year and Type of Partnership, 2017- 2022
- Table 17.60 Partnerships and Collaborations: Year-wise Distribution by Company and Type of Partnership, 2017- 2022
- Table 17.61 Partnerships and Collaborations: Distribution by Type of Technology Platform
- Table 17.62 Partnerships and Collaborations: Distribution by Type of Partner
- Table 17.63 Partnerships and Collaborations: Distribution by Target Disease Indication(s)
- Table 17.64 Partnerships and Collaborations: Distribution by Therapeutic Area
- Table 17.65 Partnerships and Collaborations: Distribution by Therapeutic Area and Type of Partnership
- Table 17.66 Partnerships and Collaborations: Regional Distribution of Partnerships
- Table 17.67 Partnerships and Collaborations: Distribution by Geography
- Table 17.68 Funding and Investments: Year-wise Distribution by Year of Funding, 2017-2022 (USD Million)
- Table 17.69 Funding and Investments: Year-wise Distribution by Amount Invested, 2017- 2022
- Table 17.70 Funding and Investments: Distribution by Type of Funding
- Table 17.71 Funding and Investments: Year-wise Distribution by Type of Funding and Amount Invested, 2017- 2022
- Table 17.72 Funding and Investments: Distribution by Purpose of Funding
- Table 17.73 Funding and Investments: Distribution by Target Disease Indication(s)
- Table 17.74 Funding and Investments: Distribution by Therapeutic Area
- Table 17.75 Most Active Players: Distribution by Number of Funding Instances
- Table 17.76 Most Active Players: Distribution by Amount Invested (USD Million)
- Table 17.77 Key Investors: Distribution by Number of Funding Instances
- Table 17.78 Funding and Investments: Distribution by Geography
- Table 17.79 Start-up Health Indexing: Distribution by Pipeline Strength
- Table 17.80 Start-up Health Indexing: Distribution by Pipeline Maturity
- Table 17.81 Start-up Health Indexing: Distribution by Indication Diversity
- Table 17.82 Start-up Health Indexing: Distribution by Number of Partnerships
- Table 17.83 Start-up Health Indexing: Distribution by Financial Support
- Table 17.84 Start-up Health Indexing: Roots Analysis Perspective
- Table 17.85 Most Active Start-ups
- Table 17.86 Case Study: Distribution of Exosome Development and Manufacturing Companies by Year of Establishment
- Table 17.87 Case Study: Distribution of Exosome Development and Manufacturing Companies by Company Size
- Table 17.88 Case Study: Distribution of Exosome Development and Manufacturing Companies by Location of Headquarters
- Table 17.89 Case Study: Distribution of Exosome Development and Manufacturing Companies by Location of Headquarters and Company Size
- Table 17.90 Case Study: Distribution of Exosome Development and Manufacturing Companies by Type of Service(s) Offered
- Table 17.91 Case Study: Distribution of Exosome Development and Manufacturing Companies by Method(s) of Isolation
- Table 17.92 Case Study: Distribution of Exosome Development and Manufacturing Companies by Method(s) of Purification
- Table 17.93 Case Study: Distribution of Exosome Development and Manufacturing Companies by Method(s) of Characterization
- Table 17.94 Case Study: Distribution of Exosome Development and Manufacturing Companies by Method(s) of Manufacturing
- Table 17.95 Case Study: Distribution of Exosome Development and Manufacturing Companies by Scale of Operation
- Table 17.96 Case Study: Distribution of Exosome Development and Manufacturing Companies by Scalability
- Table 17.97 Drug Failure Analysis: Distribution by Trial Start and Discontinuation Year
- Table 17.98 Drug Failure Analysis: Distribution by Trial Status of Discontinuation
- Table 17.99 Drug Failure Analysis: Distribution by Target Disease Indication(s)
- Table 17.100 Drug Failure Analysis: Distribution by Route of Administration
- Table 17.101 Drug Failure Analysis: Distribution by Type of Sponsor
- Table 17.102 Drug Failure Analysis: Distribution by Reasons for Drug Failure
- Table 17.103 Global Exosome Therapy Market, Conservative, Base and Optimistic Scenarios, Till 2040 (USD Million)
- Table 17.104 Exosome Therapy Market for Autologous Therapy, Conservative, Base and Optimistic Scenarios, Till 2040 (USD Million)
- Table 17.105 Exosome Therapy Market for Allogeneic Therapy, Conservative, Base and Optimistic Scenarios, Till 2040 (USD Million)
- Table 17.106 Exosome Therapy Market for Degenerative Meniscal Injury, Conservative, Base and Optimistic Scenarios, 2031-2040 (USD Million)
- Table 17.107 Exosome Therapy Market for Dystrophic Epidermolysis Bullosa, Conservative, Base and Optimistic Scenarios, 2030-2040 (USD Million)
- Table 17.108 Exosome Therapy Market for Fistula Perianal, Conservative, Base and Optimistic Scenarios, Till 2040 (USD Million)
- Table 17.109 Exosome Therapy Market for Retinitis Pigmentosa, Conservative, Base and Optimistic Scenarios, Till 2040 (USD Million)
- Table 17.110 Exosome Therapy Market for Dermatological Disorders, Conservative, Base and Optimistic Scenarios, 2030-2040 (USD Million)
- Table 17.111 Exosome Therapy Market for Muscoskeletal Disorders, Conservative, Base and Optimistic Scenarios, 2031-2040 (USD Million)
- Table 17.112 Exosome Therapy Market for Ophthalmic Disorders, Conservative, Base and Optimistic Scenarios, Till 2040 (USD Million)
- Table 17.113 Exosome Therapy Market for Rectal Disorders, Conservative, Base and Optimistic Scenarios, Till 2040 (USD Million)
- Table 17.114 Fistula Tract Exosome Therapy Market, Conservative, Base and Optimistic Scenarios, Till 2040 (USD Million)
- Table 17.115 Intra-articular Exosome Therapy Market, Conservative, Base and Optimistic Scenarios, 2031-2040 (USD Million)
- Table 17.116 Intra-ocular Exosome Therapy Market, Conservative, Base and Optimistic Scenarios, Till 2040 (USD Million)
- Table 17.117 Exosome Therapy Market Geographical Distribution, Conservative, Base and Optimistic Scenarios, 2031-2040 (USD Million)
- Table 17.118 Erciyes University's Drug: Sales Forecast, Conservative, Base and Optimistic Scenarios, Till 2040 (USD Million)
- Table 17.119 Synovial Fluid-Derived Mesenchymal Stem Cells: Sales Forecast, Conservative, Base and Optimistic Scenarios, 2031-2040 (USD Million)
- Table 17.120 AGLE-102: Sales Forecast, Conservative, Base and Optimistic Scenarios, 2030-2040 (USD Million)
- Table 17.121 Trehan University of Medical Sciences' Drug: Sales Forecast, Conservative, Base and Optimistic Scenarios, Till 2040 (USD Million)
- Table 17.122 ReNeuron' Drug: Sales Forecast, Conservative, Base and Optimistic Scenarios, Till 2040 (USD Million)
List of Figures
- Figure 3.1 Types of Extracellular Vesicles
- Figure 3.1 Potential Sources of Exosomes
- Figure 3.2 Secretion of Exosomes
- Figure 3.3 Mechanism of Exosome Therapy
- Figure 4.1 Exosome Therapeutics: Distribution by Phase of Development
- Figure 4.2 Exosome Therapeutics: Distribution by Technology Platform
- Figure 4.3 Exosome Therapeutics: Distribution by Type of Payload
- Figure 4.4 Exosome Therapeutics: Distribution by Derived Source
- Figure 4.5 Exosome Therapeutics: Distribution by Target Disease Indication(s)
- Figure 4.6 Exosome Therapeutics: Distribution by Therapeutic Area
- Figure 4.7 Exosome Therapeutics: Distribution by Phase of Development and Therapeutic Area
- Figure 4.8 Exosome Therapeutics: Distribution by Therapeutic Area and Route of Administration
- Figure 4.9 Exosome Therapeutics: Distribution by Route of Administration
- Figure 4.10 Exosome Therapeutics: Area of Application
- Figure 4.11 Exosome Therapeutics: Distribution by Type of Therapy
- Figure 4.12 Exosome Therapeutics: Distribution by Dosing Frequency
- Figure 4.13 Exosome Therapeutics: Distribution by Type of Therapy (By method of composition)
- Figure 4.14 Exosome Therapeutics: Distribution by Line of Treatment
- Figure 4.15 Exosome Therapy Developers: Distribution by Year of Establishment
- Figure 4.16 Exosome Therapy Developers: Distribution by Company Size
- Figure 4.17 Exosome Therapy Developers: Distribution by Location of Headquarters
- Figure 4.18 Exosome Therapy Developers: Most Active Players: Distribution by Number of Therapeutic Programs
- Figure 6.1 Cellular Biomedicine Group: Financial Information, FY 2015- FY 2019 (USD Million)
- Figure 6.2 ReNeuron: Financial Information, FY 2018- FY 2022 (USD Million)
- Figure 7.1 Clinical Trials Analysis: Distribution by Trial Status
- Figure 7.2 Clinical Trials Analysis: Year-wise Distribution by Trial Registration Year, Pre- 2015- 2022
- Figure 7.3 Clinical Trials Analysis: Distribution by Sponsor / Collaborator
- Figure 7.4 Clinical Trials Analysis: Year-wise Distribution by Registration Year and Type of Study, Pre-2015-2022
- Figure 7.5 Clinical Trials Analysis: Year-wise Distribution by Registration Year and Status of Trial, Pre-2015-2022
- Figure 7.7 Clinical Trials Analysis: Distribution by Annual Number of Patients Enrolled
- Figure 7.6 Clinical Trials Analysis: Distribution by Study Design
- Figure 7.9 Clinical Trials Analysis: Distribution by Age Group
- Figure 7.10 Clinical Trials Analysis: Distribution by Phase of Development and Trial Status
- Figure 7.11 Clinical Trials Analysis: Distribution by Phase of Development and Patient Enrollment
- Figure 7.12 Most Active Industry Players: Distribution by Number of Registered Trials
- Figure 7.13 Most Active Non-Industry Players: Distribution by Number of Registered Trials
- Figure 7.14 Clinical Trials Analysis: Distribution by Trial Location
- Figure 7.15 Clinical Trials Analysis: Distribution by Trial Status and Geography
- Figure 7.15 Clinical Trials Analysis: Distribution by Trial Status, Patients Enrolled and Geography
- Figure 8.1 Academic Grant Analysis: Year-wise Distribution of Number of Grants, Pre-2019-2022
- Figure 8.2 Academic Grant Analysis: Year-wise Distribution by Amount of Grant Awarded, Pre-2019-2022 (USD Million)
- Figure 8.3 Academic Grant Analysis: Popular NIH Departments: Analysis by Number of Grants
- Figure 8.4 Academic Grant Analysis: Analysis by Type of Funding Institute Center
- Figure 8.5 Academic Grant Analysis: Distribution by Support Period
- Figure 8.6 Academic Grant Analysis: Distribution by Purpose of Grants
- Figure 8.7 Academic Grant Analysis: Distribution by Emerging Focus Area
- Figure 8.8 Academic Grant Analysis: Distribution by Grant Activity Code
- Figure 8.9 Academic Grant Analysis: Distribution by Location of Recipients Organizations
- Figure 8.10 Academic Grant Analysis: Popular Recipient Organizations: Analysis by Number of Grants
- Figure 8.11 Academic Grant Analysis: Popular Recipient Organizations: Analysis by Amount Awarded
- Figure 8.12 Academic Grant Analysis: Distribution by Type of Recipient Organization
- Figure 8.13 Academic Grant Analysis: Distribution by Study Section
- Figure 8.14 Academic Grant Analysis: Distribution by Type of Grant Application
- Figure 8.15 Academic Grant Analysis: Analysis by Funding Institute Center and Support Year
- Figure 9.1 Global Events: Cumulative Half Yearly Trend, 2019-2022
- Figure 9.2 Global Events: Distribution by Event Platform
- Figure 9.3 Global Events: Distribution by Type of Event
- Figure 9.4 Global Events: Distribution by Region
- Figure 9.6 Most Active Organizers: Distribution by Number of Events
- Figure 9.7 Most Active Speakers: Distribution by Number of Events
- Figure 9.8 Most Active Industry Participants: Distribution by Number of Events
- Figure 9.9 Most Active Non-Industry Participants: Distribution by Number of Events
- Figure 9.10 Global Events: Distribution by Designation of Participant
- Figure 9.11 Global Events: Distribution by Affiliated Department of Participant
- Figure 9.12 Word Cloud Analysis: Evolutionary Trends in Event Agenda / Key Focus Area
- Figure 10.1 Partnerships and Collaborations: Cumulative Year-wise Trend, 2017-2022
- Figure 10.2 Partnerships and Collaborations: Distribution by Type of Partnership
- Figure 10.3 Partnerships and Collaborations: Year-wise Distribution by Year and Type of Partnership, 2017- 2022
- Figure 10.4 Partnerships and Collaborations: Year-wise Distribution by Company and Type of Partnership, 2017- 2022
- Figure 10.5 Partnerships and Collaborations: Distribution by Type of Technology Platform
- Figure 10.6 Partnerships and Collaborations: Distribution by Type of Partner
- Figure 10.7 Word Cloud Analysis: Emerging Focus Areas
- Figure 10.8 Partnerships and Collaborations: Distribution by Target Disease Indication(s)
- Figure 10.9 Partnerships and Collaborations: Distribution by Therapeutic Area
- Figure 10.10 Partnerships and Collaborations: Distribution by Therapeutic Area and Type of Partnership
- Figure 10.11 Partnerships and Collaborations: Regional Distribution of Partnerships
- Figure 10.12 Partnerships and Collaborations: Distribution by Geography
- Figure 11.1 Funding and Investments: Year-wise Distribution by Year of Funding, 2017- 2022
- Figure 11.2 Funding and Investments: Year-wise Distribution by Amount Invested, 2017- 2022 (USD Million)
- Figure 11.3 Funding and Investments: Distribution by Type of Funding
- Figure 11.4 Funding and Investments: Year-wise Distribution by Type of Funding and Amount Invested, 2017- 2022
- Figure 11.5 Funding and Investments: Distribution by Purpose of Funding
- Figure 11.6 Funding and Investments: Distribution by Target Disease Indication(s)
- Figure 11.7 Funding and Investments: Distribution by Therapeutic Area
- Figure 11.8 Most Active Players: Distribution by Number of Funding Instances
- Figure 11.9 Most Active Players: Distribution by Amount Invested (USD Million)
- Figure 11.10 Key Investors: Distribution by Number of Funding Instances
- Figure 11.11 Funding and Investments: Distribution by Geography
- Figure 11.12 Summary of Funding Instances
- Figure 12.1 Start-up Health Indexing: Distribution by Pipeline Strength
- Figure 12.2 Start-up Health Indexing: Distribution by Pipeline Maturity
- Figure 12.2 Start-up Health Indexing: Distribution by Indication Diversity
- Figure 12.5 Start-up Health Indexing: Distribution by Number of Partnerships
- Figure 12.3 Start-up Health Indexing: Distribution by Financial Support
- Figure 12.4 Start-up Health Indexing: Distribution by Number of Investors
- Figure 12.6 Start-up Health Indexing: Roots Analysis Perspective
- Figure 12.7 Most Active Start-ups
- Figure 13.1 Case Study: Distribution of Exosome Development and Manufacturing Companies by Year of Establishment
- Figure 13.2 Case Study: Distribution of Exosome Development and Manufacturing Companies by Company Size
- Figure 13.3 Case Study: Distribution of Exosome Development and Manufacturing Companies by Location of Headquarters
- Figure 13.4 Case Study: Distribution of Exosome Development and Manufacturing Companies by Location of Headquarters and Company Size
- Figure 13.5 Case Study: Distribution of Exosome Development and Manufacturing Companies by Type of Service(s) Offered
- Figure 13.6 Case Study: Distribution of Exosome Development and Manufacturing Companies by Method(s) of Isolation
- Figure 13.7 Case Study: Distribution of Exosome Development and Manufacturing Companies by Method(s) of Purification
- Figure 13.8 Case Study: Distribution of Exosome Development and Manufacturing Companies by Method(s) of Characterization
- Figure 13.9 Case Study: Distribution of Exosome Development and Manufacturing Companies by Method(s) of Manufacturing
- Figure 13.10 Case Study: Distribution of Exosome Development and Manufacturing Companies by Scale of Operation
- Figure 13.11 Case Study: Distribution of Exosome Development and Manufacturing Companies by Scalability
- Figure 14.1 Drug Failure Analysis: Distribution by Trial Start and Discontinuation Year
- Figure 14.2 Drug Failure Analysis: Distribution by Trial Status of Discontinuation
- Figure 14.3 Drug Failure Analysis: Distribution by Target Disease Indication(s)
- Figure 14.4 Drug Failure Analysis: Distribution by Route of Administration
- Figure 14.5 Drug Failure Analysis: Distribution by Type of Sponsor
- Figure 14.6 Drug Failure Analysis: Distribution by Reasons for Drug Failure
- Figure 15.1 Global Exosome Therapy Market, Till 2040 (USD Million)
- Figure 15.2 Exosome Therapy Market for Allogeneic Therapy, 2029-240 (USD Million)
- Figure 15.3 Exosome Therapy Market for Autologous Therapy, Till 2040 (USD Million)
- Figure 15.4 Exosome Therapy Market for Retinitis Pigmentosa, 2031-2040 (USD Million)
- Figure 15.5 Exosome Therapy Market for Dystrophic Epidermolysis Bullosa, 2030-2040 (USD Million)
- Figure 15.6 Exosome Therapy Market for Degenerative Meniscal Injury, Till 2040 (USD Million)
- Figure 15.7 Exosome Therapy Market for Fistula Perianal, Till 2040 (USD Million)
- Figure 15.8 Exosome Therapy Market for Dermatological Disorders, 2030-2040 (USD Million)
- Figure 15.9 Exosome Therapy Market for Muscoskeletal Disorders, 2031-2040 (USD Million)
- Figure 15.10 Exosome Therapy Market for Ophthalmic Disorders, Till 2040 (USD Million)
- Figure 15.11 Exosome Therapy Market for Rectal Disorders, Till 2040 (USD Million)
- Figure 15.12 Fistula Tract Exosome Therapy Market, Till 2040 (USD Million)
- Figure 15.13 Intra-articular Exosome Therapy Market, 2031-2040 (USD Million)
- Figure 15.14 Intra-ocular Exosome Therapy Market, Till 2040 (USD Million)
- Figure 15.15 Exosome Therapy Market Geographical Distribution, 2031-2040 (USD Million)
- Figure 15.16 Erciyes University's Drug: Sales Forecast, Till 2040 (USD Million)
- Figure 15.17 Synovial Fluid-Derived Mesenchymal Stem Cells: Sales Forecast, 2031-2040 (USD Million)
- Figure 15.18 AGLE-102: Sales Forecast, 2030-2040 (USD Million)
- Figure 15.19 Trehan University of Medical Sciences' Drug: Sales Forecast, Till 2040 (USD Million)
- Figure 15.20 ReNeuron' Drug: Sales Forecast, Till 2040 (USD Million)

 全球外泌體市場-市場規模、預測、臨床試驗與趨勢(2026 年)
 外泌體市場規模、佔有率和趨勢分析報告:按產品/服務、工作流程、應用、最終用途、地區和細分市場預測(2026-2033 年)
 外泌體診斷和治療市場:按類型、產品類型、服務、來源、應用、最終用戶和地區分類
 2026-2034年全球外泌體市場規模、佔有率、趨勢和成長分析報告外泌體技術全球市場規模、佔有率、趨勢和成長分析報告(2026-2034年)
 全球外泌體療法市場:依外泌體來源、治療方法、治療環境、治療應用案例、給藥方法、監管分類和地區劃分-市場規模、產業動態、機會分析和預測(2026-2035 年)美國外泌體市場規模、佔有率和趨勢分析報告:按產品/服務、應用、工作流程、最終用途和細分市場預測,2026-2033年
 外泌體護膚市場規模、佔有率及成長分析(依產品類型、成分、應用、通路、最終用戶及地區分類)-2026-2033年產業預測
 外泌體療法市場-全球產業規模、佔有率、趨勢、機會和預測,按外泌體類型、來源、療法、應用、最終用戶、地區和競爭格局分類,2020-2030年預測
 全球家庭治療遊戲基礎設施市場:未來預測(至2032年)-按產品類型、治療方法、年齡層、安裝類型、分銷管道、最終用戶和地區進行分析