


 |
市場調查報告書
商品編碼
2055609
快速傳輸連接埠市場:Beta解決方案類型、傳輸材料的物理狀態、最終用戶、地區、主要參與者趨勢和預測(至2035年)Rapid Transfer Port Market by Type of Beta Solution Offered, Physical State of Transferring Material, End User, Geographical Regions and Leading Players - Trends and Forecast Till 2035 |
||||||
快速轉運港(RTP)市場概覽
快速轉運連接埠 (RTP) 市場預計到 2035 年將以 7.3% 的年複合成長率成長,到 2035 年將達到 5.31 億美元,高於目前的 2.83 億美元。
快速轉運港市場:成長與趨勢
過去十年,在生物製藥、細胞和基因療法以及高活性藥物原料藥(HPAPI)等領域的進步推動下,製藥業的創新發展迅速。加之對無菌注射劑和可靠的無菌生產流程的需求日益成長,這一趨勢也使得有效的污染控制策略變得尤為重要。然而,由於無菌製程的複雜性,尤其是在隔離器、限制性屏障系統(RABS)和無塵室環境中確保物料轉移過程中的無菌性方面,仍有許多挑戰。
為此,製藥公司正擴大將高效能快速轉移連接埠(RTP)應用於其生產流程。這些系統由精密設計的α和BETA組件所構成,可在不影響隔離器或RABS無菌性的前提下,實現安全無洩漏的物料轉移。尤其值得一提的是,市場正轉向一次性BETA袋和自動化端口系統,這些產品可減少人為干預並簡化滅菌驗證流程。
除了具有隔離能力外,RTP 技術如今在提升生產營運柔軟性方面發揮著至關重要的作用,它能夠縮短生產線切換時間,並支援小批量、個人化生產。此外,在材料科學、機器人、無手套隔離器以及符合製藥 4.0 標準的數位化監控系統等領域的創新推動下,無菌生產領域正在快速發展。這些進步在帶來新機會的同時,也增加了機械複雜性,因此需要經過驗證、高度可靠的轉移解決方案來滿足嚴格的監管要求。先進屏障技術與新一代 RTP 介面的融合對於確保高活性無菌治療藥物的安全供應至關重要,並有望最終在日益嚴格的法規環境下改善患者的治療效果。
成長促進因素:市場擴張的策略推動者
受製藥生產中一次性技術應用日益廣泛以及封閉式製程的推動,即用型製劑(RTP)市場正經歷快速成長。一次性RTP組件(例如BETA袋、一次性介面和傳輸盒)的整合顯著減少了清洗和驗證要求,同時最大限度地降低了交叉污染的風險。此外,這些解決方案能夠實現更快、更靈活的批次切換,尤其是在細胞和基因療法以及高活性原料藥的生產中。
這一轉變也受到產業對自動化和減少無菌環境下人為干預日益成長的需求的推動。此外,無菌製程技術的進步使得快速處理製程(RTP)系統能夠與機器人和先進的對接機制整合,從而實現高度可控、低接觸的操作。這些進步共同增強了無菌保證,提高了營運效率,降低了人體工學和安全風險,並提高了產量,從而支持了實現可擴展、經濟高效且合規的生產流程的行業目標。
市場挑戰:阻礙進展的主要障礙
另一方面,RTP市場面臨許多挑戰,主要源自於無菌藥品生產的複雜性。高昂的實施和驗證成本是一大障礙,尤其對於中小企業而言;而嚴格的監管要求則延長了產品上市時間,並增加了營運負擔。此外,與隔離器、RABS以及現有無塵室基礎設施的技術整合也可能面臨挑戰,尤其是在老舊設施中。供應商之間缺乏標準化進一步限制了互通性,並導致對特定供應商的依賴。此外,持續的維護需求和對熟練人員的需求也增加了營運成本和複雜性。最後,除了來自一次性使用和一次性轉移技術的競爭外,永續性問題也在改變市場動態,並對傳統RTP的採用施加壓力。

快速轉運港市場
市場規模和機會分析是根據以下參數進行細分的:
Beta 解決方案類型
- 一次性 Beta 袋
- 可重複使用的測試版容器
根據被運輸物體的物理狀態
- 固體轉移
- 液體轉移
- 粉末轉移
- 其他
最終用戶
- 製藥公司
- CMO
按地區
- 北美洲
- 北美洲
- 亞太地區
- 拉丁美洲
- 中東和北非
快速轉運港市場:主要細分市場
一次性環保袋正在成為一個重要的市場區隔。
一次性BETA袋是即食食品市場的主要驅動力,今年約佔市場佔有率的55%。其主導地位主要歸功於BETA袋省去了傳統不銹鋼罐所需的耗時耗力的清洗、滅菌和檢驗等工序。此外,預計一次性BETA袋在預測期內將維持更高的年複合成長率。
固體傳輸推動了RTP產業的發展
目前,固態輸送領域約佔整體市場的55%。這一主導地位源自於RTP系統處理的固態組件(例如塞子、柱塞、密封件和瓶蓋)數量遠大於液體和粉末。鑑於每個生產批次都需要將數千個無菌組件引入隔離器,固態輸送RTP系統在無菌生產流程中扮演著至關重要的操作基礎角色。展望未來,液體輸送領域預計將在預測期內實現強勁成長。這一成長主要得益於生物製藥、注射、疫苗和腸外製劑需求的不斷成長,這些產品需要高度精確且無污染的無菌填充、包裝和下游製程。
亞太地區是整體市場的主要驅動力。
亞太地區在即用型藥品運輸(RTP)市場佔據主導地位,約佔總銷售額的40%。這一主導地位主要得益於製藥生產能力的強勁擴張,尤其是在中國和印度,以及對需要高度密閉無菌運輸解決方案的先進治療方法日益成長的需求。此外,日本和韓國正在崛起為全球主要的無菌藥品、生物製藥、注射劑、細胞和基因療法以及高活性藥物原料藥(HPAPI)生產中心。這種生產格局的轉變正在進一步加速RTP技術在全部區域的應用。
北美和歐洲也是推動RTP市場成長的主要力量。
北美和歐洲在推動即用型製劑(RTP)市場成長方面發揮著至關重要的作用,這得益於生物製藥製造地的高度集中以及一次性技術的快速普及。這一趨勢主要是由於需要遵守嚴格的監管要求,包括美國食品藥物管理局(FDA)的指導方針和歐盟藥品生產品質管理規範(GMP)附件一的無菌標準。
本報告對全球快速傳輸連接埠 (RTP) 市場進行了分析,提供了概述、背景、市場影響因素分析、市場規模趨勢和預測、按各個細分市場進行的詳細分析、競爭格局以及主要公司的概況。
RTP市場:主要公司案例
- ABC Transfer
- AGIC Capital
- Amira
- AnalytiChem UK (Cherwell Laboratories)
- Aseptic Technologies (SKAN)
- ATEC Pharmatechnik
- AUSTAR
- AVM Extraordinary Intelligent Control Equipment
- Benchmark Products
- BioPharm Dynamics
- Cape Europe
- castus
目錄
第1章 背景
第2章:調查方法
第3章 市場動態
- 章節概要
- 預測性調查方法
- 市場估值框架
- 預測工具和方法
- 重要考慮因素
- 限制
第4章 宏觀經濟指標
- 章節概要
- 市場動態
- 結論
第5章執行摘要
- 章節概要
- 市場狀況
- 市場趨勢
- 市場預測與機會分析
第6章:引言
- 快速傳輸連接埠(RTP)概述
- RTP的組成部分
- RTP的優勢
- RTP應用範例
- 與RTP相關的挑戰
- 前景
第7章 市場狀況
- RTP:市場狀況
- 市場結構:RTP 組成部分
- 市場結構:AlphaPort營運模式
- 市場結構:Alphaport 孔徑法
- 市場結構:Beta解決方案類型
- 市場結構:Beta 解決方案模式
- 市場構成:RTP口徑
- 市場構成:運輸貨物
- 市場結構:被輸送對象的物理狀態
- 市場構成:配件
- RTP公司:市場狀況
- 成立年份
- 公司規模
- 總部所在地
- 最活躍的公司
第8章:企業競爭力分析
- 調查方法和關鍵參數
- 評分標準
- Peer Group
- RTP:企業競爭力分析
- Alphaport(Peer Group1)
- Beta 組件(Peer Group2)
- AlphaPort 與 Beta 元件
第9章夥伴關係與合作
- 章節概要
- 夥伴關係模式
- RTP:夥伴關係與合作
- 合作年
- 夥伴關係類型
- 按年份和夥伴關係類型
- RTP系統類型
- 最活躍的公司:已簽合約數量
- 區域分析
- 收購模式
- 按收購類型
- 所有權變更矩陣
- 關鍵價值創造因素
第10章:全球快速轉運港(RTP)市場
- 章節概要
- 先決條件和調查方法
- 全球即時支付市場:趨勢與預測
- 主要市場區隔
第11章 快速傳輸連接埠 (RTP) 市場:按 Beta 解決方案類型分類
- 章節概要
- 先決條件和調查方法
- Beta 解決方案類型
- 一次性 Beta 袋
- 可重複使用的測試版容器
- 數據三角測量與檢驗
第12章 快速轉運港(RTP)市場:依轉運物料的物理狀態分類
- 章節概要
- 先決條件和調查方法
- RTP市場:依運輸對象的物理狀態分類
- 固體的
- 液體
- 粉末
- 其他
- 數據三角測量與檢驗
第13章 快速傳輸連接埠(RTP)市場:依最終用戶分類
- 章節概要
- 先決條件和調查方法
- RTP市場:依最終用戶分類
- 製藥公司
- CMO
- 數據三角測量與檢驗
第14章 快速轉運港(RTP)市場:依地區分類
- 章節概要
- 先決條件和調查方法
- RTP市場:依地區分類
- 北美洲
- 歐洲
- 亞太地區
- 拉丁美洲
- 中東和北非
- 數據三角測量與檢驗
第15章 市場機會分析:北美
- Beta 解決方案類型
- 根據被運輸物體的物理狀態
- 最終用戶
第16章 市場機會分析:歐洲
- Beta 解決方案類型
- 根據被運輸物體的物理狀態
- 最終用戶
第17章 市場機會分析:亞太地區
- Beta 解決方案類型
- 根據被運輸物體的物理狀態
- 最終用戶
第18章 市場機會分析:拉丁美洲
- Beta 解決方案類型
- 根據被運輸物體的物理狀態
- 最終用戶
第19章 市場機會分析:中東與北非
- Beta 解決方案類型
- 根據被運輸物體的物理狀態
- 最終用戶
第20章 快速轉運港(RTP)市場:依主要公司分類
- 章節概要
- 關鍵參數和調查方法
- 主要RTP公司
第21章 結論
第22章:高階主管洞察
第23章附錄一:表格形式數據
第24章 附錄二:公司與組織列表
Rapid Transfer Port Market: Overview
As per Roots Analysis, the rapid transfer port is estimated to grow from USD 283 million in the current year to USD 531 million by 2035, at a CAGR of 7.3% during the forecast period, till 2035.
Rapid Transfer Port Market: Growth and Trends
Over the past decade, the pharmaceutical industry has experienced a significant surge in innovation, driven by advancements in biologics, cell and gene therapies, and high-potency active pharmaceutical ingredients (HPAPIs). Coupled with the increasing demand for sterile injectables and robust aseptic manufacturing processes, this trend has intensified the need for effective contamination control strategies. However, a key challenge persists in the complexity of aseptic processing, particularly in ensuring sterility during material transfers within isolators, restricted access barrier systems (RABS), and cleanroom environments.
In response, pharmaceutical companies are increasingly integrating high-performance rapid transfer ports (RTPs) into their manufacturing operations. These systems, defined by precision-engineered alpha and beta components, enable secure and leak-free transfer of materials without compromising the sterile integrity of isolators or RABS. Notably, the market is shifting toward single-use beta bags and automated port systems, which reduce human intervention and streamline sterilization validation processes.
Beyond containment, RTP technology now plays a critical role in enhancing operational agility by facilitating faster line changeovers and supporting small-batch, personalized manufacturing. Further, the aseptic manufacturing landscape is evolving rapidly, driven by innovations in material science, robotic gloveless isolators, and Pharma 4.0-enabled digital monitoring systems. While these advancements unlock new opportunities, they also introduce increased mechanical complexity, necessitating validated, high-integrity transfer solutions to meet stringent regulatory requirements. The convergence of advanced barrier technologies and next-generation RTP interface will be pivotal in ensuring the safe delivery of high-potency and sterile therapies, ultimately improving patient outcomes in an increasingly rigorous regulatory environment.
Growth Drivers: Strategic Enablers of Market Expansion
The rapid transfer port (RTP) market is witnessing accelerated growth, driven by the increasing adoption of single-use technologies and the transition toward closed-system processing in pharmaceutical manufacturing. The integration of disposable RTP components, such as beta bags, single-use interfaces, and transfer kits, has significantly reduced cleaning and validation requirements while minimizing cross-contamination risks. Additionally, these solutions enable faster and more flexible batch changeovers, particularly in cell and gene therapy and high-potency API production.
This shift is further reinforced by industry's increasing focus on automation and reduced human intervention in aseptic environments. Moreover, advancements in aseptic processing technologies have enabled the integration of RTP systems with robotics and sophisticated docking mechanisms, facilitating highly controlled and low-touch operations. Collectively, these developments are enhancing sterility assurance, improving operational efficiency, reducing ergonomic and safety risks, and increasing throughput, thereby supporting the broader industry objective of achieving scalable, cost-effective, and compliant manufacturing processes.
Market Challenges: Critical Barriers Impeding Progress
The rapid transfer port (RTP) market faces several challenges primarily driven by the complexity of aseptic pharmaceutical manufacturing. High implementation and validation costs act as significant barriers, particularly for small and mid-sized companies, while stringent regulatory requirements increase time-to-market and operational burden. Additionally, technical integration with isolators, RABS, and existing cleanroom infrastructure can be difficult, especially in legacy facilities. The lack of standardization across vendors further limits interoperability and leads to vendor dependency. Moreover, ongoing maintenance requirements and the need for a skilled workforce add to operational costs and complexity. Finally, growing competition from single-use and disposable transfer technologies, along with sustainability concerns, is reshaping market dynamics and pressuring traditional RTP adoption.
Rapid Transfer Port Market: Key Insights
The report delves into the current state of the rapid transfer port and identifies potential growth opportunities within industry. Some key findings from the report include:
- Rapid transfer ports have become essential in pharmaceutical manufacturing, streamlining aseptic material transfer workflows, enhancing sterility assurance, and minimizing downtime in fill-finish and containment operations.
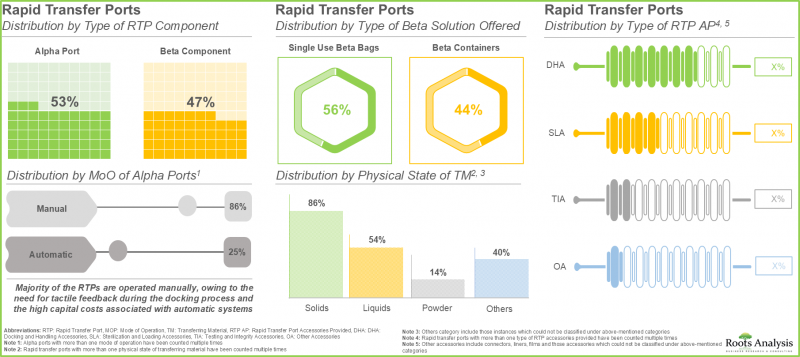
- Presently, close to 55 rapid transfer ports are being offered by various players; alpha ports (~55%) emerged as the most prominent type of component, followed by beta components (~50%).
- Close to 90% of the rapid transfer ports feature manual operation, highlighting the preference for simpler designs; notably, 70% of the companies offer docking and handling accessories for their rapid transfer ports.
- Around 40% of the agreements in the rapid transfer port domain were inked in the last two years; notably, majority (>40%) of the deals were inked by the players headquartered in France.
- With an aim to expand the rapid transfer port capabilities, the companies have undertaken strategic acquisitions in the recent past, focusing on enhancing sterile, high-containment and aseptic transfer systems.
- Ongoing shift towards rapid transfer ports have proven useful in the safe and effective transfer of high value biologics; these are anticipated to drive the rapid transfer ports market in future.
- Rapid transfer ports market is poised for substantial growth in the coming years, driven by the rising biologics manufacturing and a shift toward single-use systems for enhanced sterility and contamination control.
- Asia-Pacific is expected to capture a significant market share of the overall rapid transfer ports market in the current year, driven by ongoing expansion in pharmaceutical manufacturing.
- Driven by the rapid technological advancements within rapid transfer ports by prominent players in the US, the market is expected to grow at CAGR of 6.9%.
Rapid Transfer Port Market
The market sizing and opportunity analysis has been segmented across the following parameters:
By Type of Beta Solution Offered
- Single Use Beta Bags
- Reusable Beta Container
By Physical State of Transferring Material
- Solid Transfer
- Liquid Transfer
- Powder Transfer
- Others
By End User
- Pharmaceutical Companies
- Contract Manufacturing Organizations
By Geographical Regions
- North America
- Europe
- Asia-Pacific
- Latin America
- Middle East and North Africa
Rapid Transfer Port Market: Key Segments
Single-use Beta Bags are emerging as the leading segment in the Rapid Transfer Port
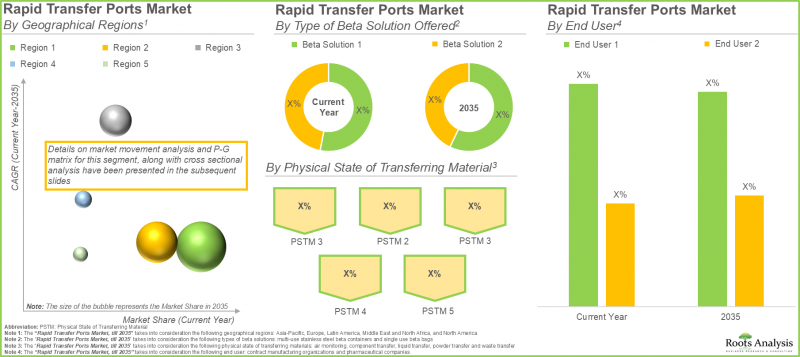
Single-use beta bags lead the rapid transfer port market, accounting for approximately 55% of the total market share in the current year. This dominance is primarily driven by their ability to eliminate the time- and cost-intensive processes associated with cleaning, sterilization, and revalidation required for traditional stainless-steel canisters. Furthermore, single-use beta bags are expected to register a higher CAGR over the forecast period.
Solid Transfer is Driving the Rapid Transfer Port Industry
According to the rapid transfer port market forecast, the solid transfer segment currently accounts for approximately 55% of the total market share. This dominance is attributed to the significantly higher volume of solid components such as stoppers, plungers, seals, and caps handled through RTP systems compared to liquid or powder transfers. Given that each production batch requires the introduction of thousands of sterile components into isolators, solid transfer RTPs serve as a critical operational backbone within aseptic manufacturing workflows. In future, the liquid transfer segment is expected to witness robust growth over the forecast period. This growth is driven by the increasing demand for biologics, injectables, vaccines, and parenteral drugs, which require highly precise and contamination-free aseptic fill-finish and downstream processing.
Asia-Pacific Dominates the Overall Market
The Asia-Pacific region dominates the rapid transfer port market, accounting for approximately 40% of the total revenue share. This leadership is driven by the strong expansion of pharmaceutical manufacturing capabilities, particularly in China and India, supported by increasing demand for advanced therapies that require high-containment aseptic transfer solutions. In addition, Japan and South Korea are emerging as key global hubs for the production of sterile drugs, biologics, injectables, cell and gene therapies, and high-potency active pharmaceutical ingredients (HPAPIs). This evolving manufacturing landscape is further accelerating the adoption of RTP technologies across the region.
North America and Europe Propel Growth in the Rapid Transfer Port Market
North America and Europe are playing a critical role in driving the growth of the rapid transfer port market, supported by a high concentration of biopharmaceutical manufacturing hubs and the rapid adoption of single-use technologies. This trend is largely driven by the need to comply with stringent regulatory requirements, including FDA guidelines and EU GMP Annex 1 sterility standards.
Example Players in Rapid Transfer Port Market
- ABC Transfer
- AGIC Capital
- Amira
- AnalytiChem UK (formerly known as Cherwell Laboratories)
- Aseptic Technologies (acquired by SKAN)
- ATEC Pharmatechnik
- AUSTAR
- AVM Extraordinary Intelligent Control Equipment
- Benchmark Products
- BioPharm Dynamics
- Cape Europe
- castus
Rapid Transfer Port Market: Research Coverage
- Market Sizing and Opportunity Analysis: The report features an in-depth analysis of the medical device contract manufacturing market, focusing on key market segments, including [A] type of beta solution offered [B] physical state of transferring material, [C] end user, and [D] geographical regions.
- Rapid Transfer Port Market Landscape: A detailed assessment of the overall rapid transfer port market landscape, along with information on several relevant parameters, such as [A] type of rapid transfer port component, [B] mode of operation of alpha ports, [C] type of opening for alpha ports, [D] type of beta solution offered, [E] format of beta solution offered, [F] rapid transfer port diameter, [G] type of product transferred, [H] physical state of transferring material, [I] type of RTP accessories provided, [J] year of establishment, [K] company size (based on employee count) and [L] location of headquarters.
- Company Competitiveness Analysis: An in-depth company competitiveness analysis of rapid transfer port companies based on various relevant parameters, such as [A] company strength, [B] portfolio strength and [C] portfolio diversity.
- Partnerships and Collaborations: A detailed analysis of the partnerships and collaborations based on various parameters, such as [A] year of partnership, [B] type of partnership, [C] type of rapid transfer port system, [D] most active players (in terms of number of partnerships), [E] geographical analysis and [F] acquisition analysis based on type of acquisition, parent company type and key value drivers.
Key Questions Answered in this Report
- Which are the leading companies in the rapid transfer port market?
- Which region dominates the rapid transfer port market?
- What are the key trends observed in the rapid transfer port market?
- What factors are likely to influence the evolution of this market?
- What are the primary challenges faced by rapid transfer port providers?
- What is the current and future market size?
- What is the CAGR of this market?
- How is the current and future market opportunity likely to be distributed across key market segments?
Reasons to Buy this Report
- The report provides a comprehensive market analysis, offering detailed revenue projections of the overall market and its specific sub-segments. This information is valuable to both established market leaders and emerging entrants.
- The report offers stakeholders a comprehensive overview of the market, including key drivers, barriers, opportunities, and challenges. This information empowers stakeholders to stay abreast of market trends and make data-driven decisions to capitalize on growth prospects.
- The report can aid businesses in identifying future opportunities in any sector. It also helps in understanding if those opportunities are worth pursuing.
- The report helps in identifying customer demand by understanding the needs, preferences, and behavior of the target audience in order to tailor products or services effectively.
- The report equips new entrants with requisite information regarding a particular market to help them build successful business strategies.
- The report allows for more effective communication with the audience and in building strong business relations.
Additional Benefits
- Complimentary Excel Data Packs for all Analytical Modules in the Report
- 15% Free Content Customization
- Detailed Report Walkthrough Session with Research Team
- Free Updated report if the report is 6-12 months old or older
TABLE OF CONTENTS
1. BACKGROUND
- 1.1. Context
- 1.2. Project Objectives
2. RESEARCH METHODOLOGY
- 2.1. Chapter Overview
- 2.2. Research Assumptions
- 2.2.1. Market Landscape and Market Trends
- 2.2.2. Market Forecast and Opportunity Analysis
- 2.2.3. Comparative Analysis
- 2.3. Database Building
- 2.3.1. Data Collection
- 2.3.2. Data Validation
- 2.3.3. Data Analysis
- 2.4. Project Methodology
- 2.4.1. Secondary Research
- 2.4.1.1. Annual Reports
- 2.4.1.2. Academic Research Papers
- 2.4.1.3. Company Websites
- 2.4.1.4. Investor Presentations
- 2.4.1.5. Regulatory Filings
- 2.4.1.6. White Papers
- 2.4.1.7. Industry Publications
- 2.4.1.8. Conferences and Seminars
- 2.4.1.9. Government Portals
- 2.4.1.10. Media and Press Releases
- 2.4.1.11. Newsletters
- 2.4.1.12. Industry Databases
- 2.4.1.13. Roots Proprietary Databases
- 2.4.1.14. Paid Databases and Sources
- 2.4.1.15. Social Media Portals
- 2.4.1.16. Other Secondary Sources
- 2.4.2. Primary Research
- 2.4.2.1. Types of Primary Research
- 2.4.2.1.1. Qualitative Research
- 2.4.2.1.2. Quantitative Research
- 2.4.2.1.3. Hybrid Approach
- 2.4.2.2. Advantages of Primary Research
- 2.4.2.3. Techniques for Primary Research
- 2.4.2.3.1. Interviews
- 2.4.2.3.2. Surveys
- 2.4.2.3.3. Focus Groups
- 2.4.2.3.4. Observational Research
- 2.4.2.3.5. Social Media Interactions
- 2.4.2.4. Key Opinion Leaders Considered in Primary Research
- 2.4.2.4.1. Company Executives (CXOs)
- 2.4.2.4.2. Board of Directors
- 2.4.2.4.3. Company Presidents and Vice Presidents
- 2.4.2.4.4. Research and Development Heads
- 2.4.2.4.5. Technical Experts
- 2.4.2.4.6. Subject Matter Experts
- 2.4.2.4.7. Scientists
- 2.4.2.4.8. Doctors and Other Healthcare Providers
- 2.4.2.5. Ethics and Integrity
- 2.4.2.5.1. Research Ethics
- 2.4.2.5.2. Data Integrity
- 2.4.2.1. Types of Primary Research
- 2.4.3. Analytical Tools and Databases
- 2.4.1. Secondary Research
- 2.5. Robust Quality Control
3. MARKET DYNAMICS
- 3.1. Chapter Overview
- 3.2. Forecast Methodology
- 3.2.1. Top-down Approach
- 3.2.2. Bottom-up Approach
- 3.2.3. Hybrid Approach
- 3.3. Market Assessment Framework
- 3.3.1. Total Addressable Market (TAM)
- 3.3.2. Serviceable Addressable Market (SAM)
- 3.3.3. Serviceable Obtainable Market (SOM)
- 3.3.4. Currently Acquired Market (CAM)
- 3.4. Forecasting Tools and Techniques
- 3.4.1. Qualitative Forecasting
- 3.4.2. Correlation
- 3.4.3. Regression
- 3.4.4. Extrapolation
- 3.4.5. Convergence
- 3.4.6. Sensitivity Analysis
- 3.4.7. Scenario Planning
- 3.4.8. Data Visualization
- 3.4.9. Time Series Analysis
- 3.4.10. Forecast Error Analysis
- 3.5. Key Considerations
- 3.5.1. Demographics
- 3.5.2. Government Regulations
- 3.5.3. Reimbursement Scenarios
- 3.5.4. Market Access
- 3.5.5. Supply Chain
- 3.5.6. Industry Consolidation
- 3.5.7. Pandemic / Unforeseen Disruptions Impact
- 3.6. Limitations
4. MACRO-ECONOMIC INDICATORS
- 4.1. Chapter Overview
- 4.2. Market Dynamics
- 4.2.1. Time Period
- 4.2.1.1. Historical Trends
- 4.2.1.2. Current and Forecasted Estimates
- 4.2.2. Currency Coverage
- 4.2.2.1. Major Currencies Affecting the Market
- 4.2.2.2. Factors Affecting Currency Fluctuations in the Industry
- 4.2.2.3. Impact of Currency Fluctuations on the Industry
- 4.2.3. Foreign Currency Exchange Rate
- 4.2.3.1. Impact of Foreign Exchange Rate Volatility on the Market
- 4.2.3.2. Strategies for Mitigating Foreign Exchange Risk
- 4.2.4. Recession
- 4.2.4.1. Assessment of Current Economic Conditions and Potential Impact on the Market
- 4.2.4.2. Historical Analysis of Past Recessions and Lessons Learnt
- 4.2.5. Inflation
- 4.2.5.1. Measurement and Analysis of Inflationary Pressures in the Economy
- 4.2.5.2. Potential Impact of Inflation on the Market Evolution
- 4.2.6. Interest Rates
- 4.2.6.1. Interest Rates and Their Impact on the Market
- 4.2.6.2. Strategies for Managing Interest Rate Risk
- 4.2.7. Commodity Flow Analysis
- 4.2.7.1. Type of Commodity
- 4.2.7.2. Origins and Destinations
- 4.2.7.3. Values and Weights
- 4.2.7.4. Modes of Transportation
- 4.2.8. Global Trade Dynamics
- 4.2.8.1. Import Scenario
- 4.2.8.2. Export Scenario
- 4.2.8.3. Trade Policies
- 4.2.8.4. Strategies for Mitigating the Risks Associated with Trade Barriers
- 4.2.8.5. Impact of Trade Barriers on the Market
- 4.2.9. War Impact Analysis
- 4.2.9.1. Russian-Ukraine War
- 4.2.9.2. Israel-Hamas War
- 4.2.10. COVID Impact / Related Factors
- 4.2.10.1. Global Economic Impact
- 4.2.10.2. Industry-specific Impact
- 4.2.10.3. Government Response and Stimulus Measures
- 4.2.10.4. Future Outlook and Adaptation Strategies
- 4.2.11. Other Indicators
- 4.2.11.1. Fiscal Policy
- 4.2.11.2. Consumer Spending
- 4.2.11.3. Gross Domestic Product
- 4.2.11.4. Employment
- 4.2.11.5. Taxes
- 4.2.11.6. Stock Market Performance
- 4.2.11.7. Cross Border Dynamics
- 4.2.1. Time Period
- 4.3. Conclusion
5. EXECUTIVE SUMMARY
- 5.1. Chapter Overview
- 5.2. Executive Summary: Market Landscape
- 5.3. Executive Summary: Market Trends
- 5.4. Executive Summary: Market Forecast and Opportunity Analysis
6. INTRODUCTION
- 6.1. Overview of Rapid Transfer Ports
- 6.2. Elements of Rapid Transfer Ports
- 6.3. Advantages Rapid Transfer Ports
- 6.4. Applications of Rapid Transfer Ports
- 6.5. Challenges associated with Rapid Transfer Ports
- 6.6. Future Perspectives
7. MARKET LANDSCAPE
- 7.1. Rapid Transfer Ports: Overall Market Landscape
- 7.1.1. Analysis by Type of Rapid Transfer Port Component
- 7.1.2. Analysis by Mode of Operation of Alpha Ports
- 7.1.3. Analysis by Type of Opening for Alpha Ports
- 7.1.4. Analysis by Type of Beta Solution Offered
- 7.1.5. Analysis by Format of Beta Solution Offered
- 7.1.6. Analysis by Rapid Transfer Port Diameter
- 7.1.7. Analysis by Type of Product Transferred
- 7.1.8. Analysis by Physical State of Transferring Material
- 7.1.9. Analysis by Rapid Transfer Port Accessories Provided
- 7.2. Rapid Transfer Port Companies: Market Landscape
- 7.2.1. Analysis by Year of Establishment
- 7.2.2. Analysis by Company Size
- 7.2.3. Analysis by Location of Headquarters
- 7.2.4. Most Active Players: Analysis by Number of Products Offered
8. COMPANY COMPETITIVENESS ANALYSIS
- 8.1. Methodology and Key Parameters
- 8.2. Scoring Criteria
- 8.3. Peer Groups
- 8.3.1. Overview of Peer Groups
- 8.4. Rapid Transfer Ports: Company Competitiveness Analysis
- 8.4.1. Rapid Transfer Port Companies Offering Alpha Ports (Peer Group 1)
- 8.4.2. Rapid Transfer Port Companies Offering Beta Components (Peer Group 2)
- 8.4.3. Leading Rapid Transfer Port Companies Offering both Alpha Ports and Beta Components
9. PARTNERSHIPS AND COLLABORATIONS
- 9.1. Chapter Overview
- 9.2. Partnership Models
- 9.3. Rapid Transfer Port Companies: Partnerships and Collaborations
- 9.3.1. Analysis by Year of Partnership
- 9.3.2. Analysis by Type of Partnership
- 9.3.3. Analysis by Year and Type of Partnership
- 9.3.4. Analysis by Type of Rapid Transfer Port System
- 9.3.5. Most Active Players: Analysis by Number of Agreements Inked
- 9.3.6. Analysis by Geography
- 9.3.6.1. Local and International Agreements
- 9.3.6.2. Intracontinental and Intercontinental Agreements
- 9.4. Acquisition Models
- 9.4.1. Analysis by Type of Acquisition
- 9.4.2. Ownership Change Matrix
- 9.4.3. Key Value Drivers
10. GLOBAL RAPID TRANSFER PORTS MARKET
- 10.1. Chapter Overview
- 10.2. Assumptions and Methodology
- 10.3. Global Rapid Transfer Ports Market: Historical Trends (Since 2022) and Forecasted Estimates (Till 2035)
- 10.3.1. Scenario Analysis
- 10.3.1.1. Conservative Scenario
- 10.3.1.2. Optimistic Scenario
- 10.3.1. Scenario Analysis
- 10.4. Key Market Segments
11. RAPID TRANSFER PORTS MARKET, BY TYPE OF BETA SOLUTION OFFERED
- 11.1. Chapter Overview
- 11.2. Assumptions and Methodology
- 11.3. Rapid Transfer Ports Market: Distribution by Type of Beta Solution Offered
- 11.3.1. Rapid Transfer Ports Market for Single Use Beta Bags: Historical Trends (Since 2022) and Forecasted Estimates (Till 2035)
- 11.3.1.1. Rapid Transfer Ports Market for Ready to Use (gamma): Historical Trends (Since 2022) and Forecasted Estimates (Till 2035)
- 11.3.1.2. Rapid Transfer Ports Market for Ready to Sterilize (steam): Historical Trends (Since 2022) and Forecasted Estimates (Till 2035)
- 11.3.2. Rapid Transfer Ports Market for Reusable Beta Containers: Historical Trends (Since 2022) and Forecasted Estimates (Till 2035)
- 11.3.1. Rapid Transfer Ports Market for Single Use Beta Bags: Historical Trends (Since 2022) and Forecasted Estimates (Till 2035)
- 11.4. Data Triangulation and Validation
12. RAPID TRANSFER PORTS MARKET, BY PHYSICAL STATE OF TRANSFERRING MATERIAL
- 12.1. Chapter Overview
- 12.2. Assumptions and Methodology
- 12.3. Rapid Transfer Ports Market: Distribution by Physical State of Transferring Material
- 12.3.1. Rapid Transfer Ports Market for Solid Transfer: Historical Trends (Since 2022) and Forecasted Estimates (Till 2035)
- 12.3.2. Rapid Transfer Ports Market for Liquid Transfer: Historical Trends (Since 2022) and Forecasted Estimates (Till 2035)
- 12.3.3. Rapid Transfer Ports Market for Powder Transfer: Historical Trends (Since 2022) and Forecasted Estimates (Till 2035)
- 12.3.4. Rapid Transfer Ports Market for Others: Historical Trends (Since 2022) and Forecasted Estimates (Till 2035)
- 12.4. Data Triangulation and Validation
13. RAPID TRANSFER PORTS MARKET, BY END USER
- 13.1. Chapter Overview
- 13.2. Assumptions and Methodology
- 13.3. Rapid Transfer Ports Market: Distribution by End User
- 13.3.1. Rapid Transfer Ports Market for Pharmaceutical Companies: Historical Trends (Since 2022) and Forecasted Estimates (Till 2035)
- 13.3.2. Rapid Transfer Ports Market for Contract Manufacturing Organizations: Historical Trends (Since 2022) and Forecasted Estimates (Till 2035)
- 13.4. Data Triangulation and Validation
14. RAPID TRANSFER PORTS MARKET, BY GEOGRAPHICAL REGIONS
- 14.1. Chapter Overview
- 14.2. Assumptions and Methodology
- 14.3. Rapid Transfer Ports Market: Distribution by Geographical Regions
- 14.3.1. Rapid Transfer Ports Market in North America: Historical Trends (Since 2022) and Forecasted Estimates (Till 2035)
- 14.3.2. Rapid Transfer Ports Market in Europe: Historical Trends (Since 2022) and Forecasted Estimates (Till 2035)
- 14.3.3. Rapid Transfer Ports Market in Asia-Pacific: Historical Trends (Since 2022) and Forecasted Estimates (Till 2035)
- 14.3.4. Rapid Transfer Ports Market in Latin America: Historical Trends (Since 2022) and Forecasted Estimates (Till 2035)
- 14.3.5. Rapid Transfer Ports Market in Middle East and North Africa: Historical Trends (Since 2022) and Forecasted Estimates (Till 2035)
- 14.4. Data Triangulation and Validation
15. MARKET OPPORTUNITY ANALYSIS: NORTH AMERICA**
- 15.1. Rapid Transfer Ports Market in North America: Distribution by Type of Beta Solution Offered
- 15.1.1. Rapid Transfer Ports Market in North America for Single Use Beta Bags: Historical Trends (Since 2022) and Forecasted Estimates (Till 2035)
- 15.1.1.1. Rapid Transfer Ports Market in North America for Ready to Use (gamma): Historical Trends (Since 2022) and Forecasted Estimates (Till 2035)
- 15.1.1.2. Rapid Transfer Ports Market in North America for Ready to Sterilize (steam): Historical Trends (Since 2022) and Forecasted Estimates (Till 2035)
- 15.1.2. Rapid Transfer Ports Market in North America for Reusable Beta Containers: Historical Trends (Since 2022) and Forecasted Estimates (Till 2035)
- 15.1.1. Rapid Transfer Ports Market in North America for Single Use Beta Bags: Historical Trends (Since 2022) and Forecasted Estimates (Till 2035)
- 15.2. Rapid Transfer Ports Market in North America: Distribution by Physical State of Transferring Material
- 15.2.1. Rapid Transfer Ports Market in North America for Solid Transfer: Historical Trends (Since 2022) and Forecasted Estimates (Till 2035)
- 15.2.2. Rapid Transfer Ports Market in North America for Liquid Transfer: Historical Trends (Since 2022) and Forecasted Estimates (Till 2035)
- 15.2.3. Rapid Transfer Ports Market in North America for Powder Transfer: Historical Trends (Since 2022) and Forecasted Estimates (Till 2035)
- 15.2.4. Rapid Transfer Ports Market in North America for Others: Historical Trends (Since 2022) and Forecasted Estimates (Till 2035)
- 15.3. Rapid Transfer Ports Market in North America: Distribution by End User
- 15.3.1. Rapid Transfer Ports Market in North America for Pharmaceutical Companies: Historical Trends (Since 2022) and Forecasted Estimates (Till 2035)
- 15.3.2. Rapid Transfer Ports Market in North America for Contract Manufacturing Organizations: Historical Trends (Since 2022) and Forecasted Estimates (Till 2035)
16. MARKET OPPORTUNITY ANALYSIS: EUROPE**
- 16.1. Rapid Transfer Ports Market in Europe: Distribution by Type of Beta Solution Offered
- 16.1.1. Rapid Transfer Ports Market in Europe for Single Use Beta Bags: Historical Trends (Since 2022) and Forecasted Estimates (Till 2035)
- 16.1.1.1. Rapid Transfer Ports Market in Europe for Ready to Use (gamma): Historical Trends (Since 2022) and Forecasted Estimates (Till 2035)
- 16.1.1.2. Rapid Transfer Ports Market in Europe for Ready to Sterilize (steam): Historical Trends (Since 2022) and Forecasted Estimates (Till 2035)
- 16.1.2. Rapid Transfer Ports Market in Europe for Reusable Beta Containers: Historical Trends (Since 2022) and Forecasted Estimates (Till 2035)
- 16.1.1. Rapid Transfer Ports Market in Europe for Single Use Beta Bags: Historical Trends (Since 2022) and Forecasted Estimates (Till 2035)
- 16.2. Rapid Transfer Ports Market in Europe: Distribution by Physical State of Transferring Material
- 16.2.1. Rapid Transfer Ports Market in Europe for Solid Transfer: Historical Trends (Since 2022) and Forecasted Estimates (Till 2035)
- 16.2.2. Rapid Transfer Ports Market in Europe for Liquid Transfer: Historical Trends (Since 2022) and Forecasted Estimates (Till 2035)
- 16.2.3. Rapid Transfer Ports Market in Europe for Powder Transfer: Historical Trends (Since 2022) and Forecasted Estimates (Till 2035)
- 16.2.4. Rapid Transfer Ports Market in Europe for Others: Historical Trends (Since 2022) and Forecasted Estimates (Till 2035)
- 16.3. Rapid Transfer Ports Market in Europe: Distribution by End User
- 16.3.1. Rapid Transfer Ports Market in Europe for Pharmaceutical Companies: Historical Trends (Since 2022) and Forecasted Estimates (Till 2035)
- 16.3.2. Rapid Transfer Ports Market in Europe for Contract Manufacturing Organizations: Historical Trends (Since 2022) and Forecasted Estimates (Till 2035)
17. MARKET OPPORTUNITY ANALYSIS: ASIA-PACIFIC**
- 17.1. Rapid Transfer Ports Market in Asia-Pacific: Distribution by Type of Beta Solution Offered
- 17.1.1. Rapid Transfer Ports Market in Asia-Pacific for Single Use Beta Bags: Historical Trends (Since 2022) and Forecasted Estimates (Till 2035)
- 17.1.1.1. Rapid Transfer Ports Market in Asia-Pacific for Ready to Use (gamma): Historical Trends (Since 2022) and Forecasted Estimates (Till 2035)
- 17.1.1.2. Rapid Transfer Ports Market in Asia-Pacific for Ready to Sterilize (steam): Historical Trends (Since 2022) and Forecasted Estimates (Till 2035)
- 17.1.2. Rapid Transfer Ports Market in Asia-Pacific for Reusable Beta Containers: Historical Trends (Since 2022) and Forecasted Estimates (Till 2035)
- 17.1.1. Rapid Transfer Ports Market in Asia-Pacific for Single Use Beta Bags: Historical Trends (Since 2022) and Forecasted Estimates (Till 2035)
- 17.2. Rapid Transfer Ports Market in Asia-Pacific: Distribution by Physical State of Transferring Material
- 17.2.1. Rapid Transfer Ports Market in Asia-Pacific for Solid Transfer: Historical Trends (Since 2022) and Forecasted Estimates (Till 2035)
- 17.2.2. Rapid Transfer Ports Market in Asia-Pacific for Liquid Transfer: Historical Trends (Since 2022) and Forecasted Estimates (Till 2035)
- 17.2.3. Rapid Transfer Ports Market in Asia-Pacific for Powder Transfer: Historical Trends (Since 2022) and Forecasted Estimates (Till 2035)
- 17.2.4. Rapid Transfer Ports Market in Asia-Pacific for Others: Historical Trends (Since 2022) and Forecasted Estimates (Till 2035)
- 17.3. Rapid Transfer Ports Market in Asia-Pacific: Distribution by End User
- 17.3.1. Rapid Transfer Ports Market in Asia-Pacific for Pharmaceutical Companies: Historical Trends (Since 2022) and Forecasted Estimates (Till 2035)
- 17.3.2. Rapid Transfer Ports Market in Asia-Pacific for Contract Manufacturing Organizations: Historical Trends (Since 2022) and Forecasted Estimates (Till 2035)
18. MARKET OPPORTUNITY ANALYSIS: LATIN AMERICA**
- 18.1. Rapid Transfer Ports Market in Latin America: Distribution by Type of Beta Solution Offered
- 18.1.1. Rapid Transfer Ports Market in Latin America for Single Use Beta Bags: Historical Trends (Since 2022) and Forecasted Estimates (Till 2035)
- 18.1.1.1. Rapid Transfer Ports Market in Latin America for Ready to Use (gamma): Historical Trends (Since 2022) and Forecasted Estimates (Till 2035)
- 18.1.1.2. Rapid Transfer Ports Market in Latin America for Ready to Sterilize (steam): Historical Trends (Since 2022) and Forecasted Estimates (Till 2035)
- 18.1.2. Rapid Transfer Ports Market in Latin America for Reusable Beta Containers: Historical Trends (Since 2022) and Forecasted Estimates (Till 2035)
- 18.1.1. Rapid Transfer Ports Market in Latin America for Single Use Beta Bags: Historical Trends (Since 2022) and Forecasted Estimates (Till 2035)
- 18.2. Rapid Transfer Ports Market in Latin America: Distribution by Physical State of Transferring Material
- 18.2.1. Rapid Transfer Ports Market in Latin America for Solid Transfer: Historical Trends (Since 2022) and Forecasted Estimates (Till 2035)
- 18.2.2. Rapid Transfer Ports Market in Latin America for Liquid Transfer: Historical Trends (Since 2022) and Forecasted Estimates (Till 2035)
- 18.2.3. Rapid Transfer Ports Market in Latin America for Powder Transfer: Historical Trends (Since 2022) and Forecasted Estimates (Till 2035)
- 18.2.4. Rapid Transfer Ports Market in Latin America for Others: Historical Trends (Since 2022) and Forecasted Estimates (Till 2035)
- 18.3. Rapid Transfer Ports Market in Latin America: Distribution by End User
- 18.3.1. Rapid Transfer Ports Market in Latin America for Pharmaceutical Companies: Historical Trends (Since 2022) and Forecasted Estimates (Till 2035)
- 18.3.2. Rapid Transfer Ports Market in Latin America for Contract Manufacturing Organizations: Historical Trends (Since 2022) and Forecasted Estimates (Till 2035)
19. MARKET OPPORTUNITY ANALYSIS: MIDDLE EAST AND NORTH AFRICA**
- 19.1. Rapid Transfer Ports Market in Middle East and North Africa: Distribution by Type of Beta Solution Offered
- 19.1.1. Rapid Transfer Ports Market in Middle East and North Africa for Single Use Beta Bags: Historical Trends (Since 2022) and Forecasted Estimates (Till 2035)
- 19.1.1.1. Rapid Transfer Ports Market in Middle East and North Africa for Ready to Use (gamma): Historical Trends (Since 2022) and Forecasted Estimates (Till 2035)
- 19.1.1.2. Rapid Transfer Ports Market in Middle East and North Africa for Ready to Sterilize (steam): Historical Trends (Since 2022) and Forecasted Estimates (Till 2035)
- 19.1.2. Rapid Transfer Ports Market in Middle East and North Africa for Reusable Beta Containers: Historical Trends (Since 2022) and Forecasted Estimates (Till 2035)
- 19.1.1. Rapid Transfer Ports Market in Middle East and North Africa for Single Use Beta Bags: Historical Trends (Since 2022) and Forecasted Estimates (Till 2035)
- 19.2. Rapid Transfer Ports Market in Middle East and North Africa: Distribution by Physical State of Transferring Material
- 19.2.1. Rapid Transfer Ports Market in Middle East and North Africa for Solid Transfer: Historical Trends (Since 2022) and Forecasted Estimates (Till 2035)
- 19.2.2. Rapid Transfer Ports Market in Middle East and North Africa for Liquid Transfer: Historical Trends (Since 2022) and Forecasted Estimates (Till 2035)
- 19.2.3. Rapid Transfer Ports Market in Middle East and North Africa for Powder Transfer: Historical Trends (Since 2022) and Forecasted Estimates (Till 2035)
- 19.2.4. Rapid Transfer Ports Market in Middle East and North Africa for Others: Historical Trends (Since 2022) and Forecasted Estimates (Till 2035)
- 19.3. Rapid Transfer Ports Market in Middle East and North Africa: Distribution by End User
- 19.3.1. Rapid Transfer Ports Market in Middle East and North Africa for Pharmaceutical Companies: Historical Trends (Since 2022) and Forecasted Estimates (Till 2035)
- 19.3.2. Rapid Transfer Ports Market in Middle East and North Africa for Contract Manufacturing Organizations: Historical Trends (Since 2022) and Forecasted Estimates (Till 2035)
- *Detailed segment-wise distribution across individual regions is available in supporting excel data packs
20. RAPID TRANSFER PORTS MARKET, BY LEADING PLAYERS
- 20.1. Chapter Overview
- 20.2. Key Parameters and Methodology
- 20.3. Leading Rapid Transfer Port Companies
21. CONCLUDING INSIGHTS
22. EXECUTIVE INSIGHTS
23. APPENDIX I: TABULATED DATA
24. APPENDIX II: LIST OF COMPANIES AND ORGANIZATIONS
List of Tables
- Table 7.1 Rapid Transfer Ports: Information on Company, Type of Rapid Transfer Port Component, Mode of Operation of Alpha Ports, Type of Opening for Alpha Ports, Type of Beta Solution Offered and Format of Beta Solution Offered
- Table 7.2 Rapid Transfer Ports: Information on Company, Rapid Transfer Port Diameter, Type of Product Transferred, Physical State of Transferring Material and Type of Rapid Transfer Port Accessories Provided
- Table 7.3 Rapid Transfer Port Companies: Information on Year of Establishment, Location of Headquarters, Company Size
- Table 8.1 List of Partnerships and Collaborations (Since 2020)
- Table 8.2 List of Acquisitions (Since 2020)
- Table 18.1 Rapid Transfer Ports: Distribution by Type of Rapid Transfer Port Component
- Table 18.2 Rapid Transfer Ports: Distribution by Mode of Operation of Alpha Ports
- Table 18.3 Rapid Transfer Ports: Distribution by Type of Opening for Alpha Ports
- Table 18.4 Rapid Transfer Ports: Distribution by Type of Beta Solution Offered
- Table 18.5 Rapid Transfer Ports: Distribution by Format of Beta Solution Offered
- Table 18.6 Rapid Transfer Ports: Distribution by RTP Diameter
- Table 18.7 Rapid Transfer Ports: Distribution by Type of Product Transferred
- Table 18.8 Rapid Transfer Ports: Distribution by Physical State of Transferring Material
- Table 18.9 Rapid Transfer Ports: Distribution by Rapid Transfer Port Accessories Provided
- Table 18.10 Rapid Transfer Port Companies: Distribution by Year of Establishment
- Table 18.11 Rapid Transfer Port Companies: Distribution by Company Size
- Table 18.12 Rapid Transfer Port Companies: Distribution by Location of Headquarters
- Table 18.13 Rapid Transfer Port Companies: Most Active Players
- Table 18.14 Partnerships and Collaborations: Distribution by Year of Agreement
- Table 18.15 Partnerships and Collaborations: Distribution by Type of Agreement
- Table 18.16 Partnerships and Collaborations: Distribution by Year and Type of Agreement
- Table 18.17 Partnerships and Collaborations: Distribution by Type of Rapid Transfer Port System
- Table 18.18 Most Active Players: Analysis by Number of Agreements Inked
- Table 18.19 Partnerships and Collaborations: Distribution by Local and International Agreements
- Table 18.20 Partnerships and Collaborations: Distribution by Intracontinental and Intercontinental Agreements
- Table 18.21 Acquisitions: Analysis by Type of Acquisition
- Table 18.22 Acquisitions: Ownership Change Matrix
- Table 18.23 Acquisitions: Key Value Drivers
- Table 18.24 Global Rapid Transfer Ports Market, till 2035 Historical Trends (since 2022) and Forecasted Estimates (till 2035) (USD Million)
- Table 18.25 Global Rapid Transfer Ports Market, till 2035: Conservative Scenario (USD Million)
- Table 18.26 Global Rapid Transfer Ports Market, till 2035: Optimistic Scenario (USD Million)
- Table 18.27 Rapid Transfer Ports Market: Distribution by Type of Beta Solution Offered
- Table 18.28 Rapid Transfer Ports Market for Single Use Beta Bags: Historical Trends (Since 2022) and Forecasted Estimates (Till 2035)
- Table 18.29 Rapid Transfer Ports Market for Ready to Use (gamma): Historical Trends (Since 2022) and Forecasted Estimates (Till 2035)
- Table 18.30 Rapid Transfer Ports Market for Ready to Sterilize (steam): Historical Trends (since 2022) and Forecasted Estimates (till 2035)
- Table 18.31 Rapid Transfer Ports Market for Reusable Beta Containers: Historical Trends (Since 2022) and Forecasted Estimates (Till 2035)
- Table 18.32 Rapid Transfer Ports Market: Distribution by Physical State of Transferring Material
- Table 18.33 Rapid Transfer Ports Market for Solid Transfer: Historical Trends (since 2022) and Forecasted Estimates (till 2035)
- Table 18.34 Rapid Transfer Ports Market for Liquid Transfer: Historical Trends (since 2022) and Forecasted Estimates (till 2035)
- Table 18.35 Rapid Transfer Ports Market for Powder Transfer: Historical Trends (since 2022) and Forecasted Estimates (till 2035)
- Table 18.36 Rapid Transfer Ports Market for Others: Historical Trends (since 2022) and Forecasted Estimates (till 2035)
- Table 18.37 Rapid Transfer Ports Market: Distribution by End Users
- Table 18.38 Rapid Transfer Ports Market for Pharmaceutical Companies: Historical Trends (since 2022) and Forecasted Estimates (till 2035)
- Table 18.39 Rapid Transfer Ports Market for Contract Manufacturing Organizations: Historical Trends (since 2022) and Forecasted Estimates (till 2035)
- Table 18.40 Rapid Transfer Ports Market: Distribution by Geographical Regions
- Table 18.41 Rapid Transfer Ports Market in North America: Historical Trends (since 2022) and Forecasted Estimates (till 2035)
- Table 18.42 Rapid Transfer Ports Market in Europe: Historical Trends (since 2022) and Forecasted Estimates (till 2035)
- Table 18.43 Rapid Transfer Ports Market in Asia-Pacific: Historical Trends (since 2022) and Forecasted Estimates (till 2035)
- Table 18.44 Rapid Transfer Ports Market in Rest of Middle East and North Africa: Historical Trends (since 2022) and Forecasted Estimates (till 2035)
- Table 18.45 Rapid Transfer Ports Market in Middle East and North Africa: Historical Trends (since 2022) and Forecasted Estimates (till 2035)
List of Figures
- Figure 2.1 Research Methodology: Project Methodology
- Figure 2.2 Research Methodology: Data Sources for Secondary Research
- Figure 2.3 Research Methodology: Robust Quality Control Framework
- Figure 3.1 Market Dynamics: Forecast Methodology
- Figure 3.2 Market Dynamics: Market Assessment Framework
- Figure 3.3 Market Dynamics: Example List of Parameters
- Figure 4.1 Historical Analysis of Past Recessions and Lessons Learnt
- Figure 5.1 Executive Summary: Market Landscape
- Figure 5.2 Executive Summary: Market Trends
- Figure 5.3 Executive Summary: Market Sizing and Opportunity Analysis
- Figure 6.1 Challenges Associated with Rapid Transfer Ports
- Figure 7.1 Rapid Transfer Ports: Distribution by Type of Rapid Transfer Port Component
- Figure 7.2 Rapid Transfer Ports: Distribution by Mode of Operation of Alpha Ports
- Figure 7.3 Rapid Transfer Ports: Distribution by Type of Opening for Alpha Ports
- Figure 7.4 Rapid Transfer Ports: Distribution by Type of Beta Solution Offered
- Figure 7.5 Rapid Transfer Ports: Distribution by Format of Beta Solution Offered
- Figure 7.6 Rapid Transfer Ports: Distribution by Rapid Transfer Port Diameter
- Figure 7.7 Rapid Transfer Ports: Distribution by Type of Product Transferred
- Figure 7.8 Rapid Transfer Ports: Distribution by Physical State of Transferring Material
- Figure 7.9 Rapid Transfer Ports: Distribution by Rapid Transfer Port Accessories Provided
- Figure 7.10 Rapid Transfer Port Companies: Distribution by Year of Establishment
- Figure 7.11 Rapid Transfer Port Companies: Distribution by Company Size
- Figure 7.12 Rapid Transfer Port Companies: Distribution by Location of Headquarters
- Figure 7.13 Rapid Transfer Port Companies: Most Active Players
- Figure 8.1 Rapid Transfer Port Companies offering Alpha Ports: Distribution by Company Size
- Figure 8.2 Rapid Transfer Port Companies offering Alpha Ports: Distribution by Mode of Operation of Alpha Ports
- Figure 8.3 Rapid Transfer Port Companies offering Alpha Ports: Distribution by Physical State of Transferring Material
- Figure 8.4 Rapid Transfer Port Companies offering Beta Components: Distribution by Company Size
- Figure 8.5 Rapid Transfer Port Companies offering Beta Components: Distribution by Mode of Operation of Alpha Ports
- Figure 8.6 Rapid Transfer Port Companies offering Beta Components: Distribution by Physical State of Transferring Material
- Figure 9.1 Partnerships and Collaborations: Distribution by Year of Agreement
- Figure 9.2 Partnerships and Collaborations: Distribution by Type of Agreement
- Figure 9.3 Partnerships and Collaborations: Distribution by Year and Type of Agreement
- Figure 9.4 Partnerships and Collaborations: Distribution by Type of Rapid Transfer Port System
- Figure 9.5 Most Active Players: Analysis by Number of Agreements Inked
- Figure 9.6 Partnerships and Collaborations: Distribution by Local and International Agreements
- Figure 9.7 Partnerships and Collaborations: Distribution by Intracontinental and Intercontinental Agreements
- Figure 9.8 Acquisitions: Analysis by Type of Acquisition
- Figure 9.9 Acquisitions: Ownership Change Matrix
- Figure 9.10 Acquisitions: Key Value Drivers
- Figure 10.1 Global Rapid Transfer Ports Market, till 2035 Historical Trends (since 2022) and Forecasted Estimates (till 2035) (USD Million)
- Figure 10.2 Global Rapid Transfer Ports Market, till 2035: Conservative Scenario (USD Million)
- Figure 10.3 Global Rapid Transfer Ports Market, till 2035: Optimistic Scenario (USD Million)
- Figure 11.1 Rapid Transfer Ports Market: Distribution by Type of Beta Solution Offered
- Figure 11.2 Rapid Transfer Ports Market for Single Use Beta Bags: Historical Trends (Since 2022) and Forecasted Estimates (Till 2035)
- Figure 11.3 Rapid Transfer Ports Market for Ready to Use (gamma): Historical Trends (Since 2022) and Forecasted Estimates (Till 2035)
- Figure 11.4 Rapid Transfer Ports Market for Ready to Sterilize (steam): Historical Trends (since 2022) and Forecasted Estimates (till 2035)
- Figure 11.5 Rapid Transfer Ports Market for Reusable Beta Containers: Historical Trends (Since 2022) and Forecasted Estimates (Till 2035)
- Figure 12.1 Rapid Transfer Ports Market: Distribution by Physical State of Transferring Material
- Figure 12.2 Rapid Transfer Ports Market for Solid Transfer: Historical Trends (since 2022) and Forecasted Estimates (till 2035)
- Figure 12.3 Rapid Transfer Ports Market for Liquid Transfer: Historical Trends (since 2022) and Forecasted Estimates (till 2035)
- Figure 12.4 Rapid Transfer Ports Market for Powder Transfer: Historical Trends (since 2022) and Forecasted Estimates (till 2035)
- Figure 12.5 Rapid Transfer Ports Market for Others: Historical Trends (since 2022) and Forecasted Estimates (till 2035)
- Figure 13.1 Rapid Transfer Ports Market: Distribution by End Users
- Figure 13.2 Rapid Transfer Ports Market for Pharmaceutical Companies: Historical Trends (since 2022) and Forecasted Estimates (till 2035)
- Figure 13.3 Rapid Transfer Ports Market for Contract Manufacturing Organizations: Historical Trends (since 2022) and Forecasted Estimates (till 2035)
- Figure 14.1 Rapid Transfer Ports Market: Distribution by Geographical Regions
- Figure 14.2 Rapid Transfer Ports Market in North America: Historical Trends (since 2022) and Forecasted Estimates (till 2035)
- Figure 14.5 Rapid Transfer Ports Market in Europe: Historical Trends (since 2022) and Forecasted Estimates (till 2035)
- Figure 14.12 Rapid Transfer Ports Market in Asia-Pacific: Historical Trends (since 2022) and Forecasted Estimates (till 2035)
- Figure 14.22 Rapid Transfer Ports Market in Rest of Middle East and North Africa: Historical Trends (since 2022) and Forecasted Estimates (till 2035)
- Figure 14.18 Rapid Transfer Ports Market in Middle East and North Africa: Historical Trends (since 2022) and Forecasted Estimates (till 2035)
 腺結合病毒載體生產市場規模、佔有率和成長分析:按血清型、生產系統、規模、最終用戶和地區分類-2026-2033年產業預測
 安德森-塔維爾症候群市場 - 全球產業規模、佔有率、趨勢、機會、預測:按疾病類型、分銷管道、地區和競爭格局分類,2021-2031年
 基因治療合作與許可協議(2016-2026)
 基因治療市場預測—全球分析(治療方法、載體類型、遞送方法、給藥途徑、治療領域、基因類型、研發階段、應用、最終用戶和地區分類)—2034年
 基因治療市場:按載體類型、治療方法、目標基因組、遞送方法、給藥途徑、患者群體、治療領域和最終用戶分類-全球市場預測(2026-2032 年)
 AAV基因治療市場:按載體血清型、治療領域、目標組織、適應症、基因有效載荷、開發階段、生產方法、最終用戶和地區分類。GMP蛋白(大腸桿菌)契約製造市場:按產品類型、應用、生產方法、最終用戶和地區分類
 全球基因治療市場規模、佔有率、趨勢和成長分析報告(2026-2034)GMP級細胞培養基市場:依產品類型、成分、劑型、細胞類型及應用分類-2026-2032年全球預測GMP生物製品市場:依產品類型、應用、服務、生產規模、最終用戶、國家及地區分類-全球產業分析、市場規模、市場佔有率及2025年至2032年預測