


 |
市場調查報告書
商品編碼
2055606
癌症生物標記市場(第三版):依生物標記類型、癌症類型和地區分類-趨勢與預測至2035年Cancer Biomarkers Market (3rd Edition) by Type of Biomarker, Type of Cancer and Geographical Regions - Trends and Forecasts Till 2035 |
||||||
癌症生物標記市場概覽
預計到 2035 年,全球癌症生物標記市場規模將以 4.3% 的年複合成長率成長,從目前的 259 億美元成長到 378 億美元。
癌症生物標記市場:成長與趨勢
過去二十年來,研究人員和生物製藥公司推出了許多先進且高效的癌症治療方法,包括標靶治療、免疫療法和治療性癌症疫苗。儘管取得了這些進展,腫瘤學研究仍面臨著許多挑戰,例如全身性治療相關毒性、臨床試驗的高脫落率以及各種藥物和治療方法本身的限制。這些持續存在的挑戰凸顯了對更準確、更可靠的診斷框架的迫切需求,這些框架能夠在改善患者預後的同時,最大限度地減少治療失敗的經濟損失。
為了滿足這項亟待解決的關鍵需求,醫療產業正日益將癌症生物標記作為現代腫瘤診斷的基礎。生物標記的需求主要源自於癌症的分子異質性。即使是確診為相同類型和分期癌症的患者,也常常表現出不同的分子和基因特徵,導致對重組藥物和生物製藥的反應有差異。為此,製藥研發人員和醫療服務提供者正日益轉向精準腫瘤學方法。透過識別疾病特異性的分子特徵,臨床醫生現在可以超越傳統的「統一」治療模式,為每位患者制定個人化的治療策略。
儘管PD-L1、BRAF和EGFR等單一標靶生物標記在腫瘤診斷中仍發揮基礎作用,但由於基因組環境複雜且對長期治療結果的預測能力有限,它們的預測能力往往受到限制。因此,高通量技術,特別是次世代定序(NGS)的進步,促進了更全面的生物標記的開發和檢驗,包括腫瘤突變負荷(TMB)和微衛星不穩定性(MSI)。這些先進的生物標記有助於更深入地了解基因組不穩定性以及腫瘤生物學,從而實現更精準的患者分層和治療方法選擇。
臨床檢驗生物標記研發管線的不斷擴充仍是市場成長的主要驅動力。在領先的製藥和生物技術公司對多組體學和精準醫療的大量投資支持下,癌症生物標記市場預計將大幅擴張,而數據驅動的診斷整合有望重新定義未來癌症治療的標準。
成長促進因素-市場擴張的策略促進因素
全球癌症負擔日益加重,其主要促進因素包括人口老化、生活方式改變以及環境風險因素暴露的增加,這持續加速了對先進腫瘤診斷和標靶治療方法的需求。為了應對不斷上升的疾病盛行率,醫療產業正經歷著向「精準腫瘤學」和「個人化醫療」的重大轉變,即根據個別腫瘤的生物學特徵和分子譜來制定治療策略。這項轉變主要得益於次世代定序(NGS)、液態生物檢體平台、多體學技術、生物資訊學以及人工智慧(AI)驅動的診斷技術的快速發展,所有這些技術都在簡化生物標記的發現、檢驗和臨床應用流程。
這些創新使臨床醫生能夠識別患者特異性的分子特徵,從而改善治療方法方案,降低治療毒性,並提高多種癌症適應症的存活率。領先的製藥和生物技術公司,包括羅氏和諾華,對生物標記主導的臨床試驗和伴隨診斷開發進行大力投資,以支持靶向免疫腫瘤療法,這進一步推動了市場擴張。同時,伴隨診斷核准數量的增加和免疫療法適應症的不斷擴大,也鞏固了市場的上升趨勢,使癌症生物標記成為下一代癌症治療的關鍵組成部分。
市場挑戰-阻礙進展的主要障礙
儘管癌症生物標記市場具有強勁的成長潛力,但仍存在許多營運、技術和監管方面的挑戰,阻礙其廣泛應用和商業化。其中一個主要障礙是生物標記研發成本高且耗時漫長。企業在進入臨床應用之前,必須投入大量資金用於發現、檢驗和監管核准流程。這些財務和營運負擔限制了市場准入,尤其對於中小型生物技術公司而言,同時也延緩了創新診斷解決方案的推廣應用。此外,與檢體採集、處理和儲存相關的技術限制仍然是需要重點關注的問題。處理不當會導致生物標記劣化、污染和檢測結果不一致,最終影響診斷準確性,降低基於生物標記的檢測的臨床可信度。
此外,由於許多新興生物標記尚未在不同患者群體中展現出一致的臨床效用,市場面臨大規模臨床檢驗有限和缺乏標準化數據框架等挑戰。不同檢查室在檢測方法、報告標準和數據格式方面的差異,進一步加劇了數據整合、比較分析以及在腫瘤臨床實踐中常規應用的複雜性。此外,生物標記診斷和伴隨檢測的監管環境瞬息萬變且區域差異顯著,由美國食品藥物管理局(FDA) 和歐洲藥品管理局 (EMA) 等機構監管,這持續給市場參與企業帶來不確定性。這導致合規要求增加、核准時間延長以及整體商業化成本上升。
癌症生物標記市場:關鍵洞察
本報告詳細分析了癌症生物標記市場的現狀,並指出了該行業潛在的成長機會。報告的主要發現包括:
- 生物技術的進步已經發現了許多癌症生物標記檢測方法,這些方法現在被用於各種用途,包括診斷、臨床研究和支持治療決策。
- 目前市面上有超過 290 種生物標記解決方案,其中約 85% 採用次世代定序(NGS) 來評估癌症生物標記。
- 大多數癌症生物標記檢測解決方案(68%)支持插入缺失評估,85%的檢測解決方案利用次世代定序(NGS)進行癌症生物標記評估。
- 多個行業和非相關人員相關人員生物標記分層臨床試驗,以開發新的標靶治療,其中大多數患者在中國的多個地點入組。
- 在癌症生物標記領域,研究顯著增加,已有超過 470 篇論文由不同的研究人員發表,證實了許多相關人員和學術相關人員對該領域日益成長的興趣。
- 預計癌症生物標記市場在預測期內將以4.3%的年均成長率成長。其中,乳癌生物標記檢測解決方案預計將佔據當前市場佔有率的很大一部分。
- 受美國個人化醫療日益普及的推動,癌症生物標記市場預計在預測期內將以較高的年複合成長率成長。
- 鑑於癌症發病率不斷上升,以及臨床和研究領域對基於生物標記的準確診斷的需求不斷成長,癌症生物標記市場預計將穩步成長。
癌症生物標記市場
市場規模和機會分析是根據以下參數進行細分的:
依生物標誌類型
- HER2
- MET
- EGFR
- PD-L1
- NTRK
- ALK
- 其他生物標記
按類型分類的癌症
- 乳癌
- 結腸癌
- 肺癌
- 攝護腺癌
- 甲狀腺癌
- 膀胱癌
- 惡性黑色素瘤
- 非何傑金氏淋巴瘤
- 子宮內膜癌
- 腎癌
- 白血病
按地區
- 北美洲
- 北美洲
- 亞太地區
- 拉丁美洲
- 中東和北非
癌症生物標記市場:主要細分市場
在癌症生物標記市場中,哪種類型的生物標記檢測佔據最大的市場佔有率?
今年,HER2生物標記檢測解決方案預計將佔據癌症生物標記市場最大佔有率(21.1%)。這一主導地位主要歸功於HER2檢測在乳癌和胃癌的診斷、預後和治療管理方面已得到廣泛的臨床檢驗。此外,該細分市場的強勁地位也因其與多種高價值標靶治療(包括曲妥珠單抗和Pertuzumab珠單抗)的直接關聯而進一步鞏固,這些療法持續推動著全球對基於HER2的伴隨診斷的需求。
相較之下,EGFR生物標記檢測領域預計在預測期內將呈現相對快速的成長。這一成長主要受全球肺癌發病率上升以及精準腫瘤學和標靶治療方法日益普及的推動。特別是,Osimertinib等EGFR抑制劑的臨床應用不斷擴大,顯著提升了對EGFR突變檢測的需求,以支持非小細胞肺癌(NSCLC)患者的分層和治療方法選擇。
區域分析:癌症生物標記檢測領域中成長最快的地區是哪一個?
北美:引領全球市場
預計北美將成為癌症生物標記市場的主要驅動力,今年將佔全球市場總收入的52.1%。該地區的主導地位歸功於癌症發病率的上升、完善的醫療基礎設施以及個性化醫療和精準腫瘤學框架的日益普及。此外,對生物標記研究的大力投入、先進診斷技術的廣泛應用以及有利的法規環境和保險報銷環境,也持續推動全部區域的市場成長。
哪種癌症的市佔率最高?
目前的市場估算和預測表明,乳癌生物標記檢測預計將佔據癌症生物標記市場總收入的最大佔有率(25.1%)。這主要是由於乳癌在全球範圍內的高發生率,而乳癌是女性癌症相關死亡的主要原因之一。因此,對支持早期檢測、預後評估、風險分層和個人化治療的基於生物標記的診斷方法的需求日益成長。
黑色素瘤生物標記檢測領域預計將以相對快速的速度成長,預測期內年複合成長率 (CAGR) 為 4.5%。這一成長主要受全球黑色素瘤發病率上升、標靶治療的持續進步以及精準診斷方法的廣泛應用所驅動。特別是,BRAF 和 MEK 抑制劑的臨床應用,以及 BRAF 突變檢測和基於液態生物檢體的生物標記檢測的日益普及,預計將顯著推動該領域的成長。
癌症生物標記市場主要公司範例
- ARUP Laboratories
- Asper Biogene
- BioReference
- Caris Life Sciences
- CeGaT
- Foundation Medicine
- Genekor Medical
- Guardant Health
- IQVIA Laborateries
- Labcorp
- MedGenome
- NeoGenomics Laboratories
- Nonacus
- OncoDNA
- Quest Diagnostics
- Oxford Gene Technology
- Personal Genome Diagnostics
- PhenoPath
- Positive Biosciences
- Tempus
- Thermo Fisher Scientific
- YuceBio
第一次調查總結
本研究中提出的觀點和見解是基於與多位相關人員的討論。本研究報告包含與以下產業相關人員的詳細訪談記錄:
- 技術長(CTO),曾任美國小型企業的臨床前開發和策略合作總監。
- 德國一家中型公司的業務經理。
- 美國某大型企業的前首席科學官
癌症生物標記市場:研究範圍
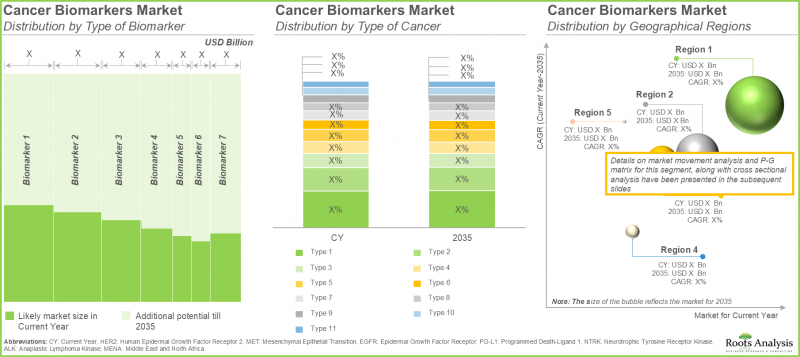
- 市場規模和機會分析:本報告對癌症生物標記市場進行了詳細分析,重點關注關鍵市場細分,例如 [A] 生物標記類型、[B] 癌症類型和 [C] 地區。
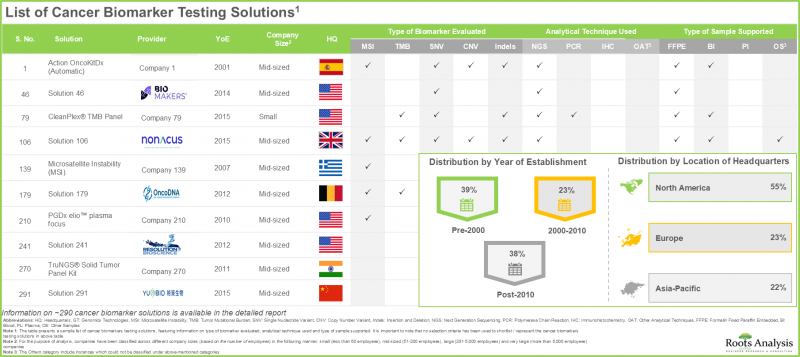
- 市場概覽:本報告對新型癌症生物標記檢測解決方案進行了全面評估,評估考慮了以下多個參數:[A]待評估的生物標記類型,[B]所採用的分析方法類型,[C]報告結果所需時間,[D]可檢測的樣本類型,[E]待檢測的核酸類型,[F]癌症核酸類型,[G]應用領域,以及[H]最終用戶。此外,除了提供參與新型癌症生物標記檢測解決方案開發的公司的詳細名單外,本分析還基於以下多個參數:[I]公司成立年份,[J]公司規模(基於員工人數),以及[K]總部所在地。
- 產品競爭分析:這是一項針對新型癌症生物標記檢測解決方案的全面競爭分析,檢驗了產品多功能性和競爭力等因素。
- 公司簡介:提供新型癌症生物標記檢測解決方案的領先公司的詳細介紹。這些簡介重點在於[A]公司概況、[B]財務資訊、[C]癌症生物標記檢測解決方案組合、[D]近期發展以及[E]未來展望。
- 案例研究:本文對旨在評估腫瘤疾病治療的基於生物標記的臨床試驗的創新試驗設計進行了總體探討。內容包括每種試驗設計的詳細結構訊息,並重點介紹了它們各自的優勢和挑戰。
- 臨床試驗分析:我們將根據以下參數審查已完成、正在進行和計劃中的各種新型癌症生物標記的臨床試驗:[A] 試驗註冊年份,[B] 試驗實驗狀況,[C] 試驗階段,[D] 入組患者人數,[E] 申辦方/合作類型,[F] 最活躍的公司(基於註冊試驗的數量),[G]檢驗
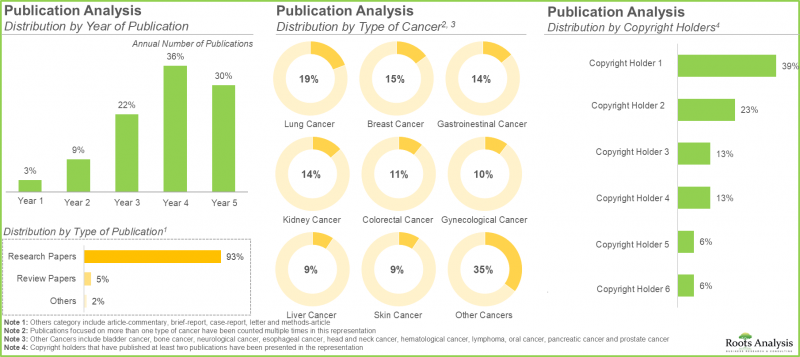
- 文獻分析:對超過 630 篇已發表文章的詳細分析,突顯了與新型癌症生物標記相關的當前研究的關鍵領域。該分析揭示了基於以下幾個方面的總體趨勢:[A] 發表年份,[B] 發表類型,[C] 癌症類型,[D] 版權所有者,[E] 新的研究領域,[F] 最活躍的出版商(基於發表文章數量),以及 [G] 領先的學術期刊(基於日誌影響因子和文章數量)。
- 大型製藥企業分析:這是一項針對主要製藥公司正在實施的各項癌症生物標記相關措施的全面調查。該分析包括一張熱圖,顯示了主要製藥公司的分佈情況,以及一張蜘蛛網圖,比較了每家公司在多個相關參數方面的努力。
- 案例研究1 - 伴隨診斷產業的價值鏈分析:這是一項全面的價值鏈分析,探討了伴隨診斷生產過程中涉及的各個階段。這包括研發、產品臨床評估、生產和組裝、與支付方的談判以及行銷活動,以及上述每個階段的成本分配考量。
- 案例研究2 - 未來成長機會:本案例研究詳細討論了可能影響癌症生物標記檢測解決方案供應商在短期、中期和中長期市場發展的即將到來的機會。
- 市場影響分析:本報告分析了影響市場成長的各種因素,包括促進因素、限制因素、機會和挑戰。
目錄
第1章:序言
第2章:調查方法
第3章 經濟及其他項目特定考量因素
第4章 宏觀經濟指標
第5章執行摘要
- 癌症生物標記檢測解決方案:市場概覽
- 癌症生物標記檢測解決方案:市場趨勢
- 癌症生物標記檢測解決方案:市場預測與機會分析
第6章:引言
- 章節概要
- 癌症生物標記概述
- 癌症生物標記的需求
- 候選生物標記的鑑定
- 癌症生物標記類型
- 新型癌症生物標記
- 腫瘤突變負荷(TMB)
- 微衛星不穩定性/錯配修復缺陷(MSI/MMR)
- 單核苷酸多態性(SNV)
- 拷貝數變異(CNV)
- 插入缺失和其他新型生物標記
- 未來展望
第7章 市場狀況
- 章節概要
- 癌症生物標記檢測解決方案:市場概覽
- 癌症生物標記檢測解決方案:供應商現狀
第8章:產品競爭力分析
- 章節概要
- 前提條件/關鍵參數
- 調查方法
- Peer Group概覽
- 癌症生物標記檢測解決方案:產品競爭力分析
第9章 公司簡介:癌症生物標記檢測解決方案供應商
- 章節概要
- Agilent
- ARUP Laboratories
- Asper Biogene
- BioReference
- Caris Life Sciences
- CeGaT
- Foundation Medicine
- Genekor Medical
- Guardant Health
- IQVIA Laboratories
- Labcorp
- MedGenome
- NeoGenomics Laboratories
- Nonacus
- OncoDNA
- Quest Diagnostics
- Oxford Gene Technology
- Personal Genome Diagnostics
- PhenoPath
- Positive Biosciences
- Tempus AI
- Thermo Fisher Scientific
- YuceBio
第10章:基於生物標記的臨床試驗的創新研究設計
- 章節概要
- 基於生物標記的臨床試驗的研究設計
- 基於生物標記的臨床試驗設計監管指南
- 結論
第11章:臨床試驗分析
第12章:出版品分析
第13章:大型製藥企業:基準分析
第14章案例研究:伴隨診斷產業價值鏈分析
第15章案例研究:癌症生物標記產業的未來成長機會
第16章:全球癌症生物標記市場
第17章:癌症生物標記市場(依生物標記類型分類)
第18章:癌症生物標記市場(依癌症類型分類)
第19章:癌症生物標記市場(按地區分類)
第20章 結論
第21章:高階主管洞察
第22章附錄1:表格形式數據
第23章 附錄2:公司與組織列表
Cancer Biomarkers Market: Overview
As per Roots Analysis, the global cancer biomarkers market is estimated to grow from USD 25.9 billion in the current year to USD 37.8 billion by 2035, at a CAGR of 4.3% during the forecast period, till 2035.
Cancer Biomarkers Market: Growth and Trends
Over the past two decades, researchers and biopharmaceutical companies have introduced several advanced and highly effective cancer treatment modalities, including targeted therapies, immunotherapies, and therapeutic cancer vaccines. Despite these advancements, oncology research continues to encounter significant challenges, including systemic treatment-related toxicities, high clinical trial attrition rates, and various pharmacological and therapy-specific limitations. These persistent challenges underscore the growing need for more precise and reliable diagnostic frameworks capable of improving patient outcomes while minimizing the economic impact associated with therapeutic failure.
To address this critical unmet need, the healthcare industry has increasingly adopted cancer biomarkers as a cornerstone of modern oncology diagnostics. The demand for such biomarkers is primarily driven by the molecular heterogeneity of cancer, wherein patients diagnosed with the same cancer type and disease stage often exhibit distinct molecular and genetic profiles, resulting in variable responses to recombinant drugs and biologic therapies. In response, pharmaceutical developers and healthcare providers have progressively shifted toward precision oncology approaches. Through the identification of disease-specific molecular signatures, clinicians are now able to customize treatment strategies for individual patients, moving beyond the conventional "one-size-fits-all" therapeutic model.
Although single-analyte biomarkers, such as PD-L1, BRAF, and EGFR, continue to play a foundational role in oncology diagnostics, their predictive capabilities are often limited in the context of complex genomic landscapes and long-term treatment efficacy. As a result, advancements in high-throughput technologies, particularly next-generation sequencing (NGS), have facilitated the development and validation of more comprehensive biomarkers, including tumor mutational burden (TMB) and microsatellite instability (MSI). These advanced biomarkers offer deeper understanding of genomic instability and tumor biology, enabling more precise patient stratification and treatment selection.
The expanding pipeline of clinically validated biomarkers remains a key driver of market growth. Supported by substantial investments from leading pharmaceutical and biotechnology companies in multi-omics and precision medicine initiatives, the cancer biomarkers market is positioned for significant expansion, with data-driven diagnostic integration expected to redefine the future standard of oncology care.
Growth Drivers: Strategic Enablers of Market Expansion
The growing global burden of cancer, driven by aging populations, changing lifestyles, and increasing exposure to environmental risk factors, continues to accelerate the demand for advanced oncology diagnostics and targeted treatment approaches. In response to this rising disease prevalence, the healthcare industry is witnessing a significant shift toward precision oncology and personalized medicine, wherein treatment decisions are increasingly guided by individual tumor biology and molecular profiling. This transition has been strongly supported by rapid technological advancements in next-generation sequencing (NGS), liquid biopsy platforms, multi-omics technologies, bioinformatics, and artificial intelligence-enabled diagnostics, all of which have streamlined biomarker discovery, validation, and clinical implementation.
These innovations enable clinicians to identify patient-specific molecular signatures, improving therapeutic selection, reducing treatment-related toxicities, and enhancing survival outcomes across multiple cancer indications. Further strengthening market expansion, leading pharmaceutical and biotechnology companies, including Roche and Novartis, are actively investing in biomarker-driven clinical trials and companion diagnostic development to support targeted immuno-oncology therapies. In parallel, increasing regulatory approvals for companion diagnostics and expanded indications for immunotherapies are reinforcing the market's upward trajectory, positioning cancer biomarkers as a critical component of next-generation oncology care.
Market Challenges: Critical Barriers Impeding Progress
Despite the strong growth potential of the cancer biomarkers market, several operational, technical, and regulatory challenges continue to hinder widespread adoption and commercialization. One of the primary barriers is the high cost and extended timeline associated with biomarker research and development, as companies are required to invest substantial capital in discovery, validation, and regulatory approval processes before achieving clinical adoption. These financial and operational demands often restrict market participation, particularly among small and mid-sized biotechnology firms, while simultaneously delaying the introduction of innovative diagnostic solutions. In addition, technical limitations associated with sample collection, handling, and storage remain a significant concern. Improper processing can result in biomarker degradation, contamination, and inconsistent test results, ultimately compromising diagnostic accuracy and reducing clinical confidence in biomarker-based assays.
The market also faces challenges associated with limited large-scale clinical validation and the absence of standardized data frameworks, as many emerging biomarkers are yet to demonstrate consistent clinical utility across diverse patient populations. Variability in assay methodologies, reporting standards, and data formats across laboratories further complicates data integration, comparative analyses, and routine implementation in oncology practice. Moreover, the evolving and region-specific regulatory landscape for biomarker-based diagnostics and companion tests, overseen by agencies such as the U.S. Food and Drug Administration and the European Medicines Agency, continues to create uncertainty for market participants. It increases compliance requirements, prolongs approval timelines, and raises overall commercialization costs.
Cancer Biomarkers Market: Key Insights
The report delves into the current state of the cancer biomarkers market and identifies potential growth opportunities within industry. Some key findings from the report include:
- Advancements in biotechnology have led to the identification of several cancer biomarker testing solutions, which are presently being used for a variety of purposes, including diagnosis, clinical research and to facilitate therapy-related decision-making.
- Currently, more than 290 biomarker solutions are available in the market; around 85% of these solutions use next generation sequencing for the assessment of cancer biomarkers.
- Majority (68%) of the cancer biomarker testing solutions assist in the evaluation of indels; 85% of the testing solutions utilize next generation sequencing (NGS) for the assessment of cancer biomarkers.
- Several industry and non-industry players are conducting biomarker-stratified clinical trials to develop new targeted therapies; most of the patients were enrolled across multiple sites in China.
- The field of cancer biomarkers has seen a significant rise in research, with over 470 articles published by various researchers, underscoring the growing focus of several industry players and academic players in this domain.
- The cancer biomarkers market is expected to witness an annualized growth rate of 4.3% during the forecast period; notably, biomarker testing solutions for breast cancer are expected to capture the majority current market share.
- Driven by the growing adoption of personalized medicine in the US, the cancer biomarkers market is poised to grow at a higher CAGR during the forecast period.
- Given the rising prevalence of cancer, and the intensifying demand for precise, biomarker-driven diagnostics across clinical and research settings, the cancer biomarkers market is positioned for steady growth.
Cancer Biomarkers Market
The market sizing and opportunity analysis has been segmented across the following parameters:
By Type of Biomarker
- HER2
- MET
- EGFR
- PD-L1
- NTRK
- ALK
- Other Biomarkers
By Type of Cancer
- Breast Cancer
- Colorectum Cancer
- Lung Cancer
- Prostate Cancer
- Thyroid Cancer
- Bladder Cancer
- Melanoma
- Non-Hodgkin Lymphoma
- Endometrial Cancer
- Kidney Cancer
- Leukemia
By Geographical Regions
- North America
- Europe
- Asia-Pacific
- Latin America
- Middle East and North Africa
Cancer Biomarkers Market: Key Segments
Which Type of Biomarker Testing Accounts for the Largest Share in the Cancer Biomarkers Market?
In the current year, HER2 biomarker testing solutions are expected to account for the largest share (21.1%) of the cancer biomarkers market. This dominance is primarily attributed to the extensive clinical validation of HER2 testing in the diagnosis, prognosis, and therapeutic management of breast and gastric cancers. The segment's strong market position is further reinforced by its direct association with several high-value targeted therapies, including Trastuzumab and Pertuzumab, which continue to drive sustained global demand for HER2-based companion diagnostics.
In contrast, the EGFR biomarker testing segment is anticipated to witness comparatively faster growth during the forecast period. This growth is primarily driven by the increasing global prevalence of lung cancer, along with the rising adoption of precision oncology and targeted treatment approaches. In particular, the growing clinical utilization of EGFR inhibitors, such as Osimertinib, has significantly increased the demand for EGFR mutation testing to support patient stratification and treatment selection in non-small cell lung cancer (NSCLC).
Regional Analysis: Which Regions are Showing the Fastest Growth in the Cancer Biomarkers Testing Domain?
North America: Leading the Global Market
North America is expected to dominate the cancer biomarkers market, capturing 52.1% of the overall market revenue in the current year. The region's leadership position can be attributed to the rising burden of cancer, well-established healthcare infrastructure, and the increasing adoption of personalized medicine and precision oncology frameworks. In addition, strong investments in biomarker research, widespread availability of advanced diagnostic technologies, and favorable regulatory and reimbursement environments continue to support market growth across the region.
Which Type of Cancer Holds the Highest Share in the Market?
According to current market estimates, biomarker tests for breast cancer are projected to account for the largest share (25.1%) of the overall cancer biomarkers market revenue. This can be attributed to the high global prevalence of breast cancer as one of the leading causes of cancer-related mortality among women. As a result, there is significant demand for biomarker-driven diagnostics that support early detection, prognosis assessment, risk stratification, and personalized therapeutic interventions.
Looking ahead, the melanoma biomarker testing segment is anticipated to grow at a relatively faster pace, with a projected CAGR of 4.5% during the forecast period. This growth is primarily driven by the increasing global incidence of melanoma, continued advancements in targeted therapies, and the growing adoption of precision diagnostic approaches. In particular, the clinical uptake of BRAF and MEK inhibitors, alongside rising utilization of BRAF mutation testing and liquid biopsy-based biomarker assays, is expected to significantly contribute to segment expansion.
Example Players in Cancer Biomarkers Market
- ARUP Laboratories
- Asper Biogene
- BioReference
- Caris Life Sciences
- CeGaT
- Foundation Medicine
- Genekor Medical
- Guardant Health
- IQVIA Laborateries
- Labcorp
- MedGenome
- NeoGenomics Laboratories
- Nonacus
- OncoDNA
- Quest Diagnostics
- Oxford Gene Technology
- Personal Genome Diagnostics
- PhenoPath
- Positive Biosciences
- Tempus
- Thermo Fisher Scientific
- YuceBio
Primary Research Overview
The opinions and insights presented in this study were influenced by discussions conducted with multiple stakeholders. The research report features detailed transcripts of interviews held with the following industry stakeholders:
- Chief Technical Officer and Former Director of Preclinical Development & Strategic Partnerships, Small Company, US
- Business Manager, Mid-sized Company, Germany
- Former Chief Scientific Officer, Large Company, US
Cancer Biomarkers Market: Research Coverage
- Market Sizing and Opportunity Analysis: The report features an in-depth analysis of the cancer biomarkers market, focusing on key market segments, including [A] type of biomarker, [B] type of cancer and [C] geographical regions.
- Market Landscape: A comprehensive evaluation of testing solutions for novel cancer biomarkers, considering various parameters, such as [A] type of biomarker evaluated, [B] type of analytical technique used, [C] turnaround time, [D] type of sample supported, [E] type of nucleic acid tested, [F] type of cancer, [G] application area and [H] End-user. Additionally, it includes a detailed list of developers engaged in offering novel cancer biomarker testing solutions, along with analysis based on various parameters, such as [I] year of establishment, [J] company size (in terms of employee count) and [K] location of headquarters.
- Product Competitiveness Analysis: A comprehensive competitive analysis of novel cancer biomarker testing solutions, examining factors, such as product versatility and product competitiveness.
- Company Profiles: In-depth profiles of key industry players offering novel cancer biomarker testing solutions, focusing on [A] company overviews, [B] financial information, [C] cancer biomarker testing solutions portfolio, [D] recent developments and [E] an informed future outlook.
- Case Study: A general discussion on the innovative study designs involved in conducting biomarker-based clinical trial to evaluate drugs for oncological disorders. It includes details on the structure of each study design, highlighting their respective advantages and challenges.
- Clinical Trial Analysis: Examination of completed, ongoing, and planned clinical studies of various novel cancer biomarkers based on parameters like [A] trial registration year, [B] trial status, [C] trial phase, [D] enrolled patient population, [E] type of sponsor / collaborator, [F] most active players (in terms of number of registered trials), [G] study design, [H] target therapeutic area and [I] key geographical regions.
- Publication Analysis: A detailed publication analysis of over 630 articles that have been published highlighting the key focus areas of ongoing research related to novel cancer biomarkers. It highlights the prevalent trends based on the [A] year of publication, [B] type of publication, [C] type of cancer, [D] copyright holders, [E] emerging focus areas, [F] most active publishers (in terms of number of publications) and [G] key journals (in terms of journal impact factor and number of articles published).
- Big Pharma Analysis: A comprehensive examination of various initiatives focused on cancer biomarkers undertaken by major pharmaceutical companies. This analysis includes heat map visualizations that illustrate the distribution of leading pharmaceutical firms, as well as spider web diagrams that compare their initiatives across multiple relevant parameters.
- Case Study 1 - Analysis Of Value Chain in the Companion Diagnostics Industry: A comprehensive value chain analysis that explores the various stages involved in the production of companion diagnostics. This includes a discussion on research and development (R&D), clinical assessment of the product, manufacturing and assembly, payer negotiation and marketing activities and the cost distribution across each of the aforementioned stages.
- Case Study 2 - Future Growth Opportunities: A detailed discussion on the upcoming opportunities for cancer biomarker testing solution providers in this field that are likely to impact on the evolution of the market in the short to mid-term and mid to long-term.
- Market Impact Analysis: The report analyzes various factors such as drivers, restraints, opportunities, and challenges affecting the market growth.
Key Questions Answered in this Report
- Which are the leading companies in the cancer biomarkers market?
- Which region dominates the cancer biomarkers market?
- What are the key trends observed in the cancer biomarkers market?
- What factors are likely to influence the evolution of this market?
- What are the primary challenges faced by cancer biomarkers testing solution providers?
- What is the current and future market size?
- What is the CAGR of this market?
- How is the current and future market opportunity likely to be distributed across key market segments?
Reasons to Buy this Report
- The report provides a comprehensive market analysis, offering detailed revenue projections of the overall market and its specific sub-segments. This information is valuable to both established market leaders and emerging entrants.
- The report offers stakeholders a comprehensive overview of the market, including key drivers, barriers, opportunities, and challenges. This information empowers stakeholders to stay abreast of market trends and make data-driven decisions to capitalize on growth prospects.
- The report can aid businesses in identifying future opportunities in any sector. It also helps in understanding if those opportunities are worth pursuing.
- The report helps in identifying customer demand by understanding the needs, preferences, and behavior of the target audience in order to tailor products or services effectively.
- The report equips new entrants with requisite information regarding a particular market to help them build successful business strategies.
- The report allows for more effective communication with the audience and in building strong business relations.
Additional Benefits
- Complementary PPT Insights Pack
- Complementary Excel Data Packs for all Analytical Modules in the Report
- 15% Free Content Customization
- Detailed Report Walkthrough Session with Research Team
- Free Updated report if the report is 6-12 months old or older
TABLE OF CONTENTS
1. PREFACE
- 1.1. Introduction
- 1.2. Report Coverage
- 1.3. Market Segmentation
- 1.4. Key Market Insights
- 1.5. Market Share Insights
- 1.6. Key Questions Answered
2. RESEARCH METHODOLOGY
- 2.1. Chapter Overview
- 2.2. Research Assumptions
- 2.2.1. Market Landscape and Market Trends
- 2.2.2. Market Forecast and Opportunity Analysis
- 2.2.3. Comparative Analysis
- 2.3. Database Building
- 2.3.1. Data Collection
- 2.3.2. Data Validation
- 2.3.3. Data Analysis
- 2.4. Project Methodology
- 2.4.1. Secondary Research
- 2.4.1.1. Annual Reports
- 2.4.1.2. Academic Research Papers
- 2.4.1.3. Company Websites
- 2.4.1.4. Investor Presentations
- 2.4.1.5. Regulatory Filings
- 2.4.1.6. White Papers
- 2.4.1.7. Industry Publications
- 2.4.1.8. Conferences and Seminars
- 2.4.1.9. Government Portals
- 2.4.1.10. Media and Press Releases
- 2.4.1.11. Newsletters
- 2.4.1.12. Industry Databases
- 2.4.1.13. Roots Proprietary Databases
- 2.4.1.14. Paid Databases and Sources
- 2.4.1.15. Social Media Portals
- 2.4.1.16. Other Secondary Sources
- 2.4.2. Primary Research
- 2.4.2.1. Types of Primary Research
- 2.4.2.1.1. Qualitative Research
- 2.4.2.1.2. Quantitative Research
- 2.4.2.1.3. Hybrid Approach
- 2.4.2.2. Advantages of Primary
- 2.4.2.3. Techniques for Primary Research
- 2.4.2.3. Techniques for Primary Research
- 2.4.2.3.1. Interviews
- 2.4.2.3.2. Surveys
- 2.4.2.3.3. Focus Groups
- 2.4.2.3.4. Observational Research
- 2.4.2.3.5. Social Media Interactions
- 2.4.2.4. Key Opinion Leaders Considered in Primary Research
- 2.4.2.4.1. Company Executives (CXOs)
- 2.4.2.4.2. Board of Directors
- 2.4.2.4.3. Company Presidents and Vice Presidents
- 2.4.2.4.4. Research and Development Heads
- 2.4.2.4.5. Technical Experts
- 2.4.2.4.6. Subject Matter Experts
- 2.4.2.4.7. Scientists
- 2.4.2.4.8. Doctors and Other Healthcare Providers
- 2.4.2.5. Ethics and Integrity
- 2.4.2.5.1. Research Ethics
- 2.4.2.5.2. Data Integrity
- 2.4.2.1. Types of Primary Research
- 2.4.3. Analytical Tools and Databases
- 2.4.1. Secondary Research
- 2.5. Robust Quality Control
3. ECONOMIC AND OTHER PROJECT-SPECIFIC CONSIDERATIONS
- 3.1. Chapter Overview
- 3.2. Forecast Methodology
- 3.2.1. Top-down Approach
- 3.2.2. Bottom-up Approach
- 3.2.3. Hybrid Approach
- 3.3. Market Assessment Framework
- 3.3.1. Total Addressable Market (TAM)
- 3.3.2. Serviceable Addressable Market (SAM)
- 3.3.3. Serviceable Obtainable Market (SOM)
- 3.3.4. Currently Acquired Market (CAM)
- 3.4. Forecasting Tools and Techniques
- 3.4.1. Qualitative Forecasting
- 3.4.2. Correlation
- 3.4.3. Regression
- 3.4.4. Extrapolation
- 3.4.5. Convergence
- 3.4.6. Sensitivity Analysis
- 3.4.7. Scenario Planning
- 3.4.8. Data Visualization
- 3.4.9. Time Series Analysis
- 3.4.10. Forecast Error Analysis
- 3.5. Key Considerations
- 3.5.1. Demographics
- 3.5.2. Government Regulations
- 3.5.3. Reimbursement Scenarios
- 3.5.4. Market Access
- 3.5.5. Supply Chain
- 3.5.6. Industry Consolidation
- 3.5.7. Pandemic / Unforeseen Disruptions Impact
- 3.6. Limitations
4. MACRO-ECONOMIC INDICATORS
- 4.1. Chapter Overview
- 4.2. Market Dynamics
- 4.2.1. Time Period
- 4.2.1.1. Historical Trends
- 4.2.1.2. Current and Forecasted Estimates
- 4.2.2. Currency Coverage
- 4.2.2.1. Major Currencies Affecting the Market
- 4.2.2.2. Factors Affecting Currency Fluctuations
- 4.2.2.3. Impact of Currency Fluctuations on the Industry
- 4.2.3. Foreign Currency Exchange Rate
- 4.2.3.1. Impact of Foreign Exchange Rate Volatility on the Market
- 4.2.3.2. Strategies for Mitigating Foreign Exchange Risk
- 4.2.4. Recession
- 4.2.4.1. Assessment of Current Economic Conditions and Potential Impact on the Market
- 4.2.4.2. Historical Analysis of Past Recessions and Lessons Learnt
- 4.2.5. Inflation
- 4.2.5.1. Measurement and Analysis of Inflationary Pressures in the Economy
- 4.2.5.2. Potential Impact of Inflation on the Market Evolution
- 4.2.6. Interest Rates
- 4.2.6.1. Interest Rates and Their Impact on the Market
- 4.2.6.2. Strategies for Managing Interest Rate Risk
- 4.2.7. Commodity Flow Analysis
- 4.2.7.1. Type of Commodity
- 4.2.7.2. Origins and Destinations
- 4.2.7.3. Value and Weights
- 4.2.7.4. Modes of Transportation
- 4.2.8. Global Trade Dynamics
- 4.2.8.1. Import Scenario
- 4.2.8.2. Export Scenario
- 4.2.8.3. Trade Policies
- 4.2.8.4. Strategies for Mitigating the Risks Associated with Trade Barriers
- 4.2.8.5. Impact of Trade Barriers on the Market
- 4.2.9. War Impact Analysis
- 4.2.9.1. Russian-Ukraine War
- 4.2.9.2. Israel-Hamas War
- 4.2.10. COVID Impact / Related Factors
- 4.2.10.1. Global Economic Impact
- 4.2.10.2. Industry-specific Impact
- 4.2.10.3. Government Response and Stimulus Measures
- 4.2.10.4. Future Outlook and Adaptation Strategies
- 4.2.11. Other Indicators
- 4.2.11.1. Fiscal Policy
- 4.2.11.2. Consumer Spending
- 4.2.11.3. Gross Domestic Product (GDP)
- 4.2.11.4. Employment
- 4.2.11.5. Taxes
- 4.2.11.6. Stock Market Performance
- 4.2.11.7. Cross-Border Dynamics
- 4.2.1. Time Period
- 4.3. Conclusion
5. EXECUTIVE SUMMARY
- 5.1. Cancer Biomarker Testing Solutions: Market Landscape
- 5.2. Cancer Biomarker Testing Solutions: Market Trends
- 5.3. Cancer Biomarker Testing Solutions: Market Forecast and Opportunity Analysis
6. INTRODUCTION
- 6.1. Chapter Overview
- 6.2. An Overview of Cancer Biomarkers
- 6.2.1. Need for Cancer Biomarkers
- 6.2.2. Identification of a Candidate Biomarker
- 6.3. Type of Cancer Biomarkers
- 6.4. Novel Cancer Biomarkers
- 6.4.1. Tumor Mutation Burden (TMB)
- 6.4.1.1. Variation of TMB across Multiple Indications
- 6.4.1.2. Methods for Measurement of TMB
- 6.4.1.3. Factors Affecting Measurement of TMB
- 6.4.1.4. Initiatives for Assessment of TMB as a Potential Biomarker
- 6.4.2. Microsatellite Instability / Mismatch Repair Deficiency (MSI / MMR)
- 6.4.2.1. Variation of MSI across Multiple Indications
- 6.4.2.2. Methods for Measurement of MSI
- 6.4.3. Single Nucleotide Variants (SNVs)
- 6.4.3.1. Variation of SNV across Multiple Indications
- 6.4.3.2. Methods for Measurement of SNV
- 6.4.4. Copy Number Variants (CNVs)
- 6.4.4.1. Variation of CNV across Multiple Cancer Indications
- 6.4.4.2. Methods for Measurement of CNV
- 6.4.5. Indels and Other Novel Biomarkers
- 6.4.1. Tumor Mutation Burden (TMB)
- 6.5. Future Perspective
7. MARKET LANDSCAPE
- 7.1. Chapter Overview
- 7.2. Cancer Biomarker Testing Solutions: Overall Market Landscape
- 7.2.1. Analysis by Type of Biomarker Evaluated
- 7.2.2. Analysis by Type of Analytical Technique Used
- 7.2.3. Analysis by Turnaround Time
- 7.2.4. Analysis by Type of Sample Supported
- 7.2.5. Analysis by Type of Nucleic Acid Tested
- 7.2.6. Analysis by Type of Cancer
- 7.2.7. Analysis by Application Area
- 7.2.8. Analysis by End-user
- 7.3. Cancer Biomarkers Testing Solutions: Provider Landscape
- 7.3.1. Analysis by Year of Establishment
- 7.3.2. Analysis by Company Size
- 7.3.3. Analysis by Location of Headquarters
- 7.3.4. Most Active Player: Analysis by Number of Testing Solutions Offered
8. PRODUCT COMPETITIVENESS ANALYSIS
- 8.1. Chapter Overview
- 8.2. Assumptions / Key Parameters
- 8.3. Methodology
- 8.4. Overview of Peer Groups
- 8.5. Cancer Biomarkers Testing Solutions: Product Competitiveness Analysis
- 8.5.1. Cancer Biomarker Testing Solutions Offered by Providers Headquartered in North America
- 8.5.2. Cancer Biomarker Testing Solutions Offered by Providers Headquartered in Europe
- 8.5.3. Cancer Biomarker Testing Solutions Offered by Providers Headquartered in Asia-Pacific
9. COMPANY PROFILES: CANCER BIOMARKERS TESTING SOLUTION PROVIDERS
- 9.1. Chapter Overview
- 9.2. Agilent
- 9.2.1. Company Overview
- 9.2.2. Cancer Biomarker Testing Solutions Portfolio
- 9.3. ARUP Laboratories
- 9.3.1. Company Overview
- 9.3.2. Cancer Biomarker Testing Solutions Portfolio
- 9.4. Asper Biogene
- 9.4.1. Company Overview
- 9.4.2. Cancer Biomarker Testing Solutions Portfolio
- 9.5. BioReference
- 9.5.1. Company Overview
- 9.5.2. Cancer Biomarker Testing Solutions Portfolio
- 9.6. Caris Life Sciences
- 9.6.1. Company Overview
- 9.6.2. Cancer Biomarker Testing Solutions Portfolio
- 9.7. CeGaT
- 9.7.1. Company Overview
- 9.7.2. Cancer Biomarker Testing Solutions Portfolio
- 9.8. Foundation Medicine
- 9.8.1. Company Overview
- 9.8.2. Cancer Biomarker Testing Solutions Portfolio
- 9.9. Genekor Medical
- 9.9.1. Company Overview
- 9.9.2. Cancer Biomarker Testing Solutions Portfolio
- 9.10. Guardant Health
- 9.10.1. Company Overview
- 9.10.2. Cancer Biomarker Testing Solutions Portfolio
- 9.11. IQVIA Laboratories
- 9.11.1. Company Overview
- 9.11.2. Cancer Biomarker Testing Solutions Portfolio
- 9.12. Labcorp
- 9.12.1. Company Overview
- 9.12.2. Cancer Biomarker Testing Solutions Portfolio
- 9.13. MedGenome
- 9.13.1. Company Overview
- 9.13.2. Cancer Biomarker Testing Solutions Portfolio
- 9.14. NeoGenomics Laboratories
- 9.14.1. Company Overview
- 9.14.2. Cancer Biomarker Testing Solutions Portfolio
- 9.15. Nonacus
- 9.15.1. Company Overview
- 9.15.2. Cancer Biomarker Testing Solutions Portfolio
- 9.16. OncoDNA
- 9.16.1. Company Overview
- 9.16.2. Cancer Biomarker Testing Solutions Portfolio
- 9.17. Quest Diagnostics
- 9.17.1. Company Overview
- 9.17.2. Cancer Biomarker Testing Solutions Portfolio
- 9.19. Oxford Gene Technology
- 9.19.1. Company Overview
- 9.19.2. Cancer Biomarker Testing Solutions Portfolio
- 9.19. Personal Genome Diagnostics
- 9.19.1. Company Overview
- 9.19.2. Cancer Biomarker Testing Solutions Portfolio
- 9.20. PhenoPath
- 9.20.1. Company Overview
- 9.20.2. Cancer Biomarker Testing Solutions Portfolio
- 9.21. Positive Biosciences
- 9.21.1. Company Overview
- 9.21.2. Cancer Biomarker Testing Solutions Portfolio
- 9.22. Tempus AI
- 9.22.1. Company Overview
- 9.22.2. Cancer Biomarker Testing Solutions Portfolio
- 9.23. Thermo Fisher Scientific
- 9.23.1. Company Overview
- 9.23.2. Cancer Biomarker Testing Solutions Portfolio
- 9.24. YuceBio
- 9.24.1. Company Overview
- 9.24.2. Cancer Biomarker Testing Solutions Portfolio
10. INNOVATIVE STUDY DESIGNS FOR BIOMARKER-BASED CLINICAL TRIALS
- 10.1. Chapter Overview
- 10.2. Study Designs for Biomarker-based Clinical Trials
- 10.2.1. Enrichment Design
- 10.2.2. All-comers Design
- 10.2.3. Mixture / Hybrid Design
- 10.2.4. Adaptive Design
- 10.3. Regulatory Guidelines for Biomarker-based Clinical Trial Designs
- 10.4. Conclusion
11. CLINICAL TRIAL ANALYSIS
- 11.1. Chapter Overview
- 11.2. Scope and Methodology
- 11.3. Cancer Biomarkers: Clinical Trial Analysis
- 11.3.1. Analysis by Trial Registration Year
- 11.3.2. Analysis of Patients Enrolled by Trial Registration Year
- 11.3.3. Analysis by Trial Status
- 11.3.4. Analysis by Trial Registration Year and Trial Status
- 11.3.5. Analysis by Trial Phase
- 11.3.6. Analysis of Enrolled Patient Population by Trial Phase
- 11.3.7. Analysis by Patient Gender
- 11.3.8. Analysis by Study Design
- 11.3.8.1. Analysis by Type of Allocation
- 11.3.8.2. Analysis by Type of Intervention Model
- 11.3.8.3. Analysis by Type of Masking
- 11.3.8.4. Analysis by Type of Primary Purpose
- 11.3.9. Analysis by Type of Sponsor / Collaborator
- 11.3.10. Most Active Industry Player: Analysis by Number of Registered Trials
- 11.3.11. Most Active Non-Industry Player: Analysis by Number of Registered Trials
- 11.3.12. Analysis of Clinical Trials by Geography
- 11.3.13. Analysis of Clinical Trials by Trial Status and Geography
- 11.3.14. Analysis of Patients Enrolled by Trial Status and Geography
12. PUBLICATION ANALYSIS
- 12.1. Chapter Overview
- 12.2. Scope and Methodology
- 12.3. Cancer Biomarkers: Publication Analysis
- 12.3.1. Analysis by Year of Publication
- 12.3.2. Analysis by Type of Publication
- 12.3.3. Analysis by Type of Cancer
- 12.3.4. Analysis by Copyright Holders
- 12.3.5. Word Cloud: Emerging Focus Areas
- 12.3.6. Most Active Publishers: Analysis by Number of Publications
- 12.3.7. Key Journals: Analysis by Impact Factor
- 12.3.8. Key Journals: Analysis by Number of Publications
13. BIG PHARMA PLAYERS: BENCHMARK ANALYSIS
- 13.1. Chapter Overview
- 13.2. Scope and Methodology
- 13.3. Big Pharma Players: Benchmarking Analysis
- 13.3.1. Spider Web Analysis: Abbott
- 13.3.2. Spider Web Analysis: AbbVie
- 13.3.3. Spider Web Analysis: Amgen
- 13.3.4. Spider Web Analysis: AstraZeneca
- 13.3.5. Spider Web Analysis: Bayer
- 13.3.6. Spider Web Analysis: Boehringer Ingelheim
- 13.3.7. Spider Web Analysis: Bristol-Myers Squib
- 13.3.8. Spider Web Analysis: Eli Lilly
- 13.3.9. Spider Web Analysis: Gilead
- 13.3.10. Spider Web Analysis: GlaxoSmithKline
- 13.3.11. Spider Web Analysis: Merck
- 13.3.12. Spider Web Analysis: Novartis
- 13.3.13. Spider Web Analysis: Pfizer
- 13.3.14. Spider Web Analysis: Roche
- 13.3.15. Spider Web Analysis: Sanofi
- 13.4. Concluding Remarks
14. CASE STUDY: ANALYSIS OF VALUE CHAIN IN THE COMPANION DIAGNOSTICS INDUSTRY
- 14.1. Chapter Overview
- 14.2. Companion Diagnostics: Value Chain
- 14.3. Cost Distribution Across the Value Chain
- 14.3.1. Costs Associated with Research and Product Development
- 14.3.2. Costs Associated with Manufacturing and Assembly
- 14.3.3. Costs Associated with Clinical Trials, FDA Approval and Other Administrative Tasks
- 14.3.4. Costs Associated with Payer Negotiation and KOL Engagement
- 14.3.5. Costs Associated with Marketing and Sales
15. CASE STUDY: FUTURE GROWTH OPPORTUNITIES IN CANCER BIOMARKERS INDUSTRY
- 15.1. Chapter Overview
- 15.1.1. Growing Focus on Personalized Medicines
- 15.1.2. Rising need for Biomarker Testing for Various Oncological Disorders
- 15.1.3. Increase in Number of Biomarker-based Clinical Trials
- 15.1.4. Increased Adoption of Emerging Analytical Techniques for Biomarker Assessment
- 15.1.5. Development of Companion Diagnostic Products
- 15.2. Conclusion
16. GLOBAL CANCER BIOMARKERS MARKET
- 16.1. Chapter Overview
- 16.2. Assumptions and Methodology
- 16.3. Global Cancer Biomarkers Market, Historical Trends (since 2021) and Forecasted Estimates (till 2035)
- 16.3.1. Scenario Analysis
- 16.3.1.1. Conservative Scenario
- 16.3.1.2. Optimistic Scenario
- 16.3.1. Scenario Analysis
- 16.4. Key Market Segmentations
17. CANCER BIOMARKERS MARKET, BY TYPE OF BIOMARKER
- 17.1. Chapter Overview
- 17.2. Key Assumptions and Methodology
- 17.3. Cancer Biomarkers Market: Distribution by Type of Biomarker
- 17.3.1. Cancer Biomarkers Market for HER2 Biomarkers: Historical Trends (since 2021) and Forecasted Estimates (till 2035)
- 17.3.2. Cancer Biomarkers Market for MET Biomarkers: Historical Trends (since 2021) and Forecasted Estimates (till 2035)
- 17.3.3. Cancer Biomarkers Market for EGFR Biomarkers: Historical Trends (since 2021) and Forecasted Estimates (till 2035)
- 17.3.4. Cancer Biomarkers Market for PD-L1 Biomarkers: Historical Trends (since 2021) and Forecasted Estimates (till 2035)
- 17.3.5. Cancer Biomarkers Market for NTRK Biomarkers: Historical Trends (since 2021) and Forecasted Estimates (till 2035)
- 17.3.6. Cancer Biomarkers Market for ALK Biomarkers: Historical Trends (since 2021) and Forecasted Estimates (till 2035)
- 17.3.7. Cancer Biomarkers Market for Other Biomarkers: Historical Trends (since 2021) and Forecasted Estimates (till 2035)
- 17.4. Cancer Biomarkers Market: Distribution of Novel Biomarkers
- 17.4.1. Cancer Biomarkers Market for SNV Biomarkers: Historical Trends (since 2021) and Forecasted Estimates (till 2035)
- 17.4.2. Cancer Biomarkers Market for MSI Biomarkers: Historical Trends (since 2021) and Forecasted Estimates (till 2035)
- 17.4.3. Cancer Biomarkers Market for CNV Biomarkers: Historical Trends (since 2021) and Forecasted Estimates (till 2035)
- 17.4.4. Cancer Biomarkers Market for TMB Biomarkers: Historical Trends (since 2021) and Forecasted Estimates (till 2035)
- 17.4.5. Cancer Biomarkers Market for TIL Biomarkers: Historical Trends (since 2021) and Forecasted Estimates (till 2035)
- 17.4.6. Cancer Biomarkers Market for Indel Biomarkers: Historical Trends (since 2021) and Forecasted Estimates (till 2035)
- 17.5. Data Triangulation and Validation
18. CANCER BIOMARKERS MARKET, BY TYPE OF CANCER
- 18.1. Chapter Overview
- 18.2. Key Assumptions and Methodology
- 18.3. Cancer Biomarkers Market: Distribution by Type of Cancer
- 18.3.1. Cancer Biomarkers Market for Breast Cancer: Historical Trends (since 2021) and Forecasted Estimates (till 2035)
- 18.3.2. Cancer Biomarkers Market for Colorectum Cancer: Historical Trends (since 2021) and Forecasted Estimates (till 2035)
- 18.3.3. Cancer Biomarkers Market for Lung Cancer: Historical Trends (since 2021) and Forecasted Estimates (till 2035)
- 18.3.4. Cancer Biomarkers Market for Prostate Cancer: Historical Trends (since 2021) and Forecasted Estimates (till 2035)
- 18.3.5. Cancer Biomarkers Market for Thyroid Cancer: Historical Trends (since 2021) and Forecasted Estimates (till 2035)
- 18.3.6. Cancer Biomarkers Market for Bladder Cancer: Historical Trends (since 2021) and Forecasted Estimates (till 2035)
- 18.3.7. Cancer Biomarkers Market for Melanoma: Historical Trends (since 2021) and Forecasted Estimates (till 2035)
- 18.3.8. Cancer Biomarkers Market for Non-Hodgkin Lymphoma: Historical Trends (since 2021) and Forecasted Estimates (till 2035)
- 18.3.9. Cancer Biomarkers Market for Endometrial Cancer: Historical Trends (since 2021) and Forecasted Estimates (till 2035)
- 18.3.10. Cancer Biomarkers Market for Kidney Cancer: Historical Trends (since 2021) and Forecasted Estimates (till 2035)
- 18.3.11. Cancer Biomarkers Market for Leukemia: Historical Trends (since 2021) and Forecasted Estimates (till 2035)
- 18.4. Data Triangulation and Validation
19. CANCER BIOMARKERS MARKET, BY GEOGRAPHICAL REGIONS
- 19.1. Chapter Overview
- 19.2. Key Assumptions and Methodology
- 19.3. Cancer Biomarkers Market: Distribution by Geographical Regions
- 19.3.1. Cancer Biomarkers Market in North America: Historical Trends (since 2021) and Forecasted Estimates (till 2035)
- 19.3.1.1. North America Cancer Biomarkers Market in the US: Historical Trends (since 2021) and Forecasted Estimates (till 2035)
- 19.3.1.2. North America Cancer Biomarkers Market in Canada: Historical Trends (since 2021) and Forecasted Estimates (till 2035)
- 19.3.2. Cancer Biomarkers Market in Europe: Historical Trends (since 2021) and Forecasted Estimates (till 2035)
- 19.3.2.1. Europe Cancer Biomarkers Market in Germany: Historical Trends (since 2021) and Forecasted Estimates (till 2035)
- 19.3.2.2. Europe Cancer Biomarkers Market in France: Historical Trends (since 2021) and Forecasted Estimates (till 2035)
- 19.3.2.3. Europe Cancer Biomarkers Market in the UK: Historical Trends (since 2021) and Forecasted Estimates (till 2035)
- 19.3.2.4. Europe Cancer Biomarkers Market in Italy: Historical Trends (since 2021) and Forecasted Estimates (till 2035)
- 19.3.2.5. Europe Cancer Biomarkers Market in Spain: Historical Trends (since 2021) and Forecasted Estimates (till 2035)
- 19.3.3. Cancer Biomarkers Market in Asia-Pacific: Historical Trends (since 2021) and Forecasted Estimates (till 2035)
- 19.3.3.1. Asia-Pacific Cancer Biomarkers Market in China: Historical Trends (since 2021) and Forecasted Estimates (till 2035)
- 19.3.3.2. Asia-Pacific Cancer Biomarkers Market in Japan: Historical Trends (since 2021) and Forecasted Estimates (till 2035)
- 19.3.3.3. Asia-Pacific Cancer Biomarkers Market in India: Historical Trends (since 2021) and Forecasted Estimates (till 2035)
- 19.3.3.4. Asia-Pacific Cancer Biomarkers Market in South Korea: Historical Trends (since 2021) and Forecasted Estimates (till 2035)
- 19.3.3.5. Asia-Pacific Cancer Biomarkers Market in Australia: Historical Trends (since 2021) and Forecasted Estimates (till 2035)
- 19.3.3.6. Asia-Pacific Cancer Biomarkers Market in New Zealand: Historical Trends (since 2021) and Forecasted Estimates (till 2035)
- 19.3.4. Cancer Biomarkers Market in Latin America: Historical Trends (since 2021) and Forecasted Estimates (till 2035)
- 19.3.4.1. Latin America Cancer Biomarkers Market in Brazil: Historical Trends (since 2021) and Forecasted Estimates (till 2035)
- 19.3.4.2. Latin America Cancer Biomarkers Market in Argentina: Historical Trends (since 2021) and Forecasted Estimates (till 2035)
- 19.3.4.3. Latin America Cancer Biomarkers Market in Chile: Historical Trends (since 2021) and Forecasted Estimates (till 2035)
- 19.3.5. Cancer Biomarkers Market in Middle East and North Africa: Historical Trends (since 2021) and Forecasted Estimates (till 2035)
- 19.3.5.1. Middle East and North Africa Cancer Biomarkers Market in Egypt: Historical Trends (since 2021) and Forecasted Estimates (till 2035)
- 19.3.1. Cancer Biomarkers Market in North America: Historical Trends (since 2021) and Forecasted Estimates (till 2035)
- 19.4. Market Dynamics Assessment
- 19.4.1. Penetration Growth (P-G) Matrix
- 19.4.2. Market Movement Analysis
- 19.5. Data Triangulation and Validation
- *Detailed information on cross sectional analysis is available in the Excel Data Packs shared along with the report**
20. CONCLUDING REMARKS
21. EXECUTIVE INSIGHTS
- 21.1. Chapter Overview
- 21.2. Company A
- 21.2.1. Company Snapshot
- 21.2.2. Interview Transcript: Chief Technical Officer and Former Director of Preclinical Development & Strategic Partnerships
- 21.3. Company B
- 21.3.1. Company Snapshot
- 21.3.2. Interview Transcript: Former Chief Scientific Officer
- 21.4. Company C
- 21.4.1. Company Snapshot
- 21.4.2. Interview Transcript: Business Manager
22. APPENDIX 1: TABULATED DATA
23. APPENDIX 2: LIST OF COMPANIES AND ORGANIZATIONS
List of Tables
- Table 7.1 Cancer Biomarkers Testing Solutions: Information on Type of Biomarker evaluated
- Table 7.2 Cancer Biomarkers Testing Solutions: Information on Analytical Technique used
- Table 7.3 Cancer Biomarkers Testing Solutions: Information on Turnaround Time, Type of Sample Supported and Type of Nucleic Acid Tested
- Table 7.4 Cancer Biomarkers Testing Solutions: Information on Type of Cancer
- Table 7.5 Cancer Biomarkers Testing Solutions: Information on Application Area and End-user
- Table 6.6 List of Cancer Biomarker Testing Solution Providers
- Table 9.1 Cancer Biomarkers Testing Solution Providers: List of Companies Profiled
- Table 9.2 Agilent: Company Overview
- Table 9.3 Agilent: Cancer Biomarkers Testing Solutions Portfolio
- Table 9.4 ARUP Laboratories: Company Overview
- Table 9.5 ARUP Laboratories: Cancer Biomarker Testing Solutions Portfolio
- Table 9.6 Asper Biogene: Company Overview
- Table 9.7 Asper Biogene: Cancer Biomarkers Testing Solutions Portfolio
- Table 9.8 BioReference: Company Overview
- Table 9.9 BioReference: Cancer Biomarker Testing Solutions Portfolio
- Table 9.10 Caris Life Sciences: Company Overview
- Table 9.11 Caris Life Sciences: Cancer Biomarkers Testing Solutions Portfolio
- Table 9.12 CeGaT: Company Overview
- Table 9.13 CeGaT: Cancer Biomarkers Testing Solutions Portfolio
- Table 9.14 Foundation Medicine: Company Overview
- Table 9.15 Foundation Medicine: Cancer Biomarker Testing Solutions Portfolio
- Table 9.16 Genekor Medical: Company Overview
- Table 9.17 Genekor Medical: Cancer Biomarkers Testing Solutions Portfolio
- Table 9.18 Guardant Health: Company Overview
- Table 9.19 Guardant Health: Cancer Biomarkers Testing Solutions Portfolio
- Table 9.20 IQVIA Laboratories: Company Overview
- Table 9.21 IQVIA Laboratories: Cancer Biomarkers Testing Solutions Portfolio
- Table 9.22 Labcorp: Company Overview
- Table 9.23 Labcorp: Cancer Biomarkers Testing Solutions Portfolio
- Table 9.24 MedGenome: Company Overview
- Table 9.25 MedGenome: Cancer Biomarkers Testing Solutions Portfolio
- Table 9.26 NeoGenomics Laboratories: Company Overview
- Table 9.27 NeoGenomics Laboratories: Cancer Biomarkers Testing Solutions Portfolio
- Table 9.28 Nonacus: Company Overview
- Table 9.29 Nonacus: Cancer Biomarkers Testing Solutions Portfolio
- Table 9.30 OncoDNA: Company Overview
- Table 9.31 OncoDNA: Cancer Biomarker Testing Solutions Portfolio
- Table 9.32 Quest Diagnostics: Company Overview
- Table 9.33 Quest Diagnostics: Cancer Biomarker Testing Solutions Portfolio
- Table 9.34 Oxford Gene Technology: Company Overview
- Table 9.35 Oxford Gene Technology: Cancer Biomarkers Testing Solutions Portfolio
- Table 9.36 Personal Genome Diagnostics: Company Overview
- Table 9.37 Personal Genome Diagnostics: Cancer Biomarkers Testing Solutions Portfolio
- Table 9.38 PhenoPath: Company Overview
- Table 9.39 PhenoPath: Cancer Biomarkers Testing Solutions Portfolio
- Table 9.40 Positive Biosciences: Company Overview
- Table 9.41 Positive Biosciences: Cancer Biomarkers Testing Solutions Portfolio
- Table 9.42 Tempus AI: Company Overview
- Table 9.43 Tempus AI: Cancer Biomarkers Testing Solutions Portfolio
- Table 9.44 Thermo Fisher Scientific: Company Overview
- Table 9.45 Thermo Fisher Scientific: Cancer Biomarker Testing Solutions Portfolio
- Table 9.46 YuceBio: Company Overview
- Table 9.47 YuceBio: Cancer Biomarker Testing Solutions Portfolio
- Table 21.1 Cell IDx: Company Snapshot
- Table 21.2 NeoGenomics Laboratories: Company Snapshot
- Table 21.3 CeGat: Company Snapshot
- Table 22.1 Cancer Biomarker Testing Solutions: Distribution by Type of Biomarker Evaluated
- Table 22.2 Cancer Biomarker Testing Solutions: Distribution by Analytical Technique Used
- Table 22.3 Cancer Biomarker Testing Solutions: Distribution by Turnaround Time
- Table 22.4 Cancer Biomarker Testing Solutions: Distribution by Type of Sample Supported
- Table 22.5 Cancer Biomarker Testing Solutions: Distribution by Type of Nucleic Acid Tested
- Table 22.6 Cancer Biomarker Testing Solutions: Distribution by Type of Cancer
- Table 22.7 Cancer Biomarker Testing Solutions: Distribution by Application Area
- Table 22.8 Cancer Biomarker Testing Solutions: Distribution by End-user
- Table 22.9 Cancer Biomarker Testing Solution Providers: Distribution by Year of Establishment
- Table 22.10 Cancer Biomarker Testing Solution Providers: Distribution by Company Size
- Table 22.11 Cancer Biomarker Testing Solution Providers: Distribution by Location of Headquarters (Region)
- Table 22.11 Cancer Biomarker Testing Solution Providers: Distribution by Most Active Players
- Table 22.13 Clinical Trial Analysis: Distribution by Trial Registration Year, 2022-2025
- Table 22.14 Clinical Trial Analysis: Distribution of Patients Enrolled by Trial Registration Year, 2022-2025
- Table 22.15 Clinical Trial Analysis: Distribution by Trial Status
- Table 22.16 Clinical Trial Analysis: Distribution by Trial Registration Year and Trial Status
- Table 22.17 Clinical Trial Analysis: Distribution by Trial Phase
- Table 22.18 Clinical Trial Analysis: Distribution of Enrolled Patient Population by Trial Phase
- Table 22.19 Clinical Trial Analysis: Distribution by Patient Gender
- Table 22.20 Clinical Trial Analysis: Distribution by Study Design
- Table 22.21 Clinical Trial Analysis: Distribution by Type of Sponsor / Collaborator
- Table 22.22 Most Active Industry Players: Distribution by Number of Registered Trials
- Table 22.23 Most Active Non-Industry Players: Distribution by Number of Registered Trials
- Table 22.24 Clinical Trial Analysis: Distribution of Clinical Trials by Geography
- Table 22.25 Clinical Trial Analysis: Distribution of Clinical Trials by Trial Status and Geography
- Table 22.26 Clinical Trial Analysis: Distribution of Patients Enrolled by Trial Status and Geography
- Table 22.27 Publication Analysis: Cumulative Year-wise Trend of Publications, 2019-2023
- Table 22.28 Publication Analysis: Distribution by Type of Publication
- Table 22.29 Publication Analysis: Distribution by Type of Cancer
- Table 22.30 Copyright Holders: Distribution by Number of Publications
- Table 22.31 Most Active Publishers: Distribution by Number of Publications
- Table 22.32 Key Journals: Distribution by Impact Factor
- Table 22.33 Key Journals: Distribution by Number of Publications
- Table 22.34 Benchmarking Analysis: Big Pharma players
- Table 22.35 Global Cancer Biomarkers Market: Since 2021, Till 2035 (USD Billion) Conservative, Base and Optimistic
- Table 22.36 Cancer Biomarkers Market: Distribution by Type of Biomarker
- Table 22.37 Cancer Biomarkers Market for HER2 Biomarkers: Historical Trends (since 2021) and Forecasted Estimates (till 2035)
- Table 22.38 Cancer Biomarkers Market for MET Biomarkers: Historical Trends (since 2021) and Forecasted Estimates (till 2035)
- Table 22.39 Cancer Biomarkers Market for EGFR Biomarkers: Historical Trends (since 2021) and Forecasted Estimates (till 2035)
- Table 22.40 Cancer Biomarkers Market for PD-L1 Biomarkers: Historical Trends (since 2021) and Forecasted Estimates (till 2035)
- Table 22.41 Cancer Biomarkers Market for NTRK Biomarkers: Historical Trends (since 2021) and Forecasted Estimates (till 2035)
- Table 22.42 Cancer Biomarkers Market for ALK Biomarkers: Historical Trends (since 2021) and Forecasted Estimates (till 2035)
- Table 22.43 Cancer Biomarkers Market for Other Biomarkers: Historical Trends (since 2021) and Forecasted Estimates (till 2035)
- Table 22.44 Cancer Biomarkers Market: Distribution of Novel Biomarker
- Table 22.45 Cancer Biomarkers Market for SNV Biomarkers: Historical Trends (since 2021) and Forecasted Estimates (till 2035)
- Table 22.46 Cancer Biomarkers Market for CNV Biomarkers: Historical Trends (since 2021) and Forecasted Estimates (till 2035)
- Table 22.47 Cancer Biomarkers Market for Indel Biomarkers: Historical Trends (since 2021) and Forecasted Estimates (till 2035)
- Table 22.48 Cancer Biomarkers Market for TIL Biomarkers: Historical Trends (since 2021) and Forecasted Estimates (till 2035)
- Table 22.49 Cancer Biomarkers Market for MSI Biomarkers: Historical Trends (since 2021) and Forecasted Estimates (till 2035)
- Table 22.50 Cancer Biomarkers Market for TMB Biomarkers: Historical Trends (since 2021) and Forecasted Estimates (till 2035)
- Table 22.51 Cancer Biomarkers Market: Distribution by Type of Cancer
- Table 22.52 Cancer Biomarkers Market for Breast Cancer: Historical Trends (since 2021) and Forecasted Estimates (till 2035)
- Table 22.53 Cancer Biomarkers Market for Colorectum Cancer: Historical Trends (since 2021) and Forecasted Estimates (till 2035)
- Table 22.54 Cancer Biomarkers Market for Lung Cancer: Historical Trends (since 2021) and Forecasted Estimates (till 2035)
- Table 22.55 Cancer Biomarkers Market for Prostate Cancer: Historical Trends (since 2021) and Forecasted Estimates (till 2035)
- Table 22.56 Cancer Biomarkers Market for Thyroid Cancer: Historical Trends (since 2021) and Forecasted Estimates (till 2035)
- Table 22.57 Cancer Biomarkers Market for Bladder Cancer: Historical Trends (since 2021) and Forecasted Estimates (till 2035)
- Table 22.58 Cancer Biomarkers Market for Melanoma: Historical Trends (since 2021) and Forecasted Estimates (till 2035)
- Table 22.59 Cancer Biomarkers Market for Non-Hodgkin Lymphoma: Historical Trends (since 2021) and Forecasted Estimates (till 2035)
- Table 22.60 Cancer Biomarkers Market for Endometrial Cancer: Historical Trends (since 2021) and Forecasted Estimates (till 2035)
- Table 22.61 Cancer Biomarkers Market for Kidney Cancer: Historical Trends (since 2021) and Forecasted Estimates (till 2035)
- Table 22.62 Cancer Biomarkers Market for Leukemia: Historical Trends (since 2021) and Forecasted Estimates (till 2035)
- Table 22.63 Cancer Biomarkers Market: Distribution by Key Geographical Regions
- Table 22.64 Cancer Biomarkers Market in North America: Historical Trends (since 2021) and Forecasted Estimates (till 2035)
- Table 22.65 North America Cancer Biomarkers Market in the US: Historical Trends (since 2021) and Forecasted Estimates (till 2035)
- Table 22.66 North America Cancer Biomarkers Market in Canada: Historical Trends (since 2021) and Forecasted Estimates (till 2035)
- Table 22.67 Cancer Biomarkers Market in Europe: Historical Trends (since 2021) and Forecasted Estimates (till 2035)
- Table 22.68 Europe Cancer Biomarkers Market in Germany: Historical Trends (since 2021) and Forecasted Estimates (till 2035)
- Table 22.69 Europe Cancer Biomarkers Market in France: Historical Trends (since 2021) and Forecasted Estimates (till 2035)
- Table 22.70 Europe Cancer Biomarkers Market in the UK: Historical Trends (since 2021) and Forecasted Estimates (till 2035)
- Table 22.71 Europe Cancer Biomarkers Market in Italy: Historical Trends (since 2021) and Forecasted Estimates (till 2035)
- Table 22.72 Europe Cancer Biomarkers Market in Spain: Historical Trends (since 2021) and Forecasted Estimates (till 2035)
- Table 22.73 Cancer Biomarkers Market in Asia-Pacific: Historical Trends (since 2021) and Forecasted Estimates (till 2035)
- Table 22.74 Asia-Pacific Cancer Biomarkers Market in China: Historical Trends (since 2021) and Forecasted Estimates (till 2035)
- Table 22.75 Asia-Pacific Cancer Biomarkers Market in Japan: Historical Trends (since 2021) and Forecasted Estimates (till 2035)
- Table 22.76 Asia-Pacific Cancer Biomarkers Market in India: Historical Trends (since 2021) and Forecasted Estimates (till 2035)
- Table 22.77 Asia-Pacific Cancer Biomarkers Market in South Korea: Historical Trends (since 2021) and Forecasted Estimates (till 2035)
- Table 22.78 Asia-Pacific Cancer Biomarkers Market in Australia: Historical Trends (since 2021) and Forecasted Estimates (till 2035)
- Table 22.79 Asia-Pacific Cancer Biomarkers Market in New Zealand: Historical Trends (since 2021) and Forecasted Estimates (till 2035)
- Table 22.80 Cancer Biomarkers Market in Latin America: Historical Trends (since 2021) and Forecasted Estimates (till 2035)
- Table 22.81 Latin America Cancer Biomarkers Market in Brazil: Historical Trends (since 2021) and Forecasted Estimates (till 2035)
- Table 22.82 Latin America Cancer Biomarkers Market in Argentina: Historical Trends (since 2021) and Forecasted Estimates (till 2035)
- Table 22.83 Latin America Cancer Biomarkers Market in Chile: Historical Trends (since 2021) and Forecasted Estimates (till 2035)
- Table 22.84 Cancer Biomarkers Market in Middle East and North Africa: Historical Trends (since 2021) and Forecasted Estimates (till 2035)
- Table 22.85 Middle East and North Africa Cancer Biomarkers Market in Egypt: Historical Trends (since 2021) and Forecasted Estimates (till 2035)
List of Figures
- Figure 2.1 Research Methodology: Project Methodology
- Figure 2.2 Research Methodology: Data Sources for Secondary Research
- Figure 2.3 Research Methodology: Robust Quality Control
- Figure 3.1 Market Dynamics: Forecast Methodology
- Figure 3.2 Market Dynamics: Market Assessment Framework
- Figure 4.1 Lessons Learnt from Past Recessions
- Figure 5.1 Executive Summary: Overall Market Landscape
- Figure 5.2 Executive Summary: Market Trends
- Figure 5.3 Executive Summary: Market Forecast and Opportunity Analysis
- Figure 7.1 Cancer Biomarker Testing Solutions: Distribution by Type of Biomarker Evaluated
- Figure 7.2 Cancer Biomarker Testing Solutions: Distribution by Analytical Technique Used
- Figure 7.3 Cancer Biomarker Testing Solutions: Distribution by Turnaround Time
- Figure 7.4 Cancer Biomarker Testing Solutions: Distribution by Type of Sample Supported
- Figure 7.5 Cancer Biomarker Testing Solutions: Distribution by Type of Nucleic Acid Tested
- Figure 7.6 Cancer Biomarker Testing Solutions: Distribution by Type of Cancer
- Figure 7.7 Cancer Biomarker Testing Solutions: Distribution by Application Area
- Figure 7.8 Cancer Biomarker Testing Solutions: Distribution by End-user
- Figure 7.9 Cancer Biomarker Testing Solution Providers: Distribution by Year of Establishment
- Figure 7.10 Cancer Biomarker Testing Solution Providers: Distribution by Company Size
- Figure 7.11 Cancer Biomarker Testing Solution Providers: Distribution by Location of Headquarters (Region)
- Figure 7.11 Most Active Players: Distribution by Number of Testing Solutions Offered
- Figure 8.1 Product Competitiveness Analysis: Overview of Peer Group I
- Figure 8.2 Product Competitiveness Analysis: Overview of Peer Group II
- Figure 8.3 Product Competitiveness Analysis: Overview of Peer Group III
- Figure 8.4 Product Competitiveness Analysis: Cancer Biomarkers Testing Solution Offered by Providers Headquartered in North America (Peer Group I)
- Figure 8.5 Product Competitiveness Analysis: Cancer Biomarkers Testing Solution Offered by Providers Headquartered in Europe (Peer Group II)
- Figure 8.6 Product Competitiveness Analysis: Cancer Biomarkers Testing Solution Offered by Providers Headquartered in Asia-Pacific (Peer Group III)
- Figure 10.1 Enrichment Clinical Trial Design: Steps Involved
- Figure 10.2 All-Comers Clinical Trial Design: Steps Involved
- Figure 10.3 Hybrid Clinical Trial Design: Steps Involved
- Figure 10.4 Adaptive Clinical Trial Design: Steps Involved
- Figure 11.1 Clinical Trial Analysis: Distribution by Trial Registration Year, 2022-2025
- Figure 11.2 Clinical Trial Analysis: Distribution of Patients Enrolled by Trial Registration Year, 2022-2025
- Figure 11.3 Clinical Trial Analysis: Distribution by Trial Status
- Figure 11.4 Clinical Trial Analysis: Distribution by Trial Registration Year and Trial Status
- Figure 11.5 Clinical Trial Analysis: Distribution by Trial Phase
- Figure 11.6 Clinical Trial Analysis: Distribution of Enrolled Patient Population by Trial Phase
- Figure 11.7 Clinical Trial Analysis: Distribution by Patient Gender
- Figure 11.8 Clinical Trial Analysis: Distribution by Type of Allocation
- Figure 11.9 Clinical Trial Analysis: Distribution by Type of Intervention Model
- Figure 11.10 Clinical Trial Analysis: Distribution by Type of Masking
- Figure 11.11 Clinical Trial Analysis: Distribution by Type of Primary Purpose
- Figure 11.12 Clinical Trial Analysis: Distribution by Type of Sponsor / Collaborator
- Figure 11.13 Most Active Industry Players: Distribution by Number of Registered Trials
- Figure 11.14 Most Active Non-Industry Players: Distribution by Number of Registered Trials
- Figure 11.15 Clinical Trial Analysis: Distribution of Clinical Trials by Geography
- Figure 11.16 Clinical Trial Analysis: Distribution of Clinical Trials by Trial Status and Geography
- Figure 11.17 Clinical Trial Analysis: Distribution of Patients Enrolled by Trial Status and Geography
- Figure 12.1 Publication Analysis: Cumulative Year-wise Trend of Publications, 2019-2023
- Figure 12.2 Publication Analysis: Distribution by Type of Publication
- Figure 12.3 Publication Analysis: Distribution by Type of Cancer
- Figure 12.4 Most Popular Copyright Holders: Distribution by Number of Publications
- Figure 12.5 Word Cloud Analysis: Emerging Focus Areas
- Figure 12.6 Most Active Publishers: Distribution by Number of Publications
- Figure 12.7 Key Journals: Distribution by Impact Factor
- Figure 12.8 Key Journals: Distribution by Number of Publications
- Figure 13.1 Spider Web Analysis: Abbott
- Figure 13.2 Spider Web Analysis: AbbVie
- Figure 13.3 Spider Web Analysis: Amgen
- Figure 13.4 Spider Web Analysis: AstraZeneca
- Figure 13.5 Spider Web Analysis: Bayer
- Figure 13.6 Spider Web Analysis: Boehringer Ingelheim
- Figure 13.7 Spider Web Analysis: Bristol-Myers Squib
- Figure 13.8 Spider Web Analysis: Eli Lilly
- Figure 13.9 Spider Web Analysis: Gilead
- Figure 13.10 Spider Web Analysis: GlaxoSmithKline
- Figure 13.11 Spider Web Analysis: Merck
- Figure 13.12 Spider Web Analysis: Novartis
- Figure 13.13 Spider Web Analysis: Pfizer
- Figure 13.14 Spider Web Analysis: Roche
- Figure 13.15 Spider Web Analysis: Sanofi
- Figure 13.16 Benchmarking Analysis: Big Pharma players
- Figure 14.1 Companion Diagnostics: Value Chain
- Figure 14.2 Companion Diagnostics: Cost Distribution Across Value Chain
- Figure 14.3 Costs Associated with Research and Product Development
- Figure 14.4 Costs Associated with Manufacturing and Assembly
- Figure 14.5 Costs Associated with Clinical Trials, FDA Approval and Other Administrative Tasks
- Figure 14.6 Costs Associated with Payer Negotiation and KOL Engagement
- Figure 14.7 Costs Associated with Marketing and Sales
- Figure 15.1 Cancer Biomarkers Market: Future Growth Opportunities
- Figure 16.1 Global Cancer Biomarkers Market: Historical Trends (since 2021) and Forecasted Estimates (till 2035)
- Figure 16.2 Global Cancer Biomarkers Market: Forecasted Estimates (till 2035): Conservative Scenario (USD Billion)
- Figure 16.3 Global Cancer Biomarkers Market: Forecasted Estimates (till 2035): Optimistic Scenario (USD Billion)
- Figure 17.1 Cancer Biomarkers Market: Distribution by Type of Biomarker
- Figure 17.2 Cancer Biomarkers Market for HER2 Biomarkers: Historical Trends (since 2021) and Forecasted Estimates (till 2035)
- Figure 17.3 Cancer Biomarkers Market for MET Biomarkers: Historical Trends (since 2021) and Forecasted Estimates (till 2035)
- Figure 17.4 Cancer Biomarkers Market for EGFR Biomarkers: Historical Trends (since 2021) and Forecasted Estimates (till 2035)
- Figure 17.5 Cancer Biomarkers Market for PD-L1 Biomarkers: Historical Trends (since 2021) and Forecasted Estimates (till 2035)
- Figure 17.6 Cancer Biomarkers Market for NTRK Biomarkers: Historical Trends (since 2021) and Forecasted Estimates (till 2035)
- Figure 17.7 Cancer Biomarkers Market for ALK Biomarkers: Historical Trends (since 2021) and Forecasted Estimates (till 2035)
- Figure 17.8 Cancer Biomarkers Market for Other Biomarkers: Historical Trends (since 2021) and Forecasted Estimates (till 2035)
- Figure 17.9 Cancer Biomarkers Market: Distribution of Novel Biomarkers
- Figure 17.10 Cancer Biomarkers Market for SNV Biomarkers: Historical Trends (since 2021) and Forecasted Estimates (till 2035)
- Figure 17.11 Cancer Biomarkers Market for CNV Biomarkers: Historical Trends (since 2021) and Forecasted Estimates (till 2035)
- Figure 17.12 Cancer Biomarkers Market for Indel Biomarkers: Historical Trends (since 2021) and Forecasted Estimates (till 2035)
- Figure 17.13 Cancer Biomarkers Market for TIL Biomarkers: Historical Trends (since 2021) and Forecasted Estimates (till 2035)
- Figure 17.14 Cancer Biomarkers Market for MSI Biomarkers: Historical Trends (since 2021) and Forecasted Estimates (till 2035)
- Figure 17.15 Cancer Biomarkers Market for TMB Biomarkers: Historical Trends (since 2021) and Forecasted Estimates (till 2035)
- Figure 18.1 Cancer Biomarkers Market: Distribution by Type of Cancer
- Figure 18.2 Cancer Biomarkers Market for Breast Cancer: Historical Trends (since 2021) and Forecasted Estimates (till 2035)
- Figure 18.3 Cancer Biomarkers Market for Colorectum Cancer: Historical Trends (since 2021) and Forecasted Estimates (till 2035)
- Figure 18.4 Cancer Biomarkers Market for Lung Cancer: Historical Trends (since 2021) and Forecasted Estimates (till 2035)
- Figure 18.5 Cancer Biomarkers Market for Prostate Cancer: Historical Trends (since 2021) and Forecasted Estimates (till 2035)
- Figure 18.6 Cancer Biomarkers Market for Thyroid Cancer: Historical Trends (since 2021) and Forecasted Estimates (till 2035)
- Figure 18.7 Cancer Biomarkers Market for Bladder Cancer: Historical Trends (since 2021) and Forecasted Estimates (till 2035)
- Figure 18.8 Cancer Biomarkers Market for Melanoma: Historical Trends (since 2021) and Forecasted Estimates (till 2035)
- Figure 18.9 Cancer Biomarkers Market for Non-Hodgkin Lymphoma: Historical Trends (since 2021) and Forecasted Estimates (till 2035)
- Figure 18.10 Cancer Biomarkers Market for Endometrial Cancer: Historical Trends (since 2021) and Forecasted Estimates (till 2035)
- Figure 18.11 Cancer Biomarkers Market for Kidney Cancer: Historical Trends (since 2021) and Forecasted Estimates (till 2035)
- Figure 18.12 Cancer Biomarkers Market for Leukemia: Historical Trends (since 2021) and Forecasted Estimates (till 2035)
- Figure 19.1 Cancer Biomarkers Market: Distribution by Key Geographical Regions
- Figure 19.2 Cancer Biomarkers Market in North America: Historical Trends (since 2021) and Forecasted Estimates (till 2035)
- Figure 19.3 Cancer Biomarkers Market in the US: Historical Trends (since 2021) and Forecasted Estimates (till 2035)
- Figure 19.4 Cancer Biomarkers Market in Canada: Historical Trends (since 2021) and Forecasted Estimates (till 2035)
- Figure 19.5 Cancer Biomarkers Market in Europe: Historical Trends (since 2021) and Forecasted Estimates (till 2035)
- Figure 19.6 Cancer Biomarkers Market in Germany: Historical Trends (since 2021) and Forecasted Estimates (till 2035)
- Figure 19.7 Cancer Biomarkers Market in France: Historical Trends (since 2021) and Forecasted Estimates (till 2035)
- Figure 19.8 Cancer Biomarkers Market in the UK: Historical Trends (since 2021) and Forecasted Estimates (till 2035)
- Figure 19.9 Cancer Biomarkers Market in Italy: Historical Trends (since 2021) and Forecasted Estimates (till 2035)
- Figure 19.10 Cancer Biomarkers Market in Spain: Historical Trends (since 2021) and Forecasted Estimates (till 2035)
- Figure 19.11 Cancer Biomarkers Market in Asia-Pacific: Historical Trends (since 2021) and Forecasted Estimates (till 2035)
- Figure 19.12 Cancer Biomarkers Market in China: Historical Trends (since 2021) and Forecasted Estimates (till 2035)
- Figure 19.13 Cancer Biomarkers Market in Japan: Historical Trends (since 2021) and Forecasted Estimates (till 2035)
- Figure 19.14 Cancer Biomarkers Market in India: Historical Trends (since 2021) and Forecasted Estimates (till 2035)
- Figure 19.15 Cancer Biomarkers Market in South Korea: Historical Trends (since 2021) and Forecasted Estimates (till 2035)
- Figure 19.16 Cancer Biomarkers Market in Australia: Historical Trends (since 2021) and Forecasted Estimates (till 2035)
- Figure 19.17 Cancer Biomarkers Market in New Zealand: Historical Trends (since 2021) and Forecasted Estimates (till 2035)
- Figure 19.18 Cancer Biomarkers Market in Latin America: Historical Trends (since 2021) and Forecasted Estimates (till 2035)
- Figure 19.19 Cancer Biomarkers Market in Brazil: Historical Trends (since 2021) and Forecasted Estimates (till 2035)
- Figure 19.20 Cancer Biomarkers Market in Argentina: Historical Trends (since 2021) and Forecasted Estimates (till 2035)
- Figure 19.21 Cancer Biomarkers Market in Chile: Historical Trends (since 2021) and Forecasted Estimates (till 2035)
- Figure 19.22 Cancer Biomarkers Market in Middle East and North Africa: Historical Trends (since 2021) and Forecasted Estimates (till 2035)
- Figure 19.23 Cancer Biomarkers Market in Egypt: Historical Trends (since 2021) and Forecasted Estimates (till 2035)
- Figure 19.24 Market Movement Analysis: Geographical Regions
- Figure 19.25 Penetration-Growth (P-G) Matrix: Geographical Regions
- Figure 20.1 Concluding Remarks: Market Landscape
- Figure 20.2 Concluding Remarks: Clinical Trial Analysis
- Figure 20.3 Concluding Remarks: Publication Analysis
- Figure 20.4 Concluding Remarks: Market Forecast and Opportunity Analysis
 癌症生物標記市場報告:按分析技術、生物分子、癌症類型、應用、最終用戶和地區分類(2026-2034 年)
 全球癌症生物標記市場(至2032年):按分析技術(體學和影像)、癌症類型(肺癌、乳癌、白血病、黑色素瘤)、產品(設備和耗材)、應用(診斷和研發)、最終用戶(診斷實驗室)和地區分類
 癌症生物標記市場規模、佔有率和趨勢分析報告:按類型、生物分子、應用、技術、地區和細分市場預測(2026-2033 年)
 癌症生物標記市場規模、佔有率和成長分析:按生物標記類型、癌症類型、技術、應用、最終用戶和地區分類-2026-2033年產業預測
 癌症生物標記市場:按生物標記類型、技術、癌症類型、檢測類型、應用和最終用戶分類-2026-2032年全球市場預測
 粒細胞集落刺激因子(GNLY)市場報告:趨勢、預測和競爭分析(至2035年)
 癌症生物標記市場:按生物標記類型、癌症類型、分析技術、最終用戶和地區分類腫瘤血液檢測市場:按生物標記類型、技術、臨床應用、癌症類型、最終用戶和地區分類
 全球癌症生物標記市場規模、佔有率、趨勢和成長分析報告(2026-2034)
 兒童癌症生物標記市場-全球產業規模、佔有率、趨勢、機會及預測(按適應症、類型、最終用途、地區和競爭格局分類,2021-2031年)