


 |
市場調查報告書
商品編碼
2055603
生物製藥原料藥市場:按給藥途徑、表達系統、生物反應器、營運規模、生產商和地區分類的趨勢和預測(至2035年)Biologics API Market: Trends and Forecast Til 2035 - Distribution Type of Modality, Type of Expression System, Type of Bioreactor, Scale of Operation, Type of Manufacturer, and Geographical Regions |
||||||
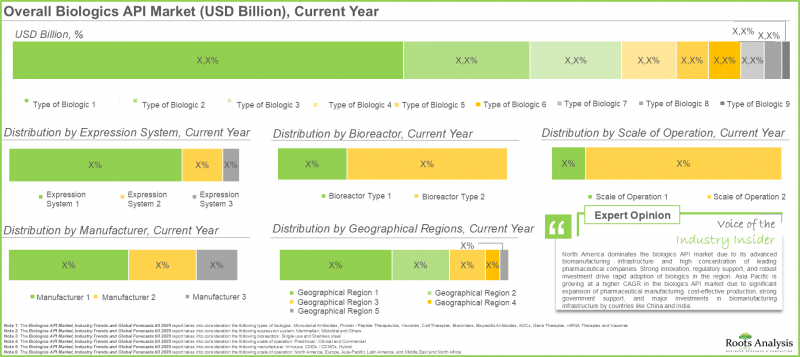
生物製藥原料藥市場概覽
預計到 2035 年,全球生物製藥原料藥市場規模將以 8.0% 的年複合成長率成長,從目前的 684 億美元成長到 1,459 億美元。
生物製藥原料藥市場:成長與趨勢
生物製藥原料藥(API)是生物製藥產品中包含的具有生物活性的物質,它們在為患者提供預期治療效果方面發揮著重要作用。這些原料藥透過各種生物技術方法和手段生產,包括重組DNA技術。值得注意的是,迄今為止,已有超過400種生物製藥產品獲得美國食品藥物管理局(FDA)的核准,其中包括單株抗體、mRNA療法、疫苗和雙特異性抗體。尤其值得一提的是,由於全球醫療模式向個人化醫療轉變,人們對生物製藥原料藥領域的關注和投資正在不斷成長。
包括諾華、輝瑞、羅氏和禮來在內的眾多領先生物製藥公司正在其自有原料藥製造地內推進原料藥生產,以高效生產種類繁多的生物製藥產品。此外,生物製造領域也取得了顯著進展。近期,默克宣布計畫在德拉瓦威爾明頓興建一座佔地47萬平方英尺的先進生物製藥卓越中心。該中心將致力於創新生物製藥和治療方法的商業化生產,其中包括強效抗體藥物複合體(ADC)。
未來,隨著生物製藥技術的進步和監管核准的增加,原料藥(API)的生產預計將會擴大。此外,許多生物製藥研發公司正在加強其內部原料藥生產能力。同時,為了滿足生物製藥的需求,原料藥生產將繼續外包給契約製造生產商,從而為生物製藥原料藥的CDMO(研發、生產和合約生產)市場創造商機。
生技製藥原料藥市場:關鍵洞察
本報告詳細分析了生物製藥原料藥市場的現狀,並指出了該行業的潛在成長機會。報告的主要發現包括:
- 目前,生物製藥原料藥的市場規模(以金額為準)估計約為 700 億美元,其中單株抗體佔據了大部分市場佔有率(以以金額為準)。
- 市場成長顯示相關利益者對生物製藥原料藥領域的興趣日益濃厚。事實上,預計北美將佔據近50%的市場佔有率。
- 鑑於慢性病盛行率不斷上升以及對生物製藥的需求不斷成長,生物製藥原料藥產業已做好充分準備迎接未來的成長。
- 目前,不包括單株抗體在內的生物製藥原料藥市場產量估計超過2,500萬公升。預計到2035年,這項需求將超過7,500萬公升,其中單株抗體原料藥預計將佔據較大的市場佔有率(50.5%)。
生物製藥原料藥市場
市場規模和機會分析是根據以下參數進行細分的:
按模式
- 單株抗體
- 蛋白質/胜肽
- 疫苗
- 細胞療法
- 生物相似藥
- 雙特異性抗體
- ADC
- 基因治療
- 系統發育療法和疫苗
透過表達系統
- 哺乳動物
- 微生物
- 其他
透過生物反應器
- 免洗生物反應器
- 不銹鋼生物反應器
按營運規模
- 臨床前/臨床
- 商業生產
製造商
- 生產自有產品的公司
- CMO/CDMO
- 混合型公司
按地區
- 北美洲
- 北美洲
- 亞太地區
- 中東和北非
- 拉丁美洲
生物製藥原料藥市場:主要細分市場
按表達系統分類的市場佔有率:預期哺乳動物表達系統將推動需求成長。
市場預測顯示,哺乳動物表達系統將佔據市場主導地位,以銷售額為準佔比超過75%。此外,現有哺乳動物表現系統約佔抗體藥物偶聯物(ADC)原料藥市場的90%,細胞和基因治療原料藥市場的86%,以及相關生物製藥原料藥市場的77%。其他表達系統細分市場預計將實現更高的年複合成長率(CAGR)。這主要歸因於植物和昆蟲細胞株在生產各種生物製藥(包括蛋白質和胜肽類藥物)方面的應用日益廣泛。
API生產商市場佔有率(按細分市場分類):API生產商細分市場的規模
市場預測顯示,目前企業內部生產佔最大的市場佔有率,預計未來將持續維持此地位。這主要歸功於企業內部生產企業在該領域的積極投資、擴張和收購。擁有自有生產設施的主要生物製藥原料藥生產商包括艾伯維、安進、禮來和賽諾菲。未來幾年,混合生產模式預計將在預測期內以更高的年複合成長率(8.3%)成長。
北美:保持其作為技術創新中心的地位
目前,北美市場佔據主導地位,預計這一趨勢將持續。這項擴張得益於該地區擁有眾多知名的製藥研發和生產企業、完善的醫療保健體係以及強大的研發能力,所有這些因素都在推動個人化醫療的持續發展。此外,該地區慢性病的高發生率也促使各國政府加強研發新的治療方法。
本報告考察了全球生物製藥原料藥市場,提供了市場概述、背景、市場影響因素分析、市場規模趨勢和預測、按各個細分市場進行的詳細分析、競爭格局以及主要公司的概況。
目錄
第1章 背景
第2章:調查方法
第3章 市場動態
第4章 宏觀經濟指標
- 市場動態
第5章執行摘要
第6章 市場狀況
- 章節概要
- 胜肽類原料契約製造:市場概覽
- 成立年份
- 公司規模
- 總部所在地
- 人工生技藥品
- 以API類型生產
- 按企業規模分析
- 依提供的服務類型
- 按地理分佈進行分析
第7章:企業競爭力分析
- 章節概要
- 關鍵參數
- 調查方法
- 企業競爭力分析
- 契約製造生產商。
- 契約製造生產商。
- 總部位於亞太地區及其他地區的生物製藥原料藥契約製造生產商。
第8章 公司簡介:生物製藥原料藥契約製造生產商
第9章:全球生物製藥原料藥市場(以金額為準)
- 關鍵假設和調查方法
- 市場結構:依生物製藥類型分類
- 市場結構:依表達體系分類
- 市場結構:依生物反應器分類
- 市場結構:依經營規模分類
- 市場組成:按製造商分類
- 市場結構:按地區分類
第10章:ADC API市場(以金額為準)
- 關鍵假設和調查方法
- 市場預測
- 市場結構:依表達體系分類
- 市場結構:依生物反應器分類
- 市場結構:依經營規模分類
- 市場組成:按製造商分類
- 市場結構:按地區分類
第11章:基因治療原料藥市場(以金額為準)
- 關鍵假設和調查方法
- 市場預測
- 市場結構:依表達體系分類
- 市場結構:依生物反應器分類
- 市場結構:依經營規模分類
- 市場組成:按製造商分類
- 市場結構:按地區分類
第12章:單株抗體原料藥市場(以金額為準)
- 關鍵假設和調查方法
- 市場預測
- 市場結構:依表達體系分類
- 市場結構:依生物反應器分類
- 市場結構:依經營規模分類
- 市場組成:按製造商分類
- 市場結構:按地區分類
第13章:生物相似藥原料藥市場(以金額為準)
- 關鍵假設和調查方法
- 市場預測
- 市場結構:依表達體系分類
- 市場結構:依生物反應器分類
- 市場結構:依經營規模分類
- 市場組成:按製造商分類
- 市場結構:按模式分類
- 市場結構:按地區分類
第14章:疫苗原料藥市場(以金額為準)
- 關鍵假設和調查方法
- 市場預測
- 市場結構:依表達體系分類
- 市場結構:依生物反應器分類
- 市場結構:依經營規模分類
- 市場組成:按製造商分類
- 市場結構:按地區分類
第15章:雙特異性抗體原料藥市場(以金額為準)
- 關鍵假設和調查方法
- 市場預測
- 市場結構:依表達體系分類
- 市場結構:依生物反應器分類
- 市場結構:依經營規模分類
- 市場組成:按製造商分類
- 市場結構:按地區分類
第16章:mRNA治療藥物原料藥市場(以金額為準)
- 關鍵假設和調查方法
- 市場預測
- 透過生物反應器
- 市場結構:依經營規模分類
- 市場組成:按製造商分類
- 市場結構:按地區分類
第17章:蛋白質/胜肽類治療藥物原料藥市場(以金額為準)
- 關鍵假設和調查方法
- 市場預測
- 市場結構:依表達體系分類
- 市場結構:依生物反應器分類
- 市場結構:依經營規模分類
- 市場組成:按製造商分類
- 市場結構:按地區分類
第18章:細胞療法原料藥市場(以金額為準)
- 關鍵假設和調查方法
- 市場預測
- 市場結構:依表達體系分類
- 市場結構:依生物反應器分類
- 市場結構:依經營規模分類
- 市場組成:按製造商分類
- 市場結構:以細胞療法類型分類
- 市場結構:按地區分類
第19章:全球生物製藥原料藥市場(以銷售量計)
- 關鍵假設和調查方法
- 市場結構:依生物製藥類型分類
- 單株抗體原料藥
- 蛋白質/胜肽類藥物原料藥
- 生物相似藥原料藥
- ADC API
- 雙特異性抗體API
- mRNA治療原料藥
- 細胞療法 API
- 基因治療API
第20章:基因治療原料藥市場(以銷售量計)
- 關鍵假設和調查方法
- 基因治療原料藥市場預測(至2035年)
- 市場結構:依表達體系分類
- 市場結構:依生物反應器分類
- 市場結構:依經營規模分類
- 市場組成:按製造商分類
- 市場結構:按地區分類
第21章:細胞療法原料藥市場(以銷售量計)
- 關鍵假設和調查方法
- 細胞療法原料藥市場預測(至2035年)
- 市場結構:依表達體系分類
- 市場結構:依生物反應器分類
- 市場結構:依經營規模分類
- 市場組成:按製造商分類
- 市場結構:按地區分類
第22章 資料三角測量與檢驗
第23章 結論
Biologics API Market: Overview
As per Roots Analysis, the global biologics API market is estimated to grow from USD 68.4 billion in the current year to USD 145.9 billion by 2035, at a CAGR of 8.0% during the forecast period, till 2035.
Biologics API Market: Growth and Trends
Biologics active pharmaceutical ingredients (API) refer to the biologically active substances in biological medications that are accountable for generating the intended therapeutic outcomes in patients. The therapeutic biologically active components are generated through a variety of biotechnological methods / techniques, including recombinant DNA technology. It is important to note that till date, over 400 biologics have been approved by the FDA, which includes monoclonal antibodies, mRNA therapies and vaccines, as well as bispecific antibodies. Significantly, the worldwide transition to personalized therapy has heightened interest and investment in the biologics API sector.
Numerous major biopharmaceutical companies, including Novartis, Pfizer, Roche, and Eli Lilly, are backing the active pharmaceutical ingredient production within their in-house API manufacturing sites to efficiently produce a range of biologics. Additionally, substantial advancements are occurring in the biomanufacturing sector. Recently, Merck revealed plans for a 470,000-square-foot advanced biologics center of excellence in Wilmington, Delaware, aimed at the commercial manufacturing of innovative biologics and therapies, including powerful antibody-drug conjugates (ADCs).
With the advancement of biologics and their approval by regulatory bodies, it is anticipated that API production will increase, coupled with biologic developers manufacturing active pharmaceutical ingredients in their own facilities. Additionally, to satisfy the demand for biologics, the production of APIs will continue to be outsourced to contract manufacturers, creating a market opportunity for biologics API CDMO.
Growth Drivers: Strategic Enablers of Market Expansion
Market drivers in the biologics API market include rising prevalence of chronic diseases and accelerating demand for advanced biologics like cell / gene therapies, vaccines, bispecific antibodies, and ADCs.
Market Challenges: Critical Barriers Impeding Progress
Stringent regulatory standards for quality, safety, and efficacy pose major hurdles, alongside high manufacturing costs and complex production processes. Supply chain disruptions, need for specialized high-containment facilities, and scaling difficulties for high-potency biologics add operational barriers. Intense competition and environmental sustainability concerns in API production also threaten profitability.
Biologics API Market: Key Insights
The report delves into the current state of the biologics API market and identifies potential growth opportunities within industry. Some key findings from the report include:
- Presently, the biologics API market (by value) is anticipated to be USD 70 billion, with monoclonal antibodies capturing the majority market share by value.
- The market growth is indicative of the growing interest of stakeholders in the field of biologics active pharmaceutical ingredients; in fact, close to 50% of market is likely to be captured by North America.
- Given the rising prevalence of chronic diseases and the increasing demand for biologics, the biologics active pharmaceutical ingredients industry is well-positioned for future growth.
- Over 25 million liters is the current volume of other biologics API market. This demand is likely to reach more than 75 million liters by 2035 with monoclonal antibodies API capturing the majority (50.5%) market share.
Biologics API Market
The market sizing and opportunity analysis has been segmented across the following parameters:
By Type of Modality
- Monoclonal Antibodies
- Proteins / Peptides
- Vaccines
- Cell Therapies
- Biosimilars
- Bispecific Antibodies
- ADCs
- Gene Therapies
- mRNA Therapies and Vaccines
By Type of Expression System
- Mammalian
- Microbial
- Others
By Type of Bioreactor
- Single-use Bioreactors
- Stainless-steel Bioreactors
By Scale of Operation
- Preclinical / Clinical
- Commercial
By Type of Manufacturer
- In-house Manufacturers
- CMOs / CDMOs
- Hybrid Manufacturers
By Geographical Regions
- North America
- Europe
- Asia-Pacific
- Middle East and North Africa
- Latin America
Biologics API Market: Key Segments
Market Share by Type of Expression System: Mammalian Expression Systems are Likely to Drive the Demand
In terms of expression systems, the biologics API market is segmented across mammalian, microbial and other expression systems. The biologics API market analysis forecast suggests that the mammalian expression system category will dominate the market, securing over 75% of the overall revenue share. Moreover, the existing mammalian expression system constitutes 90%, 86%, and 77% of the overall ADC API market, cell and gene therapy API market. The other expression systems segment is anticipated to reach a greater CAGR. This results from the growing use of plant and insect cell lines to produce various biologics, including protein-peptide therapeutics.
Market Share by Type of API Manufacturer: How Large is the API Manufacturer Segment?
According to the biologics API market forecast, currently, in-house segment holds the biggest share and is expected to remain stable moving forward. This arises from the proactive investment, growth, and acquisition efforts of the internal producers in this field. Certain biologics API producers with internal facilities are AbbVie, Amgen, Eli Lilly, and Sanofi. In the coming years, the hybrid manufacturing segment is expected to expand at a higher CAGR (8.3%) throughout the prediction period.
North America: Remains the Center for Technological Innovations
At present, North America leads the market and is expected to continue this trend in the future. This expansion results from the presence of prominent pharmaceutical developers and manufacturers, advanced healthcare systems, and strong research and development (R&D) capabilities in the area, promoting ongoing advancement for tailored therapies. Moreover, the significant occurrence of chronic illnesses in this area has prompted the government to enhance efforts for creating novel treatments.
Biologics API Market: Research Coverage
- Market Sizing and Opportunity Analysis: The report features an in-depth analysis of the biologics API market, focusing on key market segments, including [A] type of modality, [B] type of expression system, [C] type of bioreactor, [D] scale of operation, [E] type of manufacturer, and [F] geographical regions.
- Market Landscape Analysis: A detailed overview of the current market landscape of biologics API manufacturers along with information on several relevant parameters, such as [A] year of establishment, [B] company size, [C] location of headquarters, [D] type of biologic, [E] type of API manufactured, [F] scale of operation, and [G] geographical presence.
- Company Competitiveness Analysis: An insightful company competitiveness analysis of prominent biologics API contract manufacturers in the biologics API manufacturing industry, based on several relevant parameters, such as [A] supplier strength, [A] service portfolio and [A] number of biologics offered.
- Company Profiles: In-depth profiles of prominent players North America, Europe and Asia-Pacific that are engaged in the peptide therapeutics manufacturing market based on [A] year of establishment, [B] location of headquarters, [C] product portfolio, [D] recent developments and [E] an informed future outlook.
- Market Impact Analysis: An in-depth analysis of the factors that can impact the growth of the global biologics API market. It also features identification and analysis of [A] key drivers, [B] potential restraints, [C] emerging opportunities, and [D] existing challenges.
Key Questions Answered in this Report
- Which are the leading companies in the biologics API market?
- Which region dominates the biologics API market?
- What are the key trends observed in the biologics API market?
- What factors are likely to influence the evolution of this market?
- What are the primary challenges faced by biologic API developers?
- What is the current and future market size?
- What is the CAGR of this market?
- How is the current and future market opportunity likely to be distributed across key market segments?
Reasons to Buy this Report
- The report provides a comprehensive market analysis, offering detailed revenue projections of the overall market and its specific sub-segments. This information is valuable to both established market leaders and emerging entrants.
- The report offers stakeholders a comprehensive overview of the market, including key drivers, barriers, opportunities, and challenges. This information empowers stakeholders to stay abreast of market trends and make data-driven decisions to capitalize on growth prospects.
- The report can aid businesses in identifying future opportunities in any sector. It also helps in understanding if those opportunities are worth pursuing.
- The report helps in identifying customer demand by understanding the needs, preferences, and behavior of the target audience in order to tailor products or services effectively.
- The report equips new entrants with requisite information regarding a particular market to help them build successful business strategies.
- The report allows for more effective communication with the audience and in building strong business relations.
Additional Benefits
- Complementary PPT Insights Pack
- Complimentary Excel Data Packs for all Analytical Modules in the Report
- 15% Free Content Customization
- Detailed Report Walkthrough Session with Research Team
- Free Updated report if the report is 6-12 months old or older
TABLE OF CONTENTS
1. BACKGROUND
- 1.1. Context
- 1.2. Project Objectives
2. RESEARCH METHODOLOGY
- 2.1. Research Assumptions
- 2.1.1. Market Landscape and Market Trends
- 2.1.2. Market Forecast and Opportunity Analysis
- 2.1.3. Comparative Analysis
- 2.2. Database Building
- 2.2.1. Data Collection
- 2.2.2. Data Validation
- 2.2.3. Data Analysis
- 2.3. Project Methodology
- 2.3.1. Project Commencement
- 2.3.2. Secondary Research
- 2.3.2.1. Annual Reports
- 2.3.2.2. Academic Research Papers
- 2.3.2.3. Company Websites
- 2.3.2.4. Investor Presentations and Regulatory Filings
- 2.3.2.5. White Papers
- 2.3.2.6. Industry Publications
- 2.3.2.7. Conferences and Seminars
- 2.3.2.8. Government Portals
- 2.3.2.9. Media and Press Releases
- 2.3.2.10. Newsletters
- 2.3.2.11. Industry and Paid Databases
- 2.3.2.12. Roots Proprietary Databases
- 2.3.3. Primary Research
- 2.3.4. Data Analysis and Interpretation
- 2.3.5. Market Forecast and Validation
- 2.3.6. Report Compilation
- 2.4. Research Ethics and Integrity
- 2.5. Analytical Tools and Databases
- 2.7. Robust Quality Control Framework
3. MARKET DYNAMICS
- 3.1. Forecast Methodology
- 3.1.1. Top-Down Approach
- 3.1.2. Bottom-Up Approach
- 3.1.3. Hybrid Approach
- 3.2. Market Assessment Framework
- 3.2.1. Total Addressable Market (TAM)
- 3.2.2. Serviceable Addressable Market (SAM)
- 3.2.3. Serviceable Obtainable Market (SOM)
- 3.2.4. Currently Acquired Market (CAM)
- 3.3. Forecasting Tools and Techniques
- 3.3.1. Qualitative Forecasting
- 3.3.2. Correlation
- 3.3.3. Regression
- 3.3.4. Extrapolation
- 3.3.5. Convergence
- 3.3.6. Sensitivity Analysis
- 3.3.7. Scenario Planning
- 3.3.8. Data Visualization
- 3.3.9. Time Series Analysis
- 3.3.10. Forecast Error Analysis
- 3.4. Key Considerations
- 3.4.1. Demographics
- 3.4.2. Economic Factors
- 3.4.3. Competitive Landscape
- 3.4.4. Government Regulations and Policies
- 3.4.5. R&D Investment
- 3.4.6. Technological Factors
- 3.4.7. Industry Consolidation
- 3.4.8. Supply Chain
- 3.4.9. Market Access
- 3.4.10. Pandemics / Unforeseen Disruptions Impact
4. MACRO-ECONOMIC INDICATORS
- 4.1. Market Dynamics
- 4.1.1. Time Period
- 4.1.1.1. Historical Trends
- 4.1.1.2. Current and Forecasted Estimates
- 4.1.2. Currency Coverage
- 4.1.2.1. Overview of Major Currencies Affecting the Market
- 4.1.2.2. Impact of Currency Fluctuations on the Industry
- 4.1.3. Foreign Exchange Impact
- 4.1.3.1. Evaluation of Foreign Exchange Rates and Their Impact on Market
- 4.1.3.2. Strategies for Mitigating Foreign Exchange Risk
- 4.1.4. Recession
- 4.1.4.1. Historical Analysis of Past Recessions and Lessons Learnt
- 4.1.4.2. Assessment of Current Economic Conditions and Potential Impact on the Market
- 4.1.5. Inflation
- 4.1.5.1. Measurement and Analysis of Inflationary Pressures in the Economy
- 4.1.5.2. Potential Impact of Inflation on the Market Evolution
- 4.1.7. Other Indicators
- 4.1.7.1. War Impact Analysis
- 4.1.7.2. Cross-border Dynamics
- 4.1.7.3. Consumer Spendings and Gross Domestic Product
- 4.1.7.4. Stock Market Performance
- 4.1.1. Time Period
5. EXECUTIVE SUMMARY
6. MARKET LANDSCAPE
- 6.1. Chapter Overview
- 6.2. Peptide API Contract Manufacturing: Overall Market Landscape
- 6.3. Analysis by Year of Establishment
- 6.4. Analysis by Company Size
- 6.5. Analysis by Location of Headquarters
- 6.6. Analysis by Type of Biologic Manufactured
- 6.7. Analysis by Type of API Manufactured
- 6.8. Analysis by Scale of Operation
- 6.9. Analysis by Type of Service Offered
- 6.10. Analysis by Geographical Presence
7. COMPANY COMPETITIVENESS ANALYSIS
- 7.1. Chapter Overview
- 7.2. Key Parameters
- 7.3. Methodology
- 7.4. Company Competitiveness Analysis
- 7.5. Biologics API Contract Manufacturers Headquartered in North America
- 7.6. Biologics API Contract Manufacturers Headquartered in Europe
- 7.7. Biologics API Contract Manufacturers Headquartered in Asia-Pacific and Rest of the World
8. COMPANY PROFILES: BIOLOGICS API CONTRACT MANUFACTURERS
- 8.1. Chapter Overview
- 8.2. Biologics API Manufacturers: List of Companies
- 8.2.1. Company A
- 8.2.2.1. Company Overview
- 8.2.1.2. Biologics API manufacturing Portfolio
- 8.2.1.3. Biologics API Manufacturing Facilities and Capabilities
- 8.2.1.4. Recent Developments and Future Outlook
- 8.2.2. Company B
- 8.2.3. Company C
- 8.2.4. Company D
- 8.2.1. Company A
9. GLOBAL BIOLOGICS API MARKET (BY VALUE)
- 9.1. Key Assumptions and Methodology
- 9.2. Biologics API Market: Distribution by Type of Biologic
- 9.3. Biologics API Market: Distribution by Expression System
- 9.4. Biologics API Market: Distribution by Bioreactor
- 9.5. Biologics API Market: Distribution by Scale of Operation
- 9.6. Biologics API Market: Distribution by Manufacturer
- 9.7. Biologics API Market: Distribution by Geographical Regions
10. ADC API MARKET (BY VALUE)
- 10.1. Key Assumptions and Methodology
- 10.2. ADC API Market, Till 2035
- 10.3. ADC API Market: Distribution by Expression System
- 10.4. ADC API Market: Distribution by Bioreactor
- 10.5. ADC API Market: Distribution by Scale of Operation
- 10.6. ADC API Market: Distribution by Manufacturer
- 10.7. ADC API Market: Distribution by Geographical Regions
11. GENE THERAPY API MARKET (BY VALUE)
- 11.1. Key Assumptions and Methodology
- 11.2. Gene Therapy API Market, Till 2035
- 11.3. Gene Therapy API Market: Distribution by Expression System
- 11.4. Gene Therapy API Market: Distribution by Bioreactor
- 11.5. Gene Therapy API Market: Distribution by Scale of Operation
- 11.6. Gene Therapy API Market: Distribution by Manufacturer
- 11.7. Gene Therapy API Market: Distribution by Geographical Regions
12. MONOCLONAL ANTIBODY API MARKET (BY VALUE)
- 12.1. Key Assumptions and Methodology
- 12.2. Monoclonal Antibody API Market, Till 2035
- 12.3. Monoclonal Antibody API Market: Distribution by Expression System
- 12.4. Monoclonal Antibody API Market: Distribution by Bioreactor
- 12.5. Monoclonal Antibody API Market: Distribution by Scale of Operation
- 12.6. Monoclonal Antibody API Market: Distribution by Manufacturer
- 12.7. Monoclonal Antibody API Market: Distribution by Geographical Regions
13. BIOSIMILAR API MARKET (BY VALUE)
- 13.1. Key Assumptions and Methodology
- 13.2. Biosimilar API Market, Till 2035
- 13.3. Biosimilar API Market: Distribution by Expression System
- 13.4. Biosimilar API Market: Distribution by Bioreactor
- 13.5. Biosimilar API Market: Distribution by Scale of Operation
- 13.6. Biosimilar API Market: Distribution by Manufacturer
- 13.7. Biosimilar API Market: Distribution by Modality
- 13.8. Biosimilar API Market: Distribution by Geographical Regions
14. VACCINE API MARKET (BY VALUE)
- 14.1. Key Assumptions and Methodology
- 14.2. Vaccine API Market, Till 2035
- 14.3. Vaccine API Market: Distribution by Expression System
- 14.4. Vaccine API Market: Distribution by Bioreactor
- 14.5. Vaccine API Market: Distribution by Scale of Operation
- 14.6. Vaccine API Market: Distribution by Manufacturer
- 14.7. Vaccine API Market: Distribution by Geographical Regions
15. BISPECIFIC ANTIBODY API MARKET (BY VALUE)
- 15.1. Key Assumptions and Methodology
- 15.2. Bispecific Antibody API Market, Till 2035
- 15.3. Bispecific Antibody API Market: Distribution by Expression System
- 15.4. Bispecific Antibody API Market: Distribution by Bioreactor
- 15.5. Bispecific Antibody API Market: Distribution by Scale of Operation
- 15.6. Bispecific Antibody API Market: Distribution by Manufacturer
- 15.7. Bispecific Antibody API Market: Distribution by Geographical Regions
16. mRNA THERAPEUTICS API MARKET (BY VALUE)
- 16.1. Key Assumptions and Methodology
- 16.2. mRNA Therapeutics API Market, Till 2035
- 16.3. mRNA Therapeutics API Market: Distribution by Bioreactor
- 16.4. mRNA Therapeutics API Market: Distribution by Scale of Operation
- 16.5. mRNA Therapeutics API Market: Distribution by Manufacturer
- 16.6. mRNA Therapeutics API Market: Distribution by Geographical Regions
17. PROTEIN / PEPTIDE THERAPEUTICS API MARKET (BY VALUE)
- 17.1. Key Assumptions and Methodology
- 17.2. Protein / Peptide Therapeutics API Market, Till 2035
- 17.3. Protein / Peptide Therapeutics API Market: Distribution by Expression System
- 17.4. Protein / Peptide Therapeutics API Market: Distribution by Bioreactor
- 17.5. Protein / Peptide Therapeutics API Market: Distribution by Scale of Operation
- 17.6. Protein / Peptide Therapeutics API Market: Distribution by Manufacturer
- 17.7. Protein / Peptide Therapeutics API Market: Distribution by Geographical Region
18. CELL THERAPY API MARKET (BY VALUE)
- 18.1. Key Assumptions and Methodology
- 18.2. Cell Therapy API Market, Till 2035
- 18.3. Cell Therapy API Market: Distribution by Expression System
- 18.4. Cell Therapy API Market: Distribution by Bioreactor
- 18.5. Cell Therapy API Market: Distribution by Scale of Operation
- 18.6. Cell Therapy API Market: Distribution by Manufacturer
- 18.7. Cell Therapy API Market: Distribution by Type of Cell Therapy
- 18.8. Cell Therapy API Market: Distribution by Geographical Regions
19. GLOBAL BIOLOGICS API MARKET (BY VOLUME)
- 19.1. Key Assumptions and Methodology
- 19.2. Biologics API Market: Distribution by Type of Biologic
- 19.3. Biologics API Market for Monoclonal Antibodies
- 19.4. Biologics API Market for Protein / Peptide Therapeutics
- 19.5. Biologics API Market for Biosimilars
- 19.6. Biologics API Market for ADCs
- 19.7. Biologics API Market for Bispecific Antibodies
- 19.8. Biologics API Market for mRNA Therapeutics
- 19.9. Biologics API Market for Cell Therapies
- 19.10.Biologics API Market for Gene Therapies
20. GENE THERAPY API MARKET (BY VOLUME)
- 20.1. Key Assumptions and Methodology
- 20.2. Gene Therapy API Market, Forecasted Estimates (till 2035)
- 20.3. Gene Therapy API Market: Distribution by Expression System
- 20.4. Gene Therapy API Market: Distribution by Bioreactor
- 20.5. Gene Therapy API Market: Distribution by Scale of Operation
- 20.6. Gene Therapy API Market: Distribution by Manufacturer
- 20.7. Gene Therapy API Market: Distribution by Geographical Regions
21. CELL THERAPY API MARKET (BY VOLUME)
- 21.1. Key Assumptions and Methodology
- 21.2. Cell Therapy API Market, Forecasted Estimates (till 2035)
- 21.3. Cell Therapy API Market: Distribution by Expression System
- 21.4. Cell Therapy API Market: Distribution by Bioreactor
- 21.5. Cell Therapy API Market: Distribution by Scale of Operation
- 21.6. Cell Therapy API Market: Distribution by Manufacturer
- 21.7. Cell Therapy API Market: Distribution by Geographical Regions
22. DATA TRIANGULATION AND VALIDATION (BY VALUE AND VOLUME)
23. CONCLUDING REMARKS'
List of Figures
- Figure 2.1 Research Methodology: Project Methodology
- Figure 2.2 Research Methodology: Data Sources for Secondary Research
- Figure 2.3 Research Methodology: Robust Quality Control
- Figure 3.1 Market Dynamics: Forecast Methodology
- Figure 3.2 Market Dynamics: Market Assessment Framework
- Figure 3.3 Market Dynamics: Example List of Parameters
- Figure 4.1 Historical Analysis of Past Recessions and Lessons Learnt
- Figure 5.2 Executive Summary: Market Forecast and Opportunity Analysis
- Figure 6.1 Biologics API Market: Distribution by Type of Modality
- Figure 6.2 Biologics API Market: Distribution by Expression System
- Figure 6.3 Biologics API Market: Distribution by Bioreactor
- Figure 6.4 Biologics API Market: Distribution by Scale of Operation
- Figure 6.5 Biologics API Market: Distribution by Manufacturer
- Figure 6.6 Biologics API Market: Distribution by Geographical Regions
- Figure 7.1 ADC API Market, Forecasted Estimates (till 2035) (USD Billion)
- Figure 7.2 ADC API Market: Distribution by Expression System
- Figure 7.3 ADC API Market: Distribution by Bioreactor
- Figure 7.4 ADC API Market: Distribution by Scale of Operation
- Figure 7.5 ADC API Market: Distribution by Manufacturer
- Figure 7.6 ADC API Market: Distribution by Geographical Regions
- Figure 8.1 Gene Therapy API Market, Forecasted Estimates (till 2035) (USD Billion)
- Figure 8.2 Gene Therapy API Market: Distribution by Expression System
- Figure 8.3 Gene Therapy API Market: Distribution by Bioreactor
- Figure 8.4 Gene Therapy API Market: Distribution by Scale of Operation
- Figure 8.5 Gene Therapy API Market: Distribution by Manufacturer
- Figure 8.6 Gene Therapy API Market: Distribution by Geographical Regions
- Figure 9.1 Monoclonal Antibody API Market, Forecasted Estimates (till 2035) (USD Billion)
- Figure 9.2 Monoclonal Antibody API Market: Distribution by Expression System
- Figure 9.3 Monoclonal Antibody API Market: Distribution by Bioreactor
- Figure 9.4 Monoclonal Antibody API Market: Distribution by Scale of Operation
- Figure 9.5 Monoclonal Antibody API Market: Distribution by Manufacturer
- Figure 9.6 Monoclonal Antibody API Market: Distribution by Geographical Regions
- Figure 10.1 Biosimilar API Market, Forecasted Estimates (till 2035) (USD Billion)
- Figure 10.2 Biosimilar API Market: Distribution by Expression System
- Figure 10.3 Biosimilar API Market: Distribution by Bioreactor
- Figure 10.4 Biosimilar API Market: Distribution by Scale of Operation
- Figure 10.5 Biosimilar API Market: Distribution by Manufacturer
- Figure 10.6 Biosimilar API Market: Distribution by Modality
- Figure 10.7 Biosimilar API Market: Distribution by Geographical Regions
- Figure 11.1 Vaccine API Market, Forecasted Estimates (till 2035) (USD Billion)
- Figure 11.2 Vaccine API Market: Distribution by Expression System
- Figure 11.3 Vaccine API Market: Distribution by Bioreactor
- Figure 11.4 Vaccine API Market: Distribution by Scale of Operation
- Figure 11.5 Vaccine API Market: Distribution by Manufacturer
- Figure 11.6 Vaccine API Market: Distribution by Geographical Regions
- Figure 12.1 Bispecific Antibody API Market, Forecasted Estimates (till 2035) (USD Billion)
- Figure 12.2 Bispecific Antibody API Market: Distribution by Expression System
- Figure 12.3 Bispecific Antibody API Market: Distribution by Bioreactor
- Figure 12.4 Bispecific Antibody API Market: Distribution by Scale of Operation
- Figure 12.5 Bispecific Antibody API Market: Distribution by Manufacturer
- Figure 12.6 Bispecific Antibody API Market: Distribution by Geographical Regions
- Figure 13.1 mRNA Therapeutics API Market, Forecasted Estimates (till 2035) (USD Billion)
- Figure 13.2 mRNA Therapeutics API Market: Distribution by Bioreactor
- Figure 13.3 mRNA Therapeutics API Market: Distribution by Scale of Operation
- Figure 13.4 mRNA Therapeutics API Market: Distribution by Manufacturer
- Figure 13.5 mRNA Therapeutics API Market: Distribution by Geographical Regions
- Figure 14.1 Protein / Peptide Therapeutics API Market, Forecasted Estimates (till 2035) (USD Billion)
- Figure 14.2 Protein / Peptide Therapeutics API Market: Distribution by Expression System
- Figure 14.3 Protein / Peptide Therapeutics API Market: Distribution by Bioreactor
- Figure 14.4 Protein / Peptide Therapeutics API Market: Distribution by Scale of Operation
- Figure 14.5 Protein / Peptide Therapeutics API Market: Distribution by Manufacturer
- Figure 14.6 Protein / Peptide Therapeutics API Market: Distribution by Geographical Regions
- Figure 15.1 Cell Therapy API Market, Forecasted Estimates (till 2035) (USD Billion)
- Figure 15.2 Cell Therapy API Market: Distribution by Expression System
- Figure 15.3 Cell Therapy API Market: Distribution by Bioreactor
- Figure 15.4 Cell Therapy API Market: Distribution by Scale of Operation
- Figure 15.5 Cell Therapy API Market: Distribution by Manufacturer
- Figure 15.6 Cell Therapy API Market: Distribution by Cell Therapy
- Figure 15.7 Cell Therapy API Market: Distribution by Geographical Regions
- Figure 16.1 Biologics API Market (by Volume): Distribution by Type of Biologic
- Figure 16.2 Biologics API Market for Monoclonal Antibodies (Million Liters)
- Figure 16.3 Biologics API Market for Protein / Peptide Therapeutics (Million Liters)
- Figure 16.4 Biologics API Market for Biosimilars (Million Liters)
- Figure 16.5 Biologics API Market for ADCs (Million Liters)
- Figure 16.6 Biologics API Market for Bispecific Antibodies (Million Liters)
- Figure 16.7 Biologics API Market for mRNA Therapeutics (Million Liters)
- Figure 16.8 Biologics API Market for Cell Therapies (10^6 Cells)
- Figure 16.9 Biologics API Market for Gene Therapies (Liters)
- Figure 17.1 Gene Therapy API Market (by Volume), Forecasted Estimates (till 2035) (Liters)
- Figure 17.2 Gene Therapy API Market (by Volume): Distribution by Expression System
- Figure 17.3 Gene Therapy API Market (by Volume): Distribution by Bioreactor
- Figure 17.4 Gene Therapy API Market (by Volume): Distribution by Scale of Operation
- Figure 17.5 Gene Therapy API Market (by Volume): Distribution by Manufacturer
- Figure 17.6 Gene Therapy API Market (by Volume): Distribution by Geographical Regions
- Figure 18.1 Cell Therapy API Market (by Volume), Forecasted Estimates (till 2035) (10^6 Cells)
- Figure 18.2 Cell Therapy API Market (by Volume): Distribution by Expression System
- Figure 18.3 Cell Therapy API Market (by Volume): Distribution by Bioreactor
- Figure 18.4 Cell Therapy API Market (by Volume): Distribution by Scale of Operation
- Figure 18.5 Cell Therapy API Market (by Volume): Distribution by Manufacturer
- Figure 18.6 Cell Therapy API Market (by Volume): Distribution by Geographical Regions
 Carbamazepine市場 - 全球產業規模、佔有率、趨勢、機會、預測:銷售管道、最終用途、地區和競爭格局,2021-2031年原料藥市場-全球產業規模、佔有率、趨勢、機會與預測:按類型、最終用戶、地區和競爭格局分類,2021-2031年
 植物來源原料藥市場規模、佔有率和成長分析:按原料藥類型、原料、應用、治療領域、萃取方法、最終用戶和地區分類-2026-2033年產業預測青黴素G鈉市場 - 全球產業規模、佔有率、趨勢、機會、預測:銷售管道、最終用途、地區和競爭格局,2021-2031年下一代生物療法市場-全球產業規模、佔有率、趨勢、機會和預測:按治療領域、技術、地區和競爭格局分類,2021-2031年醫藥活性成分市場-全球產業規模、佔有率、趨勢、機會、預測:依合成類型、應用、地區和競爭格局分類,2021-2031年
 特種活性藥物成分市場分析與預測(至2035年):依類型、產品、服務、技術、應用、劑型、製程、最終用戶及階段分類
 曲唑酮市場:依產品類型、劑型、活性成分含量、適應症、通路及地區分類
 小分子原料藥市場:依生產技術、治療應用和最終用戶分類-2026-2032年全球市場預測活性成分市場:2026-2032年全球市場預測(依分子類型、原料、給藥途徑、產品類型、治療應用及用途分類)