


 |
市場調查報告書
商品編碼
2055601
一次性下游生物製程市場(第二版):按產品類型、企業規模、最終用戶和地區分類的趨勢和預測(至 2035 年)Single Use Downstream Bioprocessing Market (2nd Edition) by Type of Product, Scale of Operation, End User, and Geographical Regions - Trends and Forecast Till 2035 |
||||||
一次性下游生物製程市場概覽
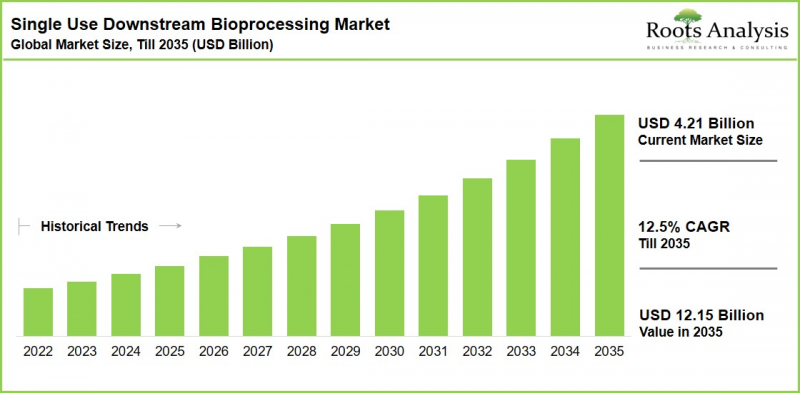
預計到 2035 年,全球一次性下游生物製程市場規模將以 12.5% 的年複合成長率成長,達到 121.5 億美元,高於目前的 42.1 億美元。
一次性下游生物製程市場:成長與趨勢
一次性下游生物製程系統正在變革製藥生產,使製藥公司和合約研發受託製造廠商(CDMO) 能夠靈活地根據不斷變化的生產需求調整生產規模。這些系統顯著減少了與清潔、滅菌、維護和製程客製化相關的停機時間,同時省去了就地清洗(CIP) 和原位蒸氣滅菌 (SIP) 驗證等高能耗程序。關鍵技術進步包括預裝式層析管柱、切向流過濾裝置和一次性膜吸附劑。
生物製藥生產中一次性技術的應用正穩定成長,近年來在下游生物製程尤其發展迅速。與傳統的不銹鋼系統相比,一次性解決方案具有許多優勢,包括降低資本投入、縮短設施設計和試運行週期。這些系統還能將專案前置作業時間縮短多達八個月,並提供更大的營運柔軟性,從而支援快速放大生產規模和製程客製化。
因此,無論是企業內部生產商或合約研發生產機構(CDMO),都在加速採用一次性系統,以高效管理小規模批量、個人化生產,並適應頻繁的產品切換。在不斷提高的採用率和技術持續進步的推動下,一次性下游生物製程市場預計將在整個預測期內保持強勁的成長勢頭。
成長要素:市場擴張的策略促進因素
生物製藥、疫苗和先進療法產品線的擴展推動了對靈活高效的下游解決方案的需求。因此,過濾、層析法和無菌取樣等關鍵純化製程正日益朝向一次性使用模式發展,從而實現更快的製程切換、更高的產品純度和更低的污染風險。
一次性層析管柱和過濾系統等技術提高了可靠性和質量,進一步增強了複雜生物分子的處理能力。同時,產業對永續性和成本最佳化的日益關注,正加速推動一次性系統的應用,因為這些系統具有許多優勢,包括減少資本投入和縮短設施前置作業時間。這些優勢使一次性技術成為提高營運效率和加快產品上市速度的最佳途徑。
市場挑戰:阻礙進展的主要障礙
儘管一次性生物製程的應用日益廣泛,但其市場仍面臨許多挑戰。一次性組件的萃取物和滲濾物可能對產品品質和法規遵循構成潛在風險。此外,可擴展性和機械強度方面的限制也可能限制其在大規模商業生產中的應用。對供應鏈的依賴以及組件短缺的風險也會進一步影響營運的連續性。與塑膠廢棄物處理相關的環境問題仍然是一項重大挑戰,尤其是在永續發展日益重要的今天。此外,不同一次性系統之間的標準化和相容性需求也持續為製造商帶來整合方面的挑戰。
本報告考察了全球一次性下游生物製程市場,提供了市場概述、背景、影響市場因素的分析、市場規模趨勢和預測、按各個細分市場進行的詳細分析、競爭格局以及主要公司的概況。
目錄
第1章 背景
第2章:調查方法
第3章 市場動態
- 章節概要
- 預測性調查方法
- 市場估值框架
- 預測工具和方法
- 重要考慮因素
- 限制
第4章 宏觀經濟指標
- 章節概要
- 市場動態
- 結論
第5章執行摘要
- 市場狀況
- 市場趨勢
- 市場預測與機會分析
第6章:引言
- 一次性下游生物製程技術概述
- 一次性下游生物製程技術的類型
- 傳統下游生物加工技術與新興下游生物製程技術之間的差異
- 一次下游生物製程技術的優勢
- 一次下游生物製程技術的應用
- 與一次性下游生物製程技術相關的關鍵挑戰
- 前景
第7章 市場概覽:一次性層析法系統
- 調查方法和關鍵參數
- 市場狀況
- 產品/設備尺寸
- 流速
- 容量
- 工作壓力
- 操作模式
- 重量
- 主要特點
- 洗脫方法相容性
- 企業規模
- 目的
- 發展公司的趨勢
- 成立年份
- 公司規模
- 總部所在地
- 主要開發公司
第8章 市場狀況:一次性過濾系統
- 調查方法和關鍵參數
- 市場狀況
- 濾孔尺寸
- 膜結構材料的類型
- 連接器類型
- 最高溫度
- 工作壓力
- 篩選類型
- 企業規模
- 主要特點
- 目的
- 發展公司的趨勢
- 成立年份
- 公司規模
- 總部所在地
- 主要開發公司
第9章 市場狀況:一次性採樣系統
- 調查方法和關鍵參數
- 市場狀況
- 抽樣單元的類型
- 滅菌方法
- 主要特點
- 體積
- 材質
- 發展公司的趨勢
- 成立年份
- 公司規模
- 總部所在地
- 主要開發公司
第10章 市場狀況:一次性連接器
- 調查方法和關鍵參數
- 市場狀況
- 閥門類型/性別
- 包裝尺寸
- 動作溫度
- 最終尺寸
- 結構材料
- 目的
- 發展公司的趨勢
- 成立年份
- 公司規模
- 總部所在地
- 主要開發公司
第11章 產品競爭力分析
- 調查方法和關鍵參數
- 評分標準
- 一次性層析法系統
- 一次性過濾系統
- 一次性採樣系統
- 免洗連接器
- 總部位於北美的開發公司提供的產品(Peer GroupI)
- 總部位於歐洲及其他地區的開發公司提供的產品(Peer GroupII)
第12章 公司簡介:一次性下游生物製程產品/系統供應商
- 章節概要
- 3M
- Asahi KASEI
- CPC (Colder Products Company)
- Cytiva Lifesciences
- Merck KGaA
- Sartorius
- Tezalon Biotech
- Thermo Fisher Scientific
第13章 專利分析
- 章節概要
- 研究範圍和調查方法
- 專利分析
- 專利基準分析
- 專利評估
第14章:品牌定位矩陣
- 章節概要
- 研究範圍和調查方法
- 關鍵參數
- 一次性層析法系統
- 3M
- Sartorius
- Tezalon Biotech
- 過濾過濾系統供應商
- Merck KGaA
- Sartorius
- Thermo Fisher Scientific
- Cytiva Lifesciences
- Tezalon Biotech
- Asahi Kasei
- 一次性採樣系統供應商
- Koefitt
- Advanced Microdevices
- WL Gore & Associates
- 一次性連接器提供者
- CPC (Colder Products Company)
- Cytiva Lifesciences
- Merck KGaA
第15章 供給與需求分析
- 章節概要
- 關鍵假設和調查方法
- 到2035年,全球對生物製藥的需求將如何改變?
- 結論
第16章 市場影響分析
- 章節概要
- 市場促進因素
- 市場限制因素
- 市場機遇
- 市場挑戰
- 結論
第17章:全球一次性下游生物製程市場
- 章節概要
- 關鍵假設和調查方法
- 全球一次性生物製程市場:趨勢與預測
- 關鍵市場區隔
第18章:一次性下游生物製程市場:依企業規模分類
- 章節概要
- 關鍵假設和調查方法
- 數據三角測量與檢驗
第19章 一次性下游生物製程市場:依設備類型分類
- 章節概要
- 關鍵假設和調查方法
- 數據三角測量與檢驗
第20章:一次性下游生物製程市場:依最終用戶分類
- 章節概要
- 關鍵假設和調查方法
- 數據三角測量與檢驗
第21章 北美一次性下游生物製程的市場機會
- 關鍵假設和調查方法
- 北美洲
- 美國
- 加拿大
- 滲透成長(PG)矩陣
- 市場波動分析
- 數據三角測量與檢驗
第22章 歐洲一次性下游生物製程的市場機會
- 關鍵假設和調查方法
- 歐洲
- 德國
- 英國
- 法國
- 俄羅斯
- 義大利
- 西班牙
- 其他
- 滲透成長(PG)矩陣
- 市場波動分析
- 數據三角測量與檢驗
第23章 亞太地區一次性下游生物製程的市場機會
- 關鍵假設和調查方法
- 亞太地區
- 中國
- 印度
- 日本
- 澳洲
- 其他
- 滲透成長(PG)矩陣
- 市場波動分析
- 數據三角測量與檢驗
第24章 世界其他地區一次性下游生物製程的市場機會
- 關鍵假設和調查方法
- 一次下游生物製程市場:趨勢與預測
- 巴西
- 阿根廷
- 其他
- 滲透成長(PG)矩陣
- 市場波動分析
- 數據三角測量與檢驗
第25章:鄰近市場分析
第26章 結論
第27章:高階主管洞察
第28章附錄1:表格形式數據
第29章 附錄2:公司與組織列表
Single Use Downstream Bioprocessing Market: Overview
As per Roots Analysis, the global single use downstream bioprocessing market is estimated to grow from USD 4.21 billion in the current year to USD 12.15 billion by 2035, at a CAGR of 12.5% during the forecast period, till 2035.
Single Use Downstream Bioprocessing Market: Growth and Trends
Single-use downstream bioprocessing systems are transforming pharmaceutical manufacturing by enabling both pharmaceutical companies and contract development and manufacturing organizations (CDMOs) to flexibly scale operations whether scaling out, up, or down in response to fluctuating production demands. These systems significantly reduce downtime associated with cleaning, sterilization, maintenance, and process customization, while eliminating energy-intensive procedures such as clean-in-place (CIP) and steam-in-place (SIP) validation. Key technological advancements include pre-packed chromatography columns, tangential flow filtration assemblies, and disposable membrane adsorbers.
The adoption of single-use technologies in biopharmaceutical manufacturing has witnessed consistent growth, with downstream bioprocessing experiencing particularly strong momentum in recent years. Compared to traditional stainless-steel systems, single-use solutions offer several advantages, including lower capital expenditure and faster facility design and commissioning timelines. These systems also help reduce project lead times by up to eight months while providing greater operational flexibility to support rapid scale-up and process customization.
As a result, both in-house manufacturers and CDMOs are increasingly integrating single-use systems to efficiently manage smaller, personalized batch sizes and accommodate frequent product changeovers. Supported by rising adoption rates and ongoing technological advancements, the single-use downstream bioprocessing market is expected to sustain a strong growth trajectory over the forecast period.
Growth Drivers: Strategic Enablers of Market Expansion
The expanding pipeline of biologics, vaccines, and advanced therapies is driving demand for flexible and efficient downstream processing solutions. Consequently, key purification steps such as filtration, chromatography, and aseptic sampling are increasingly shifting toward single-use formats, enabling faster changeovers, higher product purity, and reduced contamination risks.
Technologies such as disposable chromatography columns and filtration systems further enhance the processing of complex biomolecules with improved reliability and quality. In parallel, the industry's growing focus on sustainability and cost optimization is accelerating the adoption of single-use systems, given their lower capital investment and reduced facility lead times. These advantages are positioning single-use technologies as a preferred approach for streamlining operations and accelerating time-to-market.
Market Challenges: Critical Barriers Impeding Progress
The single-use bioprocessing market faces several challenges despite its growing adoption. Concerns around extractables and leachables from disposable components pose potential risks to product quality and regulatory compliance. Additionally, limitations in scalability and mechanical strength can restrict their use in large-volume commercial manufacturing. Supply chain dependencies and the risk of component shortages further impact operational continuity. Environmental concerns related to plastic waste disposal also remain a key issue, particularly as sustainability gains importance. Moreover, the need for standardization and compatibility across different single-use systems continues to present integration challenges for manufacturers.
Single Use Downstream Bioprocessing Market: Key Trends
The report delves into the current state of the single use downstream bioprocessing market and identifies potential growth opportunities within industry. Some key trends in the report include:
Accelerating Downstream Processing with Ready-to-Use Chromatography Solutions
The increasing adoption of single-use chromatography technologies is transforming downstream processing economics by replacing labor-intensive column packing procedures with pre-packed, pre-validated disposable columns and membrane adsorbers. This transition addresses the biopharmaceutical industry's growing need to minimize cross-contamination risks while significantly reducing the operational burden associated with cleaning validation of conventional stainless-steel systems In addition, next-generation membrane adsorbers provide substantially higher flow rates compared to traditional resin-based systems. They are increasingly being deployed in flow-through polishing applications for the rapid removal of viruses and DNA impurities, without the limitations of diffusive mass transfer.
These advancements are enhancing the operational flexibility of multi-product manufacturing facilities by enabling faster changeovers between monoclonal antibodies, viral vectors, and other biologics, thereby reducing turnaround times from weeks to days. Furthermore, the incorporation of RFID-enabled smart columns facilitates automated monitoring of cycle counts and resin utilization history, supporting streamlined regulatory compliance while optimizing the lifecycle management of high-value purification media prior to disposal.
Enhancing Product Recovery with Intelligent Single-Use Filtration Platforms
The single-use tangential flow filtration (TFF) market has progressed from manual, open-system operations to highly automated, closed-system platforms. Advanced single-use sensors integrated directly within the fluid pathway enable real-time monitoring and precise control of transmembrane pressure (TMP) and flow rates, thereby minimizing membrane fouling during the concentration of high-viscosity biologics.
To address the increasing demand for high-concentration biologic formulations, manufacturers are introducing innovative single-use filter capsules with scalable architectures capable of delivering consistent linear performance from laboratory-scale development through commercial manufacturing. These solutions simplify complex diafiltration workflows, improve product recovery rates, and enhance operator safety by reducing exposure to highly potent drug substances, a particularly critical requirement within the rapidly expanding antibody-drug conjugate (ADC) market.
Single Use Downstream Bioprocessing Market: Key Segments
Single Use Downstream Bioprocessing Market Analysis by Scale of Operation: Commercial Segment Leads Market Share
The global single use downstream bioprocessing market is segmented by scale of operation into preclinical, clinical, and commercial categories. Among these, the commercial segment is projected to dominate, accounting for approximately 85% of the total market share by 2035. This leadership position is primarily driven by the transition toward continuous manufacturing of approved therapeutics to address increasing commercial demand. As products progress from regulatory approval to large-scale production, there is a significant shift from small-batch manufacturing to high-volume output, thereby accelerating the demand for single use consumables and reinforcing the dominance of the commercial segment.
Operational Efficiency Drives Adoption of Single Use Chromatography Systems
Based on market forecasts, single use chromatography systems are expected to capture over 35% of the total market share by 2035. This growth is largely attributed to the rising need for flexible, multi-product manufacturing environments and the critical importance of minimizing cross-contamination risks in biopharmaceutical production. Additionally, single use centrifugation systems are anticipated to witness substantial growth over the forecast period. This expansion is supported by ongoing technological advancements that enable improved processing of high cell density cultures, particularly in applications such as cell and gene therapy harvesting.
Europe Maintains Leadership in the Global Market
Europe currently represents the largest regional market, contributing approximately 35% of the overall revenue share. This dominance can be attributed to the region's well-established biopharmaceutical manufacturing infrastructure and progressive regulatory landscape. Furthermore, the strong presence of leading industry players, including Sartorius Stedim Biotech and Merck, which have developed extensive manufacturing capabilities and implemented integrated single use platforms, has strengthened Europe's position. These efforts have also facilitated the standardization of single use technologies across global supply chains.
Asia-Pacific Emerged as the Fastest Growing Regional Market
The Asia-Pacific region is expected to register the highest growth rate during the forecast period, driven by its evolution into a key global biomanufacturing hub. The increasing adoption of hybrid manufacturing facilities combining traditional stainless-steel systems with single use technologies has enhanced operational flexibility and resilience. Moreover, the surge in greenfield investments across countries such as China and India is accelerating market growth. Manufacturers in the region are increasingly bypassing conventional infrastructure in favor of single use systems to localize production, optimize supply chains, and reduce time-to-market.
Example Players in Single Use Downstream Bioprocessing Market
- 3M
- CPC (Colder Products Company)
- Cytiva Lifesciences
- Merck KGaA
- Repligen
- Sartorius
- Tezalon Biotech
- Thermo Fisher Scientific
Single Use Downstream Bioprocessing Market: Research Coverage
- Market Sizing and Opportunity Analysis: The report features an in-depth analysis of the single use downstream bioprocessing market, focusing on key market segments, including [A] type of chromatography [B] type of product, [C] scale of operation, [D] end user, and [E] geographical regions.
- Single Use Chromatography Systems Market Landscape: A detailed assessment of the overall single use downstream bioprocessing market landscape, along with information on several relevant parameters, such as [A] product / device dimensions, [B] flow rate, [C] volume, [D] working pressure, [E] mode of operation, [F] weight, [G] key features, [H] elution method compatibility, [I] scale of operation, [J] application area, [K] year of establishment, [L] company size and [M] location of headquarters.
- Single Use Filtration Systems Market Landscape: A detailed assessment of the overall single use filtration systems market landscape, along with information on several relevant parameters, such as [A] filter pore size, [B] type of membrane construction material, [C] type of connector used, [D] maximum temperature, [E] working pressure, [F] type of filter, [G] scale of operation, [H] key features, [I] application area, [J] year of establishment, [K] company size, and [L] location of headquarters.
- Single Use Sampling Systems Market Landscape: A detailed assessment of the overall single use sampling systems market landscape, along with information on several relevant parameters, such as [A] type of sampling unit, [B] method of sterilization, [C] key features, [D] volume, [E] tubing material, [F] year of establishment, [G] company size, and [H] location of headquarters.
- Single Use Connectors Market Landscape: A detailed assessment of the overall single use connectors market landscape, along with information on several relevant parameters, such as [A] type of valve / gender, [B] pack size, [C] operating temperature, [D] termination size, [E] material of construction, [F] application area, [G] year of establishment, [H] company size and [I] location of headquarters.
- Product Competitiveness Analysis: An in-depth product competitiveness analysis of single use downstream bioprocessing market based on various relevant parameters, such as [A] company strength, and [B] product strength.
- Company Profiles: In-depth profiles of key companies based in North America, Europe and Asia-Pacific based on several parameters such as [A] year of establishment, [B] location of headquarters, [C] product portfolio, [D] recent developments and [E] an informed future outlook.
- Patent Analysis: A detailed analysis of the patents that have been filed / granted based on important parameters such as, [A] type of patent, [B] publication year, [C] application year, [D] number of granted patents and patent applications, [E] patent jurisdiction, [F] CPC symbols, [G] patent age, [H] type of applicant, and [I] individual patent assignees (in terms of size of intellectual property portfolio).
- Brand Positioning Matrix: A comprehensive evaluation of the brand positioning matrix is conducted based on key parameters such as [A] price, [B] quality, [C] product differentiation, [D] target customer segment, [E] competitive intensity, [F] perceived value, [G] brand equity, and [H] market positioning relative to competitors.
- Demand and Supply Analysis: A comprehensive assessment of demand and supply dynamics is conducted based on key parameters such as [A] market demand trends, and [B] demand-supply gap, [F] pricing trends, [G] distribution channels, and [H] key market participants. This analysis facilitates the identification of potential imbalances, growth opportunities, and strategic interventions to optimize market equilibrium.
- Market Impact Analysis: An in-depth analysis of the factors that can impact the growth of the market. It also features identification and analysis of key drivers, potential restraints, emerging opportunities, and existing challenges in this domain.
Key Questions Answered in this Report
- Which are the leading companies in the single use downstream bioprocessing market?
- Which region dominates the single use downstream bioprocessing market?
- What are the key trends observed in the single use downstream bioprocessing market?
- What factors are likely to influence the evolution of this market?
- What are the primary challenges faced by single use downstream bioprocessing product and system providers?
- What is the current and future market size?
- What is the CAGR of this market?
- How is the current and future market opportunity likely to be distributed across key market segments?
Reasons to Buy this Report
- The report provides a comprehensive market analysis, offering detailed revenue projections of the overall market and its specific sub-segments. This information is valuable to both established market leaders and emerging entrants.
- The report offers stakeholders a comprehensive overview of the market, including key drivers, barriers, opportunities, and challenges. This information empowers stakeholders to stay abreast of market trends and make data-driven decisions to capitalize on growth prospects.
- The report can aid businesses in identifying future opportunities in any sector. It also helps in understanding if those opportunities are worth pursuing.
- The report helps in identifying customer demand by understanding the needs, preferences, and behavior of the target audience in order to tailor products or services effectively.
- The report equips new entrants with requisite information regarding a particular market to help them build successful business strategies.
- The report allows for more effective communication with the audience and in building strong business relations.
Additional Benefits
- Complementary PPT Insights Pack
- Complimentary Excel Data Packs for all Analytical Modules in the Report
- 15% Free Content Customization
- Detailed Report Walkthrough Session with Research Team
- Free Updated report if the report is 6-12 months old or older
TABLE OF CONTENTS
1 BACKGROUND
- 1.1. Context
- 1.2. Project Objectives
2. RESEARCH METHODOLOGY
- 2.1. Chapter Overview
- 2.2. Research Assumptions
- 2.2.1. Market Landscape and Market Trends
- 2.2.2. Market Forecast and Opportunity Analysis
- 2.2.3. Comparative Analysis
- 2.3. Database Building
- 2.3.1. Data Collection
- 2.3.2. Data Validation
- 2.3.3. Data Analysis
- 2.4. Project Methodology
- 2.4.1. Secondary Research
- 2.4.1.1. Annual Reports
- 2.4.1.2. Academic Research Papers
- 2.4.1.3. Company Websites
- 2.4.1.4. Investor Presentations
- 2.4.1.5. Regulatory Filings
- 2.4.1.6. White Papers
- 2.4.1.7. Industry Publications
- 2.4.1.8. Conferences and Seminars
- 2.4.1.9. Government Portals
- 2.4.1.10. Media and Press Releases
- 2.4.1.11. Newsletters
- 2.4.1.12. Industry Databases
- 2.4.1.13. Roots Proprietary Databases
- 2.4.1.14. Paid Databases and Sources
- 2.4.1.15. Social Media Portals
- 2.4.1.16. Other Secondary Sources
- 2.4.2. Primary Research
- 2.4.2.1. Types of Primary Research
- 2.4.2.1.1. Qualitative Research
- 2.4.2.1.2. Quantitative Research
- 2.4.2.1.3. Hybrid Approach
- 2.4.2.2. Advantages of Primary Research
- 2.4.2.3. Techniques for Primary Research
- 2.4.2.3.1. Interviews
- 2.4.2.3.2. Surveys
- 2.4.2.3.3. Focus Groups
- 2.4.2.3.4. Observational Research
- 2.4.2.3.5. Social Media Interactions
- 2.4.2.4. Key Opinion Leaders Considered in Primary Research
- 2.4.2.4.1. Company Executives (CXOs)
- 2.4.2.4.2. Board of Directors
- 2.4.2.4.3. Company Presidents and Vice Presidents
- 2.4.2.4.4. Research and Development Heads
- 2.4.2.4.5. Technical Experts
- 2.4.2.4.6. Subject Matter Experts
- 2.4.2.4.7. Scientists
- 2.4.2.4.8. Doctors and Other Healthcare Providers
- 2.4.2.5. Ethics and Integrity
- 2.4.2.5.1. Research Ethics
- 2.4.2.5.2. Data Integrity
- 2.4.2.1. Types of Primary Research
- 2.4.3. Analytical Tools and Databases
- 2.4.1. Secondary Research
- 2.5. Robust Quality Control
3. MARKET DYNAMICS
- 3.1. Chapter Overview
- 3.2. Forecast Methodology
- 3.2.1. Top-down Approach
- 3.2.2. Bottom-up Approach
- 3.2.3. Hybrid Approach
- 3.3. Market Assessment Framework
- 3.3.1. Total Addressable Market (TAM)
- 3.3.2. Serviceable Addressable Market (SAM)
- 3.3.3. Serviceable Obtainable Market (SOM)
- 3.3.4. Currently Acquired Market (CAM)
- 3.4. Forecasting Tools and Techniques
- 3.4.1. Qualitative Forecasting
- 3.4.2. Correlation
- 3.4.3. Regression
- 3.4.4. Extrapolation
- 3.4.5. Convergence
- 3.4.6. Sensitivity Analysis
- 3.4.7. Scenario Planning
- 3.4.8. Data Visualization
- 3.4.9. Time Series Analysis
- 3.4.10. Forecast Error Analysis
- 3.5. Key Considerations
- 3.5.1. Demographics
- 3.5.2. Government Regulations
- 3.5.3. Reimbursement Scenarios
- 3.5.4. Market Access
- 3.5.5. Supply Chain
- 3.5.6. Industry Consolidation
- 3.5.7. Pandemic / Unforeseen Disruptions Impact
- 3.6. Limitations
4. MACRO-ECONOMIC INDICATORS
- 4.1. Chapter Overview
- 4.2. Market Dynamics
- 4.2.1. Time Period
- 4.2.1.1. Historical Trends
- 4.2.1.2. Current and Forecasted Estimates
- 4.2.2. Currency Coverage
- 4.2.2.1. Major Currencies Affecting the Market
- 4.2.2.2. Factors Affecting Currency Fluctuations
- 4.2.2.3. Impact of Currency Fluctuations on the Industry
- 4.2.3. Foreign Currency Exchange Rate
- 4.2.3.1. Impact of Foreign Exchange Rate Volatility on the Market
- 4.2.3.2. Strategies for Mitigating Foreign Exchange Risk
- 4.2.4. Recession
- 4.2.4.1. Assessment of Current Economic Conditions and Potential Impact on the Market
- 4.2.5. Inflation
- 4.2.5.1. Measurement and Analysis of Inflationary Pressures in the Economy
- 4.2.5.2. Potential Impact of Inflation on the Market Evolution
- 4.2.6. Interest Rates
- 4.2.6.1. Interest Rates and Their Impact on the Market
- 4.2.6.2. Strategies for Managing Interest Rate Risk
- 4.2.7. Commodity Flow Analysis
- 4.2.7.1. Type of Commodity
- 4.2.7.2. Origins and Destinations
- 4.2.7.3. Value and Weights
- 4.2.7.4. Modes of Transportation
- 4.2.8. Global Trade Dynamics
- 4.2.8.1. Import Scenario
- 4.2.8.2. Export Scenario
- 4.2.8.3. Trade Policies
- 4.2.8.4. Strategies for Mitigating the Risks Associated with Trade Barriers
- 4.2.8.5. Impact of Trade Barriers on the Market
- 4.2.9. War Impact Analysis
- 4.2.9.1. Russian-Ukraine War
- 4.2.9.2. Israel-Hamas War
- 4.2.10. COVID Impact / Related Factors
- 4.2.10.1. Global Economic Impact
- 4.2.10.2. Industry-specific Impact
- 4.2.10.3. Government Response and Stimulus Measures
- 4.2.10.4. Future Outlook and Adaptation Strategies
- 4.2.11. Other Indicators
- 4.2.11.1. Fiscal Policy
- 4.2.11.2. Consumer Spending
- 4.2.11.3. Gross Domestic Product
- 4.2.11.4. Employment
- 4.2.11.5. Taxes
- 4.2.11.6. Stock Market Performance
- 4.2.11.7. Cross-Border Dynamics
- 4.2.1. Time Period
- 4.3. Conclusion
5. EXECUTIVE SUMMARY
- 5.1. Executive Summary: Market Landscape
- 5.2. Executive Summary: Market Trends
- 5.3. Executive Summary: Market Forecast and Opportunity Analysis
6. INTRODUCTION
- 6.1. Overview of Single Use Downstream Bioprocessing Technology
- 6.2. Type of Single Use Downstream Bioprocessing Technology
- 6.3. Differences between Conventional and Emerging Downstream Bioprocessing Technology
- 6.4. Advantages of Single Use Downstream Bioprocessing Technology
- 6.5. Applications of Single Use Downstream Bioprocessing Technology
- 6.6. Key Challenges Associated with Single Use Downstream Bioprocessing Technology
- 6.7. Future Perspective
7. MARKET LANDSCAPE: SINGLE USE CHROMATOGRAPHY SYSTEMS
- 7.1. Methodology and Key Parameters
- 7.2. Single Use Chromatography Systems: Overall Market Landscape
- 7.2.1. Analysis by Product / Device Dimensions
- 7.2.2. Analysis by Flow Rate
- 7.2.3. Analysis by Volume
- 7.2.4. Analysis by Working Pressure
- 7.2.5. Analysis by Mode of Operation
- 7.2.6. Analysis by Weight
- 7.2.7. Analysis by Key Features
- 7.2.8. Analysis by Elution Method Compatibility
- 7.2.9. Analysis by Scale of Operation
- 7.2.10. Analysis by Application Area
- 7.3. Single Use Chromatography Systems: Developer Landscape
- 7.3.1. Analysis by Year of Establishment
- 7.3.2. Analysis by Company Size
- 7.3.3. Analysis by Location of Headquarters
- 7.3.4. Leading Developers: Analysis by Number of Single Use Chromatography Systems
8. MARKET LANDSCAPE: SINGLE USE FILTRATION SYSTEMS
- 8.1. Methodology and Key Parameters
- 8.2. Single Use Filtration Systems: Overall Market Landscape
- 8.2.1. Analysis by Filter Pore Size
- 8.2.2. Analysis by Type of Membrane Construction Material
- 8.2.3. Analysis by Type of Connector Used
- 8.2.4. Analysis by Maximum Temperature
- 8.2.5. Analysis by Working Pressure
- 8.2.6. Analysis by Type of Filter
- 8.2.7. Analysis by Scale of Operation
- 8.2.8. Analysis by Key Features
- 8.2.9. Analysis by Application Area
- 8.3. Single Use Filtration Systems: Developer Landscape
- 8.3.1. Analysis by Year of Establishment
- 8.3.2. Analysis by Company Size
- 8.3.3. Analysis by Location of Headquarters
- 8.3.4. Leading Developers: Analysis by Number of Single Use Filtration Systems
9. MARKET LANDSCAPE: SINGLE USE SAMPLING SYSTEMS
- 9.1. Methodology and Key Parameters
- 9.2. Single Use Sampling Systems: Overall Market Landscape
- 9.2.1. Analysis by Type of Sampling Unit
- 9.2.2. Analysis by Method of Sterilization
- 9.2.3. Analysis by Key Features
- 9.2.4. Analysis by Volume
- 9.2.5. Analysis by Tubing Material
- 9.3. Single Use Sampling Systems: Developer Landscape
- 9.3.1. Analysis by Year of Establishment
- 9.3.2. Analysis by Company Size
- 9.3.3. Analysis by Location of Headquarters
- 9.3.4. Leading Developers: Analysis by Number of Single Use Sampling Systems
10. MARKET LANDSCAPE: SINGLE USE CONNECTORS
- 10.1. Methodology and Key Parameters
- 10.2. Single Use Connectors: Overall Market Landscape
- 10.2.1. Analysis by Type of Valve / Gender
- 10.2.2. Analysis by Pack size
- 10.2.3. Analysis by Operating Temperature
- 10.2.4. Analysis by Termination Size
- 10.2.5. Analysis by Material of Construction
- 10.2.6. Analysis by Application Area
- 10.3. Single Use Connectors: Developer Landscape
- 10.3.1. Analysis by Year of Establishment
- 10.3.2. Analysis by Company Size
- 10.3.3. Analysis by Location of Headquarters
- 10.3.4. Leading Developers: Analysis by Number of Single Use Connectors
11. PRODUCT COMPETITIVENESS ANALYSIS
- 11.1. Methodology and Key Parameters
- 11.2. Scoring Criteria
- 11.3. Single Use Chromatography Systems: Product Competitiveness Analysis
- 11.3.1. Single Use Chromatography Systems Offered by Developers Headquartered in North America (Peer Group I)
- 11.3.2. Single Use Chromatography Systems Offered by Developers Headquartered in Europe and Rest of the World (Peer Group II)
- 11.4. Single Use Filtration Systems: Product Competitiveness Analysis
- 11.4.1. Single Use Filtration Systems Offered by Developers Headquartered in North America (Peer Group I)
- 11.4.2. Single Use Filtration Systems Offered by Developers Headquartered in Europe and Rest of the World (Peer Group II)
- 11.5. Single Use Sampling Systems: Product Competitiveness Analysis
- 11.5.1. Single Use Sampling Systems Offered by Developers Headquartered in North America (Peer Group I)
- 11.5.2. Single Use Sampling Systems Offered by Developers Headquartered in Europe and Rest of the World (Peer Group II)
- 11.6. Single Use Connectors: Product Competitiveness Analysis
- 11.6.1. Single Use Connectors Offered by Developers Headquartered in North America (Peer Group I)
- 11.6.2. Single Use Connectors Offered by Developers Headquartered in Europe and Rest of the World (Peer Group II)
12. COMPANY PROFILES: SINGLE USE DOWNSTREAM BIOPROCESSING PRODUCT / SYSTEM PROVIDERS
- 12.1. Chapter Overview
- 12.2. 3M
- 12.2.1. Company Overview
- 12.2.2. Financial Information
- 12.2.3. Company Offerings
- 12.2.4. Product Portfolio
- 12.2.5. Roots Analysis View
- 12.3. Asahi KASEI
- 12.3.1. Company Overview
- 12.3.2. Financial Information
- 12.3.3. Company Offerings
- 12.3.4. Product Portfolio
- 12.3.5. Roots Analysis View
- 12.4. CPC (Colder Products Company)
- 12.4.1. Company Overview
- 12.4.2. Financial Information
- 12.4.3. Company Offerings
- 12.4.4. Product Portfolio
- 12.4.5. Roots Analysis View
- 12.5. Cytiva Lifesciences
- 12.5.1. Company Overview
- 12.5.2. Financial Information
- 12.5.3. Company Offerings
- 12.5.4. Product Portfolio
- 12.5.5. Roots Analysis View
- 12.6. Merck KGaA
- 12.6.1. Company Overview
- 12.6.2. Financial Information
- 12.6.3. Company Offerings
- 12.6.4. Product Portfolio
- 12.6.5. Roots Analysis View
- 12.7. Sartorius
- 12.7.1. Company Overview
- 12.7.2. Financial Information
- 12.7.3. Company Offerings
- 12.7.4. Product Portfolio
- 12.7.5. Roots Analysis View
- 12.8. Tezalon Biotech
- 12.8.1. Company Overview
- 12.8.2. Company Offerings
- 12.8.3. Product Portfolio
- 12.8.4. Roots Analysis View
- 12.9. Thermo Fisher Scientific
- 12.9.1. Company Overview
- 12.9.2. Financial Information
- 12.9.3. Company Offerings
- 12.9.4. Product Portfolio
- 12.8.5. Roots Analysis View
13. PATENT ANALYSIS
- 13.1. Chapter Overview
- 13.2. Scope and Methodology
- 13.3. Single use Downstream Bioprocessing: Patent Analysis
- 13.3.1. Analysis by Patent Publication Year
- 13.3.2. Analysis by Type of Patent and Publication Year
- 13.3.3. Analysis by Patent Application Year
- 13.3.4. Analysis by Patent Jurisdiction
- 13.3.5. Analysis by CPC Symbols
- 13.3.6. Analysis by Type of Applicant
- 13.3.7. Leading Players: Analysis by Number of Patents
- 13.3.8. Leading Inventors: Analysis by Number of Patents
- 13.4. Patent Benchmarking Analysis
- 13.4.1. Analysis by Patent Characteristics
- 13.5. Patent Valuation
14. BRAND POSITIONING MATRIX
- 14.1. Chapter Overview
- 14.2. Scope and Methodology
- 14.3. Key Parameters
- 14.4. Brand Positioning Matrix: Single Use Filtration System Providers
- 14.4.1. Brand Positioning Matrix: 3M
- 14.4.2. Brand Positioning Matrix: Sartorius
- 14.4.3. Brand Positioning Matrix: Tezalon Biotech
- 14.5. Brand Positioning Matrix: Single Use Filtration System Providers
- 14.5.1. Brand Positioning Matrix: Merck KGaA
- 14.5.2. Brand Positioning Matrix: Sartorius
- 14.5.3. Brand Positioning Matrix: Thermo Fisher Scientific
- 14.5.4. Brand Positioning Matrix: Cytiva Lifesciences
- 14.5.5. Brand Positioning Matrix: Tezalon Biotech
- 14.5.6. Brand Positioning Matrix: Asahi Kasei
- 14.6. Brand Positioning Matrix: Single Use Sampling System Providers
- 14.6.1. Brand Positioning Matrix: Koefitt
- 14.6.2. Brand Positioning Matrix: Advanced Microdevices
- 14.6.3. Brand Positioning Matrix: W. L. Gore & Associates
- 14.7. Brand Positioning Matrix: Single Use Connector Provider
- 14.7.1. Brand Positioning Matrix: CPC (Colder Products Company)
- 14.7.2. Brand Positioning Matrix: Cytiva Lifesciences
- 14.7.3. Brand Positioning Matrix: Merck KGaA
15. DEMAND AND SUPPLY ANALYSIS
- 15.1. Chapter Overview
- 15.2. Key Assumptions and Methodology
- 15.3. Global Demand for Biologics, till 2035
- 15.3.1. Demand Vs Supply Scenario 1
- 15.3.2. Demand Vs Supply Scenario 2
- 15.3.3. Demand Vs Supply Scenario 3
- 15.4. Concluding Remarks
16. MARKET IMPACT ANALYSIS
- 16.1. Chapter Overview
- 16.2. Market Drivers
- 16.3. Market Restraints
- 16.4. Market Opportunities
- 16.5. Market Challenges
- 16.6. Conclusion
17. GLOBAL SINGLE USE DOWNSTREAM BIOPROCESSING MARKET
- 17.1. Chapter Overview
- 17.2. Key Assumptions and Methodology
- 17.3. Global Single Use Downstream Bioprocessing Market, Historical Trends (since 2022) and Forecasted Estimates (till 2035)
- 17.3.1. Scenario Analysis
- 17.3.1.1. Conservative Scenario
- 17.3.1.2. Optimistic Scenario
- 17.3.1. Scenario Analysis
- 17.4. Key Market Segmentation
18. SINGLE USE DOWNSTREAM BIOPROCESSING MARKET, BY SCALE OF OPERATION
- 18.1. Chapter Overview
- 18.2. Key Assumptions and Methodology
- 18.2.1. Single Use Downstream Bioprocessing Market: Distribution by Scale of Operation
- 18.2.1.1. Single Use Downstream Bioprocessing Market for Preclinical and Clinical Operation, Historical Trends (Since 2022) and Forecasted Estimates (till 2035)
- 18.2.1.2. Single Use Downstream Bioprocessing Market for Commercial Operation, Historical Trends (Since 2022) and Forecasted Estimates (till 2035)
- 18.2.1. Single Use Downstream Bioprocessing Market: Distribution by Scale of Operation
- 18.3. Data Triangulation and Validation
19. SINGLE USE DOWNSTREAM BIOPROCESSING MARKET, BY TYPE OF EQUIPMENT
- 19.1. Chapter Overview
- 19.2. Key Assumptions and Methodology
- 19.2.1. Single Use Downstream Bioprocessing Market: Distribution by Type of Equipment
- 19.2.1.1. Single Use Downstream Bioprocessing Market for Single Use Chromatography Systems, Historical Trends (Since 2022) and Forecasted Estimates (till 2035)
- 19.2.1.2. Single Use Downstream Bioprocessing Market for Single Use Filtration Systems, Historical Trends (Since 2022) and Forecasted Estimates (till 2035)
- 19.2.1.3. Single Use Downstream Bioprocessing Market for Single Use Connectors, Historical Trends (Since 2022) and Forecasted Estimates (till 2035)
- 19.2.1.4. Single Use Downstream Bioprocessing Market for Single Use Sampling Systems, Historical Trends (Since 2022) and Forecasted Estimates (till 2035)
- 19.2.1.5. Single Use Downstream Bioprocessing Market for Single Use Centrifugation Systems, Historical Trends (Since 2022) and Forecasted Estimates (till 2035)
- 19.2.1.6. Single Use Downstream Bioprocessing Market for Other Single Use Systems, Historical Trends (Since 2022) and Forecasted Estimates (till 2035)
- 19.2.1. Single Use Downstream Bioprocessing Market: Distribution by Type of Equipment
- 18.3. Data Triangulation and Validation
20. SINGLE USE DOWNSTREAM BIOPROCESSING MARKET, BY END USER
- 20.1. Chapter Overview
- 20.2. Key Assumptions and Methodology
- 20.2.1. Single Use Downstream Bioprocessing Market: Distribution by End User
- 20.2.1.1. Single Use Downstream Bioprocessing Market for Pharma and Biopharmaceutical Companies, Historical Trends (Since 2022) and Forecasted Estimates (till 2035)
- 20.2.1.2. Single Use Downstream Bioprocessing Market for CROs and CMOs, Historical Trends (Since 2022) and Forecasted Estimates (till 2035)
- 20.2.1.3. Single Use Downstream Bioprocessing Market for Other End Users, Historical Trends (Since 2022) and Forecasted Estimates (till 2035)
- 20.2.1. Single Use Downstream Bioprocessing Market: Distribution by End User
- 20.3. Data Triangulation and Validation
21. MARKET OPPORTUNITIES FOR SINGLE USE DOWNSTREAM BIOPROCESSING IN NORTH AMERICA
- 21.1. Key Assumptions and Methodology
- 21.2. Single Use Downstream Bioprocessing Market in North America: Historical Trends (Since 2022) and Forecasted Estimates (Till 2035)
- 21.2.1. Single Use Downstream Bioprocessing Market in the US: Historical Trends (Since 2022) and Forecasted Estimates (Till 2035)
- 21.2.2. Single Use Downstream Bioprocessing Market in Canada: Historical Trends (Since 2022) and Forecasted Estimates (Till 2035)
- 21.2.3. Penetration Growth (P-G) Matrix
- 21.2.4. Market Movement Analysis
- 21.3. Data Triangulation and Validation
22. MARKET OPPORTUNITIES FOR SINGLE USE DOWNSTREAM BIOPROCESSING IN EUROPE
- 22.1. Key Assumptions and Methodology
- 22.2. Single Use Downstream Bioprocessing Market in Europe: Historical Trends (Since 2022) and Forecasted Estimates (Till 2035)
- 22.2.1. Single Use Downstream Bioprocessing Market in Germany: Historical Trends (Since 2022) and Forecasted Estimates (Till 2035)
- 22.2.2. Single Use Downstream Bioprocessing Market in the UK: Historical Trends (Since 2022) and Forecasted Estimates (Till 2035)
- 22.2.3. Single Use Downstream Bioprocessing Market in France: Historical Trends (Since 2022) and Forecasted Estimates (Till 2035)
- 22.2.4. Single Use Downstream Bioprocessing Market in Russia: Historical Trends (Since 2022) and Forecasted Estimates (Till 2035)
- 22.2.5. Single Use Downstream Bioprocessing Market in Italy: Historical Trends (Since 2022) and Forecasted Estimates (Till 2035)
- 22.2.6. Single Use Downstream Bioprocessing Market in Spain: Historical Trends (Since 2022) and Forecasted Estimates (Till 2035)
- 22.2.7. Single Use Downstream Bioprocessing Market in Rest of Europe: Historical Trends (Since 2022) and Forecasted Estimates (Till 2035)
- 22.2.8. Penetration Growth (P-G) Matrix
- 22.2.9. Market Movement Analysis
- 22.3. Data Triangulation and Validation
23. MARKET OPPORTUNITIES FOR SINGLE USE DOWNSTREAM BIOPROCESSING IN ASIA-PACIFIC
- 23.1. Key Assumptions and Methodology
- 23.2. Single Use Downstream Bioprocessing Market in Asia-Pacific: Historical Trends (Since 2022) and Forecasted Estimates (Till 2035)
- 23.2.1. Single Use Downstream Bioprocessing Market in China: Historical Trends (Since 2022) and Forecasted Estimates (Till 2035)
- 23.2.2. Single Use Downstream Bioprocessing Market in India: Historical Trends (Since 2022) and Forecasted Estimates (Till 2035)
- 23.2.3. Single Use Downstream Bioprocessing Market in Japan: Historical Trends (Since 2022) and Forecasted Estimates (Till 2035)
- 23.2.4. Single Use Downstream Bioprocessing Market in Australia: Historical Trends (Since 2022) and Forecasted Estimates (Till 2035)
- 23.2.6. Single Use Downstream Bioprocessing Market in Rest of Asia-Pacific: Historical Trends (Since 2022) and Forecasted Estimates (Till 2035)
- 23.2.7. Penetration Growth (P-G) Matrix
- 23.2.8. Market Movement Analysis
- 23.3. Data Triangulation and Validation
24. MARKET OPPORTUNITIES FOR SINGLE USE DOWNSTREAM BIOPROCESSING IN REST OF THE WORLD
- 24.1. Key Assumptions and Methodology
- 24.2. Single Use Downstream Bioprocessing Market in Rest of the World: Historical Trends (Since 2022) and Forecasted Estimates (Till 2035)
- 24.2.1. Single Use Downstream Bioprocessing Market in Brazil: Historical Trends (Since 2022) and Forecasted Estimates (Till 2035)
- 24.2.2. Single Use Downstream Bioprocessing Market in Argentina: Historical Trends (Since 2022) and Forecasted Estimates (Till 2035)
- 24.2.3. Single Use Downstream Bioprocessing Market in Other Countries: Historical Trends (Since 2022) and Forecasted Estimates (Till 2035)
- 24.2.4. Penetration Growth (P-G) Matrix
- 24.2.5. Market Movement Analysis
- 24.3. Data Triangulation and Validation
25. ADJACENT MARKET ANALYSIS
26. CONCLUDING INSIGHTS
27. EXECUTIVE INSIGHTS
28. APPENDIX 1: TABULATED DATA
29. APPENDIX 2: LIST OF COMPANIES AND ORGANIZATIONS
List of Tables
- Table 7.1. List of Single-use Chromatography Systems Providers
- Table 7.2. Single-use Chromatography Systems: Information on Product Portfolio
- Table 8.1. List of Single Use Filtration Systems Providers
- Table 8.2. Single Use Filtration Systems: Information on Product Portfolio
- Table 9.1. List of Single Use Sampling Systems Providers
- Table 9.2. Single Use Sampling Systems: Information on Product Portfolio
- Table 10.1. List of Single Use Connectors Providers
- Table 10.2. Single Use Connectors: Information on Product Portfolio
- Table 12.1. 3M: Product Portfolio
- Table 12.2. Asahi KASEI: Product Portfolio
- Table 12.3. CPC (Colder Products Company): Product Portfolio
- Table 12.4. Cytiva Lifesciences: Product Portfolio
- Table 12.5. Merck KGaA: Product Portfolio
- Table 12.6. Sartorius: Product Portfolio
- Table 12.7. Tezalon Biotech: Product Portfolio
- Table 12.8. Thermo Fisher Scientific: Product Portfolio
- Table 13.1. List of Published Patents
- Table 28.1. Single Use Chromatography Systems: Distribution by Product / Device Dimensions (cm)
- Table 28.2. Single Use Chromatography Systems: Distribution by Flow Rate (L/min)
- Table 28.3. Single Use Chromatography Systems: Distribution by Volume (L)
- Table 28.4. Single Use Chromatography Systems: Distribution by Working Pressure (Bar)
- Table 28.5. Single Use Chromatography Systems: Distribution by Mode of Operation
- Table 28.6. Single Use Chromatography Systems: Distribution by Weight (Kg)
- Table 28.7. Single Use Chromatography Systems: Distribution by Key Features
- Table 28.8. Single Use Chromatography Systems: Distribution by Elution Method Compatibility
- Table 28.9. Single Use Chromatography Systems: Distribution by Scale of Operation
- Table 28.10. Single Use Chromatography Systems: Distribution of Application Area
- Table 28.11. Single Use Chromatography Systems: Distribution of Developers by Year of Establishment
- Table 28.12. Single Use Chromatography Systems: Distribution of Developers by Company Size
- Table 28.13. Single Use Chromatography Systems: Distribution of Developers by Location of Headquarters
- Table 28.14. Leading Developers: Distribution by Number of Single Use Chromatography Systems
- Table 28.15. Single Use Filtration Systems: Distribution by Filter Pore Size (µm)
- Table 28.16. Single Use Filtration Systems: Distribution by Membrane Construction Material
- Table 28.17. Single Use Filtration Systems: Distribution by Type of Connectors Used
- Table 28.18. Single Use Filtration Systems: Distribution by Maximum Temperature (oC)
- Table 28.19. Single Use Filtration Systems: Distribution by Working Pressure (Bar)
- Table 28.20. Single Use Filtration Systems: Distribution by Type of Filters
- Table 28.21. Single Use Filtration Systems: Distribution by Scale of Operation
- Table 28.22. Single Use Filtration Systems: Distribution by Key Features
- Table 28.23. Single Use Filtration Systems: Distribution by Application Area
- Table 28.24. Single Use Filtration Systems: Distribution by Year of Establishment
- Table 28.25. Single Use Filtration Systems: Distribution by Company Size
- Table 28.26. Single Use Filtration Systems: Distribution by Location of Headquarters
- Table 28.27. Leading Developers: Distribution by Number of Single Use Filtration Systems
- Table 28.28. Single Use Sampling Systems: Distribution by Type of Sampling Unit
- Table 28.29. Single Use Sampling Systems: Distribution by Method of Sterilization
- Table 28.30. Single Use Sampling Systems: Distribution by Key Features
- Table 28.31. Single Use Sampling Systems: Distribution by Volume (ml)
- Table 28.32. Single Use Sampling Systems: Distribution by Tubing Material
- Table 28.33. Single Use Sampling Systems: Distribution by Year of Establishment
- Table 28.34. Single Use Sampling Systems: Distribution by Company Size
- Table 28.35. Single Use Sampling Systems: Distribution by Location of Headquarters
- Table 28.36. Leading Developers: Distribution by Number of Single Use Sampling Systems
- Table 28.37. Single Use Connectors: Distribution by Type of Valve / Gender
- Table 28.38. Single Use Connectors: Distribution by Pack Size (pieces)
- Table 28.39. Single Use Connectors: Distribution by Operating Temperature (oC)
- Table 28.40. Single Use Connectors: Distribution by Termination Size
- Table 28.41. Single Use Connectors: Distribution by Material of Construction
- Table 28.42. Single Use Connectors: Distribution by Application Area
- Table 28.43. Single Use Connectors: Distribution by Year of Establishment
- Table 28.44. Single Use Connectors: Distribution by Company Size
- Table 28.45. Single Use Connectors: Distribution by Location of Headquarters
- Table 28.46. Leading Developers: Distribution by Number of Single Use Connectors
- Table 28.47. 3M: Annual Revenues, Since 2023 (USD Billion)
- Table 28.48. Asahi Kasei: Annual Revenues, Since 2023 (YEN Billion)
- Table 28.49. CPC: Annual Revenues, Since 2023 (USD Million)
- Table 28.50. Cytiva Lifesciences: Annual Revenues, Since 2023 (USD Billion)
- Table 28.51. Merck KGaA: Annual Revenues, Since 2023 (EUR Million)
- Table 28.52. Sartorius: Annual Revenues, Since 2023 (EUR Million)
- Table 28.53. Thermo Fisher Scientific: Annual Revenues, Since 2023 (USD Million)
- Table 28.54. Patent Analysis: Distribution by Publication Year
- Table 28.55. Patent Analysis: Distribution by Type of Patent
- Table 28.56. Patent Analysis: Distribution by Type of Patent and Publication Year
- Table 28.57. Patent Analysis: Distribution by Application Year
- Table 28.58. Patent Analysis: Distribution by Patent Age
- Table 28.59. Patent Analysis: Distribution by Type of Applicant
- Table 28.60. Patent Analysis: Distribution by Patent Jurisdiction
- Table 28.61. Patent Analysis: Distribution by CPC Symbols
- Table 28.62. Leading Players: Analysis by Number of Patents
- Table 28.63. Leading Individual Assignees: Analysis by Number of Patents
- Table 28.64. Global Demand and Supply Analysis for Biologics, till 2035
- Table 28.65. Demand and Supply: Distribution by Likely Scenarios (Scenario 1), till 2035
- Table 28.66. Demand and Supply: Distribution by Likely Scenarios (Scenario 2), till 2035
- Table 28.67. Demand and Supply: Distribution by Likely Scenarios (Scenario 3), till 2035
- Table 28.68. Single Use Downstream Bioprocessing Market, Historical Trends (Since 2022) and Forecasted Estimates (Till 2035): Base. Scenario (USD Billion)
- Table 28.69. Single Use Downstream Bioprocessing Market, Forecasted Estimates (Till 2035): Conservative Scenario (USD Billion)
- Table 28.70. Single Use Downstream Bioprocessing Market, Forecasted Estimates (Till 2035): Optimistic Scenario (USD Billion)
- Table 28.71. Single Use Downstream Bioprocessing Market: Distribution by Scale of Operation
- Table 28.72. Single Use Downstream Bioprocessing Market for Preclinical and Clinical Operation, Historical Trends (Since 2022) and Forecasted Estimates (Till 2035): Conservative, Base and Optimistic Scenarios (USD Billion)
- Table 28.73. Single Use Downstream Bioprocessing Market for Commercial Operation, Historical Trends (Since 2022) and Forecasted Estimates (Till 2035): Conservative, Base and Optimistic Scenarios (USD Billion)
- Table 28.74. Single Use Downstream Bioprocessing Market: Distribution by Type of Equipment
- Table 28.75. Single Use Downstream Bioprocessing Market for Single Use Chromatography Systems, Historical Trends (Since 2022) and Forecasted Estimates (Till 2035): Conservative, Base and Optimistic Scenarios (USD Billion)
- Table 28.76. Single Use Downstream Bioprocessing Market for Single Use Filtration Systems, Historical Trends (Since 2022) and Forecasted Estimates (Till 2035): Conservative, Base and Optimistic Scenarios (USD Billion)
- Table 28.77. Single Use Downstream Bioprocessing Market for Single Use Connectors, Historical Trends (Since 2022) and Forecasted Estimates (Till 2035): Conservative, Base and Optimistic Scenarios (USD Billion)
- Table 28.78. Single Use Downstream Bioprocessing Market for Single Use Sampling Systems, Historical Trends (Since 2022) and Forecasted Estimates (Till 2035): Conservative, Base and Optimistic Scenarios (USD Billion)
- Table 28.79. Single Use Downstream Bioprocessing Market for Single Use Centrifugation Systems, Historical Trends (Since 2022) and Forecasted Estimates (Till 2035): Conservative, Base and Optimistic Scenarios (USD Billion)
- Table 28.80. Single Use Downstream Bioprocessing Market for Other Single Use Systems, Historical Trends (Since 2022) and Forecasted Estimates (Till 2035): Conservative, Base and Optimistic Scenarios (USD Billion)
- Table 28.81. Single Use Downstream Bioprocessing Market: Distribution by End User
- Table 28.82. Single Use Downstream Bioprocessing Market for Pharma and Biopharmaceutical Companies, Historical Trends (Since 2022) and Forecasted Estimates (Till 2035): Conservative, Base and Optimistic Scenarios (USD Billion)
- Table 28.83. Single Use Downstream Bioprocessing Market for CROs and CMOs, Historical Trends (Since 2022) and Forecasted Estimates (Till 2035): Conservative, Base and Optimistic Scenarios (USD Billion)
- Table 28.84. Single Use Downstream Bioprocessing Market for Other End Users, Historical Trends (Since 2022) and Forecasted Estimates (Till 2035): Conservative, Base and Optimistic Scenarios (USD Billion)
- Table 28.85. Single Use Downstream Bioprocessing Market in North America, Historical Trends (Since 2022) and Forecasted Estimates (Till 2035): Conservative, Base and Optimistic Scenarios (USD Billion)
- Table 28.86. Single Use Downstream Bioprocessing Market in the US, Historical Trends (Since 2022) and Forecasted Estimates (Till 2035): Conservative, Base and Optimistic Scenarios (USD Billion)
- Table 28.87. Single Use Downstream Bioprocessing Market in Canada, Historical Trends (Since 2022) and Forecasted Estimates (Till 2035): Conservative, Base and Optimistic Scenarios (USD Billion)
- Table 28.88. Single Use Downstream Bioprocessing Market in Europe, Historical Trends (Since 2022) and Forecasted Estimates (Till 2035): Conservative, Base and Optimistic Scenarios (USD Billion)
- Table 28.89. Single Use Downstream Bioprocessing Market in Germany, Historical Trends (Since 2022) and Forecasted Estimates (Till 2035): Conservative, Base and Optimistic Scenarios (USD Billion)
- Table 28.90. Single Use Downstream Bioprocessing Market in the UK, Historical Trends (Since 2022) and Forecasted Estimates (Till 2035): Conservative, Base and Optimistic Scenarios (USD Billion)
- Table 28.91. Single Use Downstream Bioprocessing Market in France, Historical Trends (Since 2022) and Forecasted Estimates (Till 2035): Conservative, Base and Optimistic Scenarios (USD Billion)
- Table 28.92. Single Use Downstream Bioprocessing Market in Russia, Historical Trends (Since 2022) and Forecasted Estimates (Till 2035): Conservative, Base and Optimistic Scenarios (USD Billion)
- Table 28.93. Single Use Downstream Bioprocessing Market in Italy, Historical Trends (Since 2022) and Forecasted Estimates (Till 2035): Conservative, Base and Optimistic Scenarios (USD Billion)
- Table 28.94. Single Use Downstream Bioprocessing Market in Spain, Historical Trends (Since 2022) and Forecasted Estimates (Till 2035): Conservative, Base and Optimistic Scenarios (USD Billion)
- Table 28.95. Single Use Downstream Bioprocessing Market in Rest of Europe, Historical Trends (Since 2022) and Forecasted Estimates (Till 2035): Conservative, Base and Optimistic Scenarios (USD Billion)
- Table 28.96. Single Use Downstream Bioprocessing Market in Asia-Pacific, Historical Trends (Since 2022) and Forecasted Estimates (Till 2035): Conservative, Base and Optimistic Scenarios (USD Billion)
- Table 28.97. Single Use Downstream Bioprocessing Market in China, Historical Trends (Since 2022) and Forecasted Estimates (Till 2035): Conservative, Base and Optimistic Scenarios (USD Billion)
- Table 28.98. Single Use Downstream Bioprocessing Market in India, Historical Trends (Since 2022) and Forecasted Estimates (Till 2035): Conservative, Base and Optimistic Scenarios (USD Billion)
- Table 28.99. Single Use Downstream Bioprocessing Market in Japan, Historical Trends (Since 2022) and Forecasted Estimates (Till 2035): Conservative, Base and Optimistic Scenarios (USD Billion)
- Table 28.100. Single Use Downstream Bioprocessing Market in Australia, Historical Trends (Since 2022) and Forecasted Estimates (Till 2035): Conservative, Base and Optimistic Scenarios (USD Billion)
- Table 28.101. Single Use Downstream Bioprocessing Market in Rest of Asia-Pacific, Historical Trends (Since 2022) and Forecasted Estimates (Till2035): Conservative, Base and Optimistic Scenarios (USD Billion)
- Table 28.102. Single Use Downstream Bioprocessing Market in Rest of the World, Historical Trends (Since 2022) and Forecasted Estimates (Till 2035): Conservative, Base and Optimistic Scenarios (USD Billion)
- Table 28.103. Single Use Downstream Bioprocessing Market in Brazil, Historical Trends (Since 2022) and Forecasted Estimates (Till 2035): Conservative, Base and Optimistic Scenarios (USD Billion)
- Table 28.104. Single Use Downstream Bioprocessing Market in Argentina, Historical Trends (Since 2022) and Forecasted Estimates (Till 2035): Conservative, Base and Optimistic Scenarios (USD Billion)
- Table 28.105. Single Use Downstream Bioprocessing Market in Other Countries, Historical Trends (Since 2022) and Forecasted Estimates (Till 2035): Conservative, Base and Optimistic Scenarios (USD Billion)
List of Figures
- Figure 2.1 Research Methodology: Project Methodology
- Figure 2.2 Research Methodology: Data Sources for Secondary Research
- Figure 2.3 Research Methodology: Robust Quality Control
- Figure 3.1 Market Dynamics: Forecast Methodology
- Figure 3.2 Market Dynamics: Market Assessment Framework
- Figure 4.1 Lessons Learnt from Past Recessions
- Figure 5.1 Executive Summary: Market Landscape
- Figure 5.2 Executive Summary: Market Trends
- Figure 5.3 Executive Summary: Market Sizing and Opportunity Analysis
- Figure 7.1. Single Use Chromatography Systems: Distribution by Product / Device Dimensions (cm)
- Figure 7.2. Single Use Chromatography Systems: Distribution by Flow Rate (L/min)
- Figure 7.3. Single Use Chromatography Systems: Distribution by Volume (L)
- Figure 7.4. Single Use Chromatography Systems: Distribution by Working Pressure (Bar)
- Figure 7.5. Single Use Chromatography Systems: Distribution by Mode of Operation
- Figure 7.6. Single Use Chromatography Systems: Distribution by Weight (Kg)
- Figure 7.7. Single Use Chromatography Systems: Distribution by Key Features
- Figure 7.8. Single Use Chromatography Systems: Distribution by Elution Method Compatibility
- Figure 7.9. Single Use Chromatography Systems: Distribution by Scale of Operation
- Figure 7.10. Single Use Chromatography Systems: Distribution of Application Area
- Figure 7.11. Single Use Chromatography Systems: Distribution of Developers by Year of Establishment
- Figure 7.12. Single Use Chromatography Systems: Distribution of Developers by Company Size
- Figure 7.13. Single Use Chromatography Systems: Distribution of Developers by Location of Headquarters
- Figure 7.14. Leading Developers: Distribution by Number of Single Use Chromatography Systems
- Figure 8.1. Single Use Filtration Systems: Distribution by Filter Pore Size (µm)
- Figure 8.2. Single Use Filtration Systems: Distribution by Membrane Construction Material
- Figure 8.3. Single Use Filtration Systems: Distribution by Type of Connectors Used
- Figure 8.4. Single Use Filtration Systems: Distribution by Maximum Temperature (oC)
- Figure 8.5. Single Use Filtration Systems: Distribution by Working Pressure (Bar)
- Figure 8.6. Single Use Filtration Systems: Distribution by Type of Filters
- Figure 8.7. Single Use Filtration Systems: Distribution by Scale of Operation
- Figure 8.8. Single Use Filtration Systems: Distribution by Key Features
- Figure 8.9. Single Use Filtration Systems: Distribution by Application Area
- Figure 8.10. Single Use Filtration Systems: Distribution by Year of Establishment
- Figure 8.11. Single Use Filtration Systems: Distribution by Company Size
- Figure 8.12. Single Use Filtration Systems: Distribution by Location of Headquarters
- Figure 8.13. Leading Developers: Distribution by Number of Single Use Filtration Systems
- Figure 9.1. Single Use Sampling Systems: Distribution by Type of Sampling Unit
- Figure 9.2. Single Use Sampling Systems: Distribution by Method of Sterilization
- Figure 9.3. Single Use Sampling Systems: Distribution by Key Features
- Figure 9.4. Single Use Sampling Systems: Distribution by Volume (ml)
- Figure 9.5. Single Use Sampling Systems: Distribution by Tubing Material
- Figure 9.6. Single Use Sampling Systems: Distribution by Year of Establishment
- Figure 9.7. Single Use Sampling Systems: Distribution by Company Size
- Figure 9.8. Single Use Sampling Systems: Distribution by Location of Headquarters
- Figure 9.9. Leading Developers: Distribution by Number of Single Use Sampling Systems
- Figure 10.1. Single Use Connectors: Distribution by Type of Valve / Gender
- Figure 10.2. Single Use Connectors: Distribution by Pack Size (pieces)
- Figure 10.3. Single Use Connectors: Distribution by Operating Temperature (oC)
- Figure 10.4. Single Use Connectors: Distribution by Termination Size
- Figure 10.5. Single Use Connectors: Distribution by Material of Construction
- Figure 10.6. Single Use Connectors: Distribution by Application Area
- Figure 10.7. Single Use Connectors: Distribution by Year of Establishment
- Figure 10.8. Single Use Connectors: Distribution by Company Size
- Figure 10.9. Single Use Connectors: Distribution by Location of Headquarters
- Figure 10.10. Leading Developers: Distribution by Number of Single Use Connectors
- Figure 11.1. Product Competitiveness Analysis: Single Use Chromatography System Offered by Developers Headquartered in North America (Peer Group I)
- Figure 11.2. Product Competitiveness Analysis: Single Use Chromatography System Offered by Developers Headquartered in Europe and Rest of the World (Peer Group II)
- Figure 11.3. Product Competitiveness Analysis: Single Use Filter Offered by Developers Headquartered in North America (Peer Group I)
- Figure 11.4. Product Competitiveness Analysis: Single Use Filter Offered by Developers Headquartered in Europe and Rest of the World (Peer Group II)
- Figure 11.5. Product Competitiveness Analysis: Single Use Sampling System Offered by Developers Headquartered in North America (Peer Group I)
- Figure 11.6. Product Competitiveness Analysis: Single Use Filter Offered by Developers Headquartered in Europe and Rest of the World (Peer Group II)
- Figure 11.7. Product Competitiveness Analysis: Single Use Connector Offered by Developers Headquartered in North America (Peer Group I)
- Figure 11.8. Product Competitiveness Analysis: Single Use Connector Offered by Developers Headquartered in Europe and Rest of the World (Peer Group II)
- Figure 12.1. 3M: Annual Revenues, Since 2023 (USD Billion)
- Figure 12.2. Asahi Kasei: Annual Revenues, Since 2023 (YEN Billion)
- Figure 12.3. CPC: Annual Revenues, Since 2023 (USD Million)
- Figure 12.4. Cytiva Lifesciences: Annual Revenues, Since 2023 (USD Billion)
- Figure 12.5. Merck KGaA: Annual Revenues, Since 2023 (EUR Million)
- Figure 12.6. Sartorius: Annual Revenues, Since 2023 (EUR Million)
- Figure 12.7. Thermo Fisher Scientific: Annual Revenues, Since 2023 (USD Million)
- Figure 13.1. Patent Analysis: Distribution by Publication Year
- Figure 13.2. Patent Analysis: Distribution by Type of Patent
- Figure 13.3. Patent Analysis: Distribution by Type of Patent and Publication Year
- Figure 13.4. Patent Analysis: Distribution by Application Year
- Figure 13.5. Patent Analysis: Distribution by Patent Age
- Figure 13.6. Patent Analysis: Distribution by Type of Applicant
- Figure 13.7. Patent Analysis: Distribution by Patent Jurisdiction
- Figure 13.8. Patent Analysis: Distribution by CPC Symbols
- Figure 13.9. Leading Players: Analysis by Number of Patents
- Figure 13.10. Leading Individual Assignees: Analysis by Number of Patents
- Figure 14.1. Brand Positioning Matrix of Single Use Chromatography System Providers: 3M
- Figure 14.2. Brand Positioning Matrix of Single Use Chromatography System Providers: Sartorius
- Figure 14.3. Brand Positioning Matrix of Single Use Chromatography System Providers: Tezalon Biotech
- Figure 14.4. Brand Positioning Matrix of Single Use Filtration System Providers: Merck KGaA
- Figure 14.5. Brand Positioning Matrix of Single Use Filtration System Providers: Sartorius
- Figure 14.6. Brand Positioning Matrix of Single Use Filtration System Providers: Thermo Fisher Scientific
- Figure 14.7. Brand Positioning Matrix of Single Use Filtration System Providers: Cytiva Lifesciences
- Figure 14.8. Brand Positioning Matrix of Single Use Filtration System Providers: Tezalon Biotech
- Figure 14.9. Brand Positioning Matrix of Single Use Filtration System Providers: Asahi Kasei
- Figure 14.10. Brand Positioning Matrix of Single Use Sampling System Providers: Koefitt
- Figure 14.11. Brand Positioning Matrix of Single Use Sampling System Providers: Advanced Microdevices
- Figure 14.12. Brand Positioning Matrix of Single Use Sampling System Providers: W. L. Gore & Associates
- Figure 14.13. Brand Positioning Matrix of Single Use Filtration System Providers: Asahi Kasei
- Figure 14.14. Brand Positioning Matrix of Single Use Sampling System Providers: CPC (Colder Products Company)
- Figure 14.15. Brand Positioning Matrix of Single Use Sampling System Providers: Cytiva Lifesciences
- Figure 14.16. Brand Positioning Matrix of Single Use Sampling System Providers: Merck KGaA
- Figure 15.1. Global Demand and Supply Analysis for Biologics, till 2035
- Figure 15.2. Demand and Supply: Distribution by Likely Scenarios (Scenario 1), till 2035
- Figure 15.3. Demand and Supply: Distribution by Likely Scenarios (Scenario 2), till 2035
- Figure 15.4. Demand and Supply: Distribution by Likely Scenarios (Scenario 3), till 2035
- Figure 17.1 Single Use Downstream Bioprocessing Market, Historical Trends (Since 2022) and Forecasted Estimates (Till 2035): Base Scenario (USD Billion)
- Figure 17.2 Single Use Downstream Bioprocessing Market, Forecasted Estimates (Till 2035): Conservative Scenario (USD Billion)
- Figure 17.3 Single Use Downstream Bioprocessing Market, Forecasted Estimates (Till 2035): Optimistic Scenario (USD Billion)
- Figure 18.1 Single Use Downstream Bioprocessing Market: Distribution by Scale of Operation
- Figure 18.2 Single Use Downstream Bioprocessing Market for Preclinical and Clinical Operation, Historical Trends (Since 2022) and Forecasted Estimates (till 2035)
- Figure 18.3 Single Use Downstream Bioprocessing Market for Commercial Operation, Historical Trends (Since 2022) and Forecasted Estimates (till 2035
- Figure 19.1 Single Use Downstream Bioprocessing Market: Distribution by Type of Equipment
- Figure 19.2 Single Use Downstream Bioprocessing Market for Single Use Chromatography Systems, Historical Trends (Since 2022) and Forecasted Estimates (till 2035)
- Figure 19.3 Single Use Downstream Bioprocessing Market for Single Use Filtration Systems, Historical Trends (Since 2022) and Forecasted Estimates (till 2035)
- Figure 19.4 Single Use Downstream Bioprocessing Market for Single Use Connectors, Historical Trends (Since 2022) and Forecasted Estimates (till 2035)
- Figure 19.5 Single Use Downstream Bioprocessing Market for Single Use Sampling Systems, Historical Trends (Since 2022) and Forecasted Estimates (till 2035)
- Figure 19.6 Single Use Downstream Bioprocessing Market for Single Use Centrifugation Systems, Historical Trends (Since 2022) and Forecasted Estimates (till 2035)
- Figure 19.7 Single Use Downstream Bioprocessing Market for Other Single Use Systems, Historical Trends (Since 2022) and Forecasted Estimates (till 2035)
- Figure 20.1 Single Use Downstream Bioprocessing Market: Distribution by End User
- Figure 20.2 Single Use Downstream Bioprocessing Market for Pharma and Biopharmaceutical Companies, Historical Trends (Since 2022) and Forecasted Estimates (till 2035)
- Figure 20.3 Single Use Downstream Bioprocessing Market for CROs and CMOs, Historical Trends (Since 2022) and Forecasted Estimates (till 2035)
- Figure 20.4 Single Use Downstream Bioprocessing Market for Other End Users, Historical Trends (Since 2022) and Forecasted Estimates (till 2035)
- Figure 21.1 Single Use Downstream Bioprocessing Market in North America, Historical Trends (Since 2022) and Forecasted Estimates (Till 2035)
- Figure 21.2 Single Use Downstream Bioprocessing Market in the US, Historical Trends (Since 2022) and Forecasted Estimates (Till 2035)
- Figure 21.3 Single Use Downstream Bioprocessing Market in Canada, Historical Trends (Since 2022) and Forecasted Estimates (Till 2035)
- Figure 22.1 Single Use Downstream Bioprocessing Market in Europe, Historical Trends (Since 2022) and Forecasted Estimates (Till 2035)
- Figure 22.2 Single Use Downstream Bioprocessing Market in Germany, Historical Trends (Since 2022) and Forecasted Estimates (Till 2035)
- Figure 22.3 Single Use Downstream Bioprocessing Market in the UK, Historical Trends (Since 2022) and Forecasted Estimates (Till 2035)
- Figure 22.4 Single Use Downstream Bioprocessing Market in France, Historical Trends (Since 2022) and Forecasted Estimates (Till 2035)
- Figure 22.5 Single Use Downstream Bioprocessing Market in Russia, Historical Trends (Since 2022) and Forecasted Estimates (Till 2035)
- Figure 22.6 Single Use Downstream Bioprocessing Market in Italy, Historical Trends (Since 2022) and Forecasted Estimates (Till 2035)
- Figure 22.7 Single Use Downstream Bioprocessing Market in Spain, Historical Trends (Since 2022) and Forecasted Estimates (Till 2035)
- Figure 22.8 Single Use Downstream Bioprocessing Market in Rest of Europe, Historical Trends (Since 2022) and Forecasted Estimates (Till 2035)
- Figure 23.1 Single Use Downstream Bioprocessing Market in Asia-Pacific, Historical Trends (Since 2022) and Forecasted Estimates (Till 2035)
- Figure 23.2 Single Use Downstream Bioprocessing Market in China, Historical Trends (Since 2022) and Forecasted Estimates (Till 2035)
- Figure 23.3 Single Use Downstream Bioprocessing Market in India, Historical Trends (Since 2022) and Forecasted Estimates (Till 2035)
- Figure 23.4 Single Use Downstream Bioprocessing Market in Japan, Historical Trends (Since 2022) and Forecasted Estimates (Till 2035)
- Figure 23.5 Single Use Downstream Bioprocessing Market in Australia, Historical Trends (Since 2022) and Forecasted Estimates (Till 2035)
- Figure 23.6 Single Use Downstream Bioprocessing Market in Rest of Asia-Pacific, Historical Trends (Since 2022) and Forecasted Estimates (Till 2035)
- Figure 24.1 Single Use Downstream Bioprocessing Market in Rest of the World, Historical Trends (Since 2022) and Forecasted Estimates (Till 2035)
- Figure 24.2 Single Use Downstream Bioprocessing Market in Brazil, Historical Trends (Since 2022) and Forecasted Estimates (Till 2035)
- Figure 24.3 Single Use Downstream Bioprocessing Market in Argentina, Historical Trends (Since 2022) and Forecasted Estimates (Till 2035)
- Figure 24.4 Single Use Downstream Bioprocessing Market in Other Countries, Historical Trends (Since 2022) and Forecasted Estimates (Till 2035)
 全球生物製程市場規模、佔有率、趨勢和成長分析報告(2026-2034年)
 生物製程自動化市場規模、佔有率和趨勢分析報告:按產品/服務、製程階段、最終用途、地區和細分市場分類(2026-2033 年)
 生物程序技術市場:2026-2032年全球市場預測(按技術、工藝類型、規模、應用和最終用戶分類)閉迴路生物製程市場規模、佔有率和趨勢分析報告:按產品、應用、最終用途、地區和細分市場預測(2026-2033 年)全球生物加工技術市場規模、佔有率、趨勢和成長分析報告(2026-2034年)全球生物過程分析儀器市場規模、佔有率、趨勢和成長分析報告(2026-2034)
 全球連續生物製程市場:依產品、應用、最終用途及地區劃分的分析-市場規模、產業趨勢、機會分析及2026年至2035年預測
 生物加工技術市場規模、佔有率和成長分析(按產品類型、製程、技術、應用、最終用戶和地區分類)-2026-2033年產業預測生物製程自動化軟體市場規模、佔有率和趨勢分析報告:按類型、應用、最終用途、地區和細分市場預測(2025-2033 年)
 生物製程自動化市場:產業趨勢及全球預測 - 依控制器類型、業務規模、操作模式、與生物處理系統的兼容性、主要地區