

 |
市場調查報告書
商品編碼
2037828
虛擬健身市場(至2035年):按課程類型、串流媒體類型、設備類型、收入模式、健身類型、最終用戶、地區和主要參與者分類:行業趨勢和全球市場預測Virtual Fitness Market, Till 2035: Distribution by Type of Session, Type of Streaming, Type of Device, Type of Revenue Model, Type of Fitness Genre, End-User, Geographical Regions, and Leading Players: Industry Trends and Global Forecasts |
||||||
虛擬健身市場展望
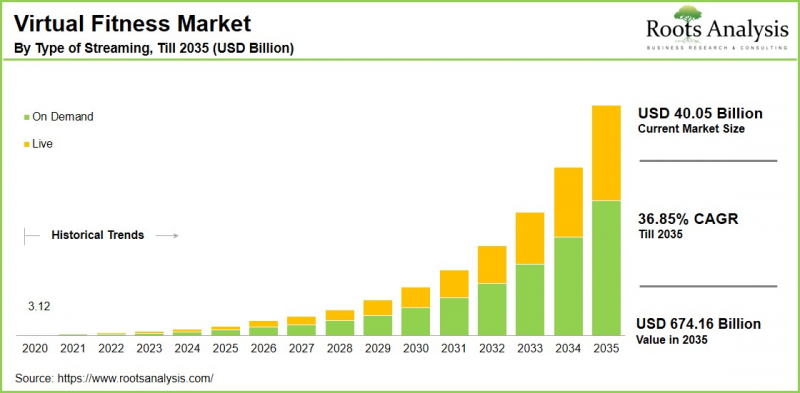
根據 Roots Analysis 的研究,預計到 2035 年,全球虛擬健身市場將以 36.85% 的複合年成長率成長,從今年的 400.5 億美元成長到 2035 年的 6741.6 億美元。
虛擬健身市場正經歷顯著成長,這主要得益於人們健康意識的提高和數位技術的廣泛應用。世界衛生組織(WHO)的數據顯示,約有18億成年人未能達到建議的運動量,凸顯了便利健身解決方案的巨大需求。這一缺口,加上網路科技的進步,正在加速虛擬健身平台的興起。使用者可以透過智慧型手機和筆記型電腦輕鬆存取直播或點播的健身課程,再加上靈活的課程安排,這些都是推動用戶接受虛擬健身平台的關鍵因素。
在智慧型手機普及、人們對靈活健身方式的需求日益成長以及人工智慧和穿戴式裝置等先進技術融合的推動下,虛擬健身市場持續擴張。虛擬健身平台如今提供個人化的訓練和營養計劃,顯著提升了用戶參與度和健身效果。此外,高強度間歇訓練(HIIT)、瑜珈和舞蹈類健身方式的日益普及也大大促進了數位健身服務的成長。綜上所述,這些因素表明虛擬健身已發展成為全球健康生態系統中一個永續的重要組成部分。
虛擬健身市場成長的關鍵市場促進因素
在人們對健康和健身日益成長的興趣,以及按需健身平台等數位技術的不斷進步的推動下,虛擬健身正逐漸成為現代生活方式的重要組成部分。市場成長的主要驅動力是各類終端使用者(包括企業、國防機構、教育機構、個人、專業健身房和體育組織)對健康生活方式的日益重視。此外,人們對均衡營養和身體健身的日益關注預計將在塑造線上健身解決方案的未來方面發揮關鍵作用。透過智慧型手機和筆記型電腦輕鬆存取結構化健身課程,以及高效且便利的課程形式,預計將成為在預測期內持續推動市場成長的關鍵因素。
虛擬健身市場:競爭格局
虛擬健身市場競爭激烈,市場動態瞬息萬變,既有老牌跨國公司,也有新興企業紛紛湧入。業內各公司都在積極尋求透過持續創新和服務改進來增強自身競爭優勢。小規模企業豐富了市場多樣性,而大型企業則憑藉強大的品牌影響力和資源佔了相當大的市場佔有率。這些領導企業不斷推出新服務、建立策略夥伴關係並整合先進功能,以提升用戶體驗並維持市場領先地位。
虛擬健身市場的新趨勢
在科技創新和消費者期望不斷變化的影響下,虛擬健身市場正經歷著快速變革。其中一個最顯著的新興趨勢是人工智慧和數據分析的融合,這使得高度個人化的鍛鍊和營養計畫能夠根據個人的運動表現、偏好和健康指標量身定做。借助互聯設備和即時回饋系統,高度個人化的健身解決方案的興起顯著提升了使用者的參與度和鍛鍊效果。此外,虛擬實境(VR)和擴增實境(AR)等身臨其境型技術的引入,透過提供互動式、遊戲化的健身環境,正在重新定義健身體驗。
另一個重要趨勢是穿戴式健身設備和智慧型裝置的日益普及。這些設備能夠實現持續的健康監測,並與虛擬平台無縫整合。此外,人們對混合健身模式的日益偏好反映了生活方式的改變和對柔軟性的需求。總而言之,這些趨勢以及不斷擴展的數位健身正在將虛擬健身打造成為更廣泛的健康和保健產業中一個數據驅動、個人化和技術驅動的細分領域。
北美在虛擬健身市場處於領先地位。
今年,北美在全球虛擬健身市場佔有最大佔有率。其主導地位得益於完善的數位基礎設施和高度精通技術的消費者群體。疫情期間及之後,隨著消費者積極採用數位健身解決方案以適應時間緊迫的生活方式和不斷變化的工作模式,該地區的虛擬健身市場顯著擴張。此外,網路平台與健身服務的整合提高了便利性和可近性,從而推動了全部區域的持續成長。
同時,亞太地區預計在預測期內將維持較高的複合年成長率。這一成長主要得益於中國、日本和韓國等主要市場對健康和保健日益成長的關注。在後疫情時代,人們對平衡生活方式的意識不斷增強、飲食習慣的改善以及對數位健身解決方案的日益普及,也推動了市場成長。
虛擬健身市場:主要市場區隔
市場佔有率:按會話類型分類
- 小組會議
- 單獨課程
按串流媒體類型分類的市場佔有率
- 居住
- 一經請求
市佔率:按設備分類
- 桌面
- 筆記型電腦
- 智慧型手機
- 智慧電視
市佔率:按收入模式分類
- 廣告
- 混合
- 訂閱
市佔率:依健身類型分類
- 高強度間歇訓練(HIIT)
- 瑜珈正念
市佔率:依最終用戶分類
- 企業設施
- 國防組織
- 教育機構
- 個人
- 專業健身房
- 體育組織
- 其他
市佔率:按地區分類
- 北美洲
- 美國
- 加拿大
- 墨西哥
- 其他北美國家
- 歐洲
- 奧地利
- 比利時
- 丹麥
- 法國
- 德國
- 愛爾蘭
- 義大利
- 荷蘭
- 挪威
- 俄羅斯
- 西班牙
- 瑞典
- 瑞士
- 英國
- 其他歐洲國家
- 亞洲
- 中國
- 印度
- 日本
- 新加坡
- 韓國
- 其他亞洲國家
- 拉丁美洲
- 巴西
- 智利
- 哥倫比亞
- 委內瑞拉
- 其他拉丁美洲國家
- 中東和北非
- 埃及
- 伊朗
- 伊拉克
- 以色列
- 科威特
- 沙烏地阿拉伯
- 阿拉伯聯合大公國
- 其他中東和北非國家
- 世界其他地區
- 澳洲
- 紐西蘭
- 其他國家
本報告對全球虛擬健身市場進行了分析,提供了概述、背景、市場影響因素分析、市場規模趨勢和預測、按各個細分市場進行的詳細分析、競爭格局以及主要公司的概況。
目錄
第1章:專案概述
第2章:調查方法
第3章 市場動態
第4章 宏觀經濟指標
第5章摘要整理
第6章:引言
第7章 監管情景
第8章:主要公司綜合資料庫
第9章 競爭情勢
第10章:閒置頻段分析
第11章:企業競爭力分析
第12章:創業生態系分析
第13章:公司簡介
- 章節概要
- ClassPass
- Conofitness
- Fitbit
- Fitness On Demand
- GoodLife Fitness
- Les Mills International
- MINDBODY
- Move Technologies
- Navigate Wellbeing Solutions
- Reh-Fit Centre
- Sworkit (Nexercise)
- Unscreen
- VIXY BV
- Wellbeats
- Wexer
第14章 大趨勢分析
第15章:未滿足需求的分析
第16章 專利分析
第17章 近期趨勢
第18章:全球虛擬健身市場
第19章 依會議類型分類的市場機會
第20章 依串流媒體類型分類的市場機會
第21章 按設備類型分類的市場機會
第22章 按收入模式分類的市場機會
第23章 按健身類型分類的市場機遇
第24章 終端用戶市場機會
第25章:北美虛擬健身的市場機遇
第26章:歐洲虛擬健身的市場機遇
第27章:亞洲虛擬健身的市場機遇
第28章:中東和北非虛擬健身的市場機會
第29章:拉丁美洲虛擬健身的市場機遇
第30章:世界其他地區的虛擬健身市場機會
第31章 市場集中度分析:主要公司的分佈
第32章:鄰近市場分析
第33章:制勝的關鍵策略
第34章:波特五力分析
第35章 SWOT分析
第36章 價值鏈分析
第37章:ROOTS的策略建議
第38章 來自初步調查的見解
第39章:報告結論
第40章:表格形式數據
第41章 公司和組織列表
Virtual Fitness Market Outlook
As per Roots Analysis, the global virtual fitness market size is estimated to grow from USD 40.05 billion in current year to USD 674.16 billion by 2035, at a CAGR of 36.85%, during the forecast period, till 2035.
The virtual fitness market has experienced substantial growth, driven by rising health awareness and increasing digital adoption. According to the World Health Organization, approximately 1.8 billion adults fail to meet recommended physical activity levels, highlighting a significant need for accessible fitness solutions. This gap, combined with advancements in internet technologies, has accelerated the emergence of virtual fitness platforms. The convenience of accessing live or on-demand workout sessions via smartphones or laptops, coupled with flexible scheduling, has been a key factor driving user adoption.
The market continues to expand with the proliferation of smartphones, increasing demand for flexible workout options, and the integration of advanced technologies such as artificial intelligence and wearable devices. Virtual fitness platforms now offer personalized training and nutrition plans, enhancing user engagement and outcomes. Additionally, the growing popularity of formats such as high-intensity interval training (HIIT), yoga, and dance-based workouts has significantly contributed to the expansion of digital fitness offerings. Collectively, these factors indicate that virtual fitness has evolved into a sustainable and integral component of the global health and wellness ecosystem.
Strategic Insights for Senior Leaders
Key Drivers Propelling Growth of Virtual Fitness Market
The growing emphasis on health and wellness, combined with continuous advancements in digital technologies such as on-demand workout platforms, is positioning virtual fitness as a significant component of modern lifestyles. Market growth is primarily driven by the increasing adoption of healthy living practices across diverse end users, including corporate organizations, defense and educational institutions, individuals, professional gyms, and sports institutes. Furthermore, rising awareness of balanced nutrition and physical fitness is expected to play a pivotal role in shaping the future of online fitness solutions. The ease of accessing structured workout sessions through smartphones or laptops, along with the availability of time-efficient formats, is anticipated to remain a key factor supporting sustained adoption during the forecast period.
Virtual Fitness Market: Competitive Landscape of Companies in this Industry
The virtual fitness market is characterized by intense competition and evolving dynamics, driven by the presence of both established multinational corporations and emerging players. Companies across the spectrum are actively pursuing strategies to strengthen their competitive positioning through continuous innovation and service enhancement. While smaller firms contribute to market diversity, larger enterprises account for a significant share, supported by their strong brand presence and resource capabilities. These leading players are consistently introducing new offerings, forming strategic partnerships, and integrating advanced features to enhance user experience and maintain market leadership.
Emerging Trends in Virtual Fitness Market
The virtual fitness market is undergoing rapid transformation, driven by technological innovation and evolving consumer expectations. One of the most prominent emerging trends is the integration of artificial intelligence (AI) and data analytics, enabling highly personalized workout and nutrition plans tailored to individual performance, preferences, and health metrics. The rise of hyper-personalized fitness solutions, supported by connected devices and real-time feedback systems, is significantly enhancing user engagement and outcomes. Additionally, the adoption of immersive technologies, including virtual reality (VR) and augmented reality (AR), is redefining workout experiences by offering interactive and gamified environments.
Another key trend is the increasing penetration of wearable fitness devices and smart equipment, which facilitate continuous health monitoring and seamless integration with virtual platforms. This, combined with the growing preference for hybrid fitness models, reflects changing lifestyle patterns and the demand for flexibility. Overall, these trends, and expanding digital ecosystems, are positioning virtual fitness as a data-driven, personalized, and technology-enabled segment within the broader health and wellness industry
North America Dominates the Virtual Fitness Market
According to our analysis, in the current year, North America captures the highest share of the global virtual fitness market. This leadership is driven by widespread digital infrastructure and a highly technology-oriented consumer base. The region experienced significant market expansion during and after the pandemic, as consumers increasingly adopted digital fitness solutions to accommodate time-constrained schedules and evolving work patterns. The integration of internet-based platforms with fitness services has enabled greater accessibility and convenience, contributing to sustained adoption across the region.
In contrast, the Asia-Pacific region is expected to grow at a higher CAGR during the forecast period. This growth is driven by rising interest of individuals in health and wellness across key markets such as China, Japan, and South Korea, supported by increasing awareness of balanced lifestyles, improved dietary habits, and the acceptance of digital fitness solutions following the pandemic.
Key Challenges in the Virtual Fitness Market
Despite strong growth projections, the virtual fitness market faces several challenges that may hinder its long-term development and innovation. Key concerns include data privacy and cybersecurity risks, as increasing reliance on digital platforms exposes user information to potential vulnerabilities. In addition, the absence of direct physical supervision in virtual workout environments can elevate the risk of improper exercise techniques and related injuries, particularly among inexperienced users. These limitations, combined with the growing dependence on stable internet connectivity, underscore the need for enhanced safety measures, secure platforms, and improved user guidance.
Virtual Fitness Market: Key Market Segmentation
Market Share by Type of Session
- Group Session
- Solo Session
Market Share by Type of Streaming
- Live
- On-Demand
Market Share by Type of Device
- Desktops
- Laptops
- Smart Phones
- Smart TV
Market Share by Type of Revenue Model
- Advertisement
- Hybrid
- Subscription
Market Share by Type of Fitness Genre
- High Intensity Interval Training (HIIT)
- Yoga and Mindfulness
Market Share by End-Users
- Corporate Institutes
- Defense Institutes
- Educational Institutes
- Individuals
- Professional Gyms
- Sport Institutes
- Others
Market Share by Geographical Regions
- North America
- US
- Canada
- Mexico
- Other North American countries
- Europe
- Austria
- Belgium
- Denmark
- France
- Germany
- Ireland
- Italy
- Netherlands
- Norway
- Russia
- Spain
- Sweden
- Switzerland
- UK
- Other European countries
- Asia
- China
- India
- Japan
- Singapore
- South Korea
- Other Asian countries
- Latin America
- Brazil
- Chile
- Colombia
- Venezuela
- Other Latin American countries
- Middle East and North Africa
- Egypt
- Iran
- Iraq
- Israel
- Kuwait
- Saudi Arabia
- UAE
- Other MENA countries
- Rest of the World
- Australia
- New Zealand
- Other Countries
Example Players in Virtual Fitness Market
- ClassPass
- Conofitness
- Fitbit
- Fitness On Demand
- GoodLife Fitness
- Les Mills International
- MINDBODY
- Move Technologies
- Navigate Wellbeing Solutions
- Reh-Fit Centre
- Sworkit (Nexercise)
- Unscreen
- VIXY BV
- Wellbeats
- Wexer
Virtual Fitness Market: Report Coverage
The report on the virtual fitness market features insights on various sections, including:
- Market Sizing and Opportunity Analysis: An in-depth analysis of the virtual fitness market, focusing on key market segments, including [A] type of session, [B] type of streaming, [C] type of device, [D] type of revenue model, [E] type of fitness genre, [F] end user, [G] geographical regions, and [H] leading players.
- Competitive Landscape: A comprehensive analysis of the companies engaged in the virtual fitness market, based on several relevant parameters, such as [A] year of establishment, [B] company size, [C] location of headquarters and [D] ownership structure.
- Company Profiles: Elaborate profiles of prominent players engaged in the virtual fitness market, providing details on [A] location of headquarters, [B] company size, [C] company mission, [D] company footprint, [E] management team, [F] contact details, [G] financial information, [H] operating business segments, [I] product / technology portfolio, [J] recent developments, and an informed future outlook.
- Megatrends: An evaluation of ongoing megatrends in the virtual fitness industry.
- Patent Analysis: An insightful analysis of patents filed / granted in the virtual fitness domain, based on relevant parameters, including [A] type of patent, [B] patent publication year, [C] patent age and [D] leading players.
- Recent Developments: An overview of the recent developments made in the virtual fitness market, along with analysis based on relevant parameters, including [A] year of initiative, [B] type of initiative, [C] geographical distribution and [D] most active players.
- Porter's Five Forces Analysis: An analysis of five competitive forces prevailing in the virtual fitness market, including threats of new entrants, bargaining power of buyers, bargaining power of suppliers, threats of substitute products and rivalry among existing competitors.
- SWOT Analysis: An insightful SWOT framework, highlighting the strengths, weaknesses, opportunities and threats in the domain. Additionally, it provides Harvey ball analysis, highlighting the relative impact of each SWOT parameter.
Key Questions Answered in this Report
- What is the current and future market size?
- Who are the leading companies in this market?
- What are the growth drivers that are likely to influence the evolution of this market?
- What are the key partnership and funding trends shaping this industry?
- Which region is likely to grow at higher CAGR till 2035?
- How is the current and future market opportunity likely to be distributed across key market segments?
Reasons to Buy this Report
- Detailed Market Analysis: The report provides a comprehensive market analysis, offering detailed revenue projections of the overall market and its specific sub-segments. This information is valuable to both established market leaders and emerging entrants.
- In-depth Analysis of Trends: Stakeholders can leverage the report to gain a deeper understanding of the competitive dynamics within the market. Each report maps ecosystem activity across partnerships, funding, and patent landscapes to reveal growth hotspots and white spaces in the industry.
- Opinion of Industry Experts: The report features extensive interviews and surveys with key opinion leaders and industry experts to validate market trends mentioned in the report.
- Decision-ready Deliverables: The report offers stakeholders with strategic frameworks (Porter's Five Forces, value chain, SWOT), and complimentary Excel / slide packs with customization support.
Additional Benefits
- Complimentary Dynamic Excel Dashboards for Analytical Modules
- Exclusive 15% Free Content Customization
- Personalized Interactive Report Walkthrough with Our Expert Research Team
- Free Report Updates for Versions Older than 6-12 Months
TABLE OF CONTENTS
1. PREFACE
- 1.1. Introduction
- 1.2. Market Share Insights
- 1.3. Key Market Insights
- 1.4. Report Coverage
- 1.5. Key Questions Answered
- 1.6. Chapter Outlines
2. RESEARCH METHODOLOGY
- 2.1. Chapter Overview
- 2.2. Research Assumptions
- 2.3. Database Building
- 2.3.1. Data Collection
- 2.3.2. Data Validation
- 2.3.3. Data Analysis
- 2.4. Project Methodology
- 2.4.1. Secondary Research
- 2.4.1.1. Annual Reports
- 2.4.1.2. Academic Research Papers
- 2.4.1.3. Company Websites
- 2.4.1.4. Investor Presentations
- 2.4.1.5. Regulatory Filings
- 2.4.1.6. White Papers
- 2.4.1.7. Industry Publications
- 2.4.1.8. Conferences and Seminars
- 2.4.1.9. Government Portals
- 2.4.1.10. Media and Press Releases
- 2.4.1.11. Newsletters
- 2.4.1.12. Industry Databases
- 2.4.1.13. Roots Proprietary Databases
- 2.4.1.14. Paid Databases and Sources
- 2.4.1.15. Social Media Portals
- 2.4.1.16. Other Secondary Sources
- 2.4.2. Primary Research
- 2.4.2.1. Introduction
- 2.4.2.2. Types
- 2.4.2.2.1. Qualitative
- 2.4.2.2.2. Quantitative
- 2.4.2.3. Advantages
- 2.4.2.4. Techniques
- 2.4.2.4.1. Interviews
- 2.4.2.4.2. Surveys
- 2.4.2.4.3. Focus Groups
- 2.4.2.4.4. Observational Research
- 2.4.2.4.5. Social Media Interactions
- 2.4.2.5. Stakeholders
- 2.4.2.5.1. Company Executives (CXOs)
- 2.4.2.5.2. Board of Directors
- 2.4.2.5.3. Company Presidents and Vice Presidents
- 2.4.2.5.4. Key Opinion Leaders
- 2.4.2.5.5. Research and Development Heads
- 2.4.2.5.6. Technical Experts
- 2.4.2.5.7. Subject Matter Experts
- 2.4.2.5.8. Scientists
- 2.4.2.5.9. Doctors and Other Healthcare Providers
- 2.4.2.6. Ethics and Integrity
- 2.4.2.6.1. Research Ethics
- 2.4.2.6.2. Data Integrity
- 2.4.3. Analytical Tools and Databases
- 2.4.1. Secondary Research
3. MARKET DYNAMICS
- 3.1. Forecast Methodology
- 3.1.1. Top-Down Approach
- 3.1.2. Bottom-Up Approach
- 3.1.3. Hybrid Approach
- 3.2. Market Assessment Framework
- 3.2.1. Total Addressable Market (TAM)
- 3.2.2. Serviceable Addressable Market (SAM)
- 3.2.3. Serviceable Obtainable Market (SOM)
- 3.2.4. Currently Acquired Market (CAM)
- 3.3. Forecasting Tools and Techniques
- 3.3.1. Qualitative Forecasting
- 3.3.2. Correlation
- 3.3.3. Regression
- 3.3.4. Time Series Analysis
- 3.3.5. Extrapolation
- 3.3.6. Convergence
- 3.3.7. Forecast Error Analysis
- 3.3.8. Data Visualization
- 3.3.9. Scenario Planning
- 3.3.10. Sensitivity Analysis
- 3.4. Key Considerations
- 3.4.1. Demographics
- 3.4.2. Market Access
- 3.4.3. Reimbursement Scenarios
- 3.4.4. Industry Consolidation
- 3.5. Robust Quality Control
- 3.6. Key Market Segmentations
- 3.7. Limitations
4. MACRO-ECONOMIC INDICATORS
- 4.1. Chapter Overview
- 4.2. Market Dynamics
- 4.2.1. Time Period
- 4.2.1.1. Historical Trends
- 4.2.1.2. Current and Forecasted Estimates
- 4.2.2. Currency Coverage
- 4.2.2.1. Overview of Major Currencies Affecting the Market
- 4.2.2.2. Impact of Currency Fluctuations on the Industry
- 4.2.3. Foreign Exchange Impact
- 4.2.3.1. Evaluation of Foreign Exchange Rates and Their Impact on Market
- 4.2.3.2. Strategies for Mitigating Foreign Exchange Risk
- 4.2.4. Recession
- 4.2.4.1. Historical Analysis of Past Recessions and Lessons Learnt
- 4.2.4.2. Assessment of Current Economic Conditions and Potential Impact on the Market
- 4.2.5. Inflation
- 4.2.5.1. Measurement and Analysis of Inflationary Pressures in the Economy
- 4.2.5.2. Potential Impact of Inflation on the Market Evolution
- 4.2.6. Interest Rates
- 4.2.6.1. Overview of Interest Rates and Their Impact on the Market
- 4.2.6.2. Strategies for Managing Interest Rate Risk
- 4.2.7. Commodity Flow Analysis
- 4.2.7.1. Type of Commodity
- 4.2.7.2. Origins and Destinations
- 4.2.7.3. Values and Weights
- 4.2.7.4. Modes of Transportation
- 4.2.8. Global Trade Dynamics
- 4.2.8.1. Import Scenario
- 4.2.8.2. Export Scenario
- 4.2.9. War Impact Analysis
- 4.2.9.1. Russian-Ukraine War
- 4.2.9.2. Israel-Hamas War
- 4.2.10. COVID Impact / Related Factors
- 4.2.10.1. Global Economic Impact
- 4.2.10.2. Industry-specific Impact
- 4.2.10.3. Government Response and Stimulus Measures
- 4.2.10.4. Future Outlook and Adaptation Strategies
- 4.2.11. Other Indicators
- 4.2.11.1. Fiscal Policy
- 4.2.11.2. Consumer Spending
- 4.2.11.3. Gross Domestic Product (GDP)
- 4.2.11.4. Employment
- 4.2.11.5. Taxes
- 4.2.11.6. R&D Innovation
- 4.2.11.7. Stock Market Performance
- 4.2.11.8. Supply Chain
- 4.2.11.9. Cross-Border Dynamics
- 4.2.1. Time Period
5. EXECUTIVE SUMMARY
6. INTRODUCTION
- 6.1. Chapter Overview
- 6.2. Overview of Virtual Fitness Market
- 6.2.1. Type of Session
- 6.2.2. Type of Streaming
- 6.2.3. Type of Device
- 6.2.4. Type of Revenue Model
- 6.2.5. Type of Fitness Genre
- 6.2.6. Type of End-User
- 6.3. Future Perspective
7. REGULATORY SCENARIO
8. COMPREHENSIVE DATABASE OF LEADING PLAYERS
9. COMPETITIVE LANDSCAPE
- 9.1. Chapter Overview
- 9.2. Virtual Fitness: Overall Market Landscape
- 9.2.1. Analysis by Year of Establishment
- 9.2.2. Analysis by Company Size
- 9.2.3. Analysis by Location of Headquarters
- 9.2.4. Analysis by Ownership Structure
10. WHITE SPACE ANALYSIS
11. COMPANY COMPETITIVENESS ANALYSIS
12. STARTUP ECOSYSTEM IN THE VIRTUAL FITNESS MARKET
- 12.1. Virtual Fitness Market: Landscape of Startups
- 12.1.1. Analysis by Year of Establishment
- 12.1.2. Analysis by Company Size
- 12.1.3. Analysis by Company Size and Year of Establishment
- 12.1.4. Analysis by Location of Headquarters
- 12.1.5. Analysis by Company Size and Location of Headquarters
- 12.1.6. Analysis by Ownership Structure
- 12.2. Key Findings
13. COMPANY PROFILES
- 13.1. Chapter Overview
- 13.2. ClassPass*
- 13.2.1. Company Overview
- 13.2.2. Company Mission
- 13.2.3. Company Footprint
- 13.2.4. Management Team
- 13.2.5. Contact Details
- 13.2.6. Financial Performance
- 13.2.7. Operating Business Segments
- 13.2.8. Service / Product Portfolio (project specific)
- 13.2.9. MOAT Analysis
- 13.2.10. Recent Developments and Future Outlook
- 13.3. Conofitness
- 13.4 Fitbit
- 13.5. Fitness On Demand
- 13.6. GoodLife Fitness
- 13.7. Les Mills International
- 13.8. MINDBODY
- 13.9. Move Technologies
- 13.10. Navigate Wellbeing Solutions
- 13.11. Reh-Fit Centre
- 13.12. Sworkit (Nexercise)
- 13.13. Unscreen
- 13.14. VIXY BV
- 13.15. Wellbeats
- 13.16. Wexer
14. MEGA TRENDS ANALYSIS
15. UNMEET NEED ANALYSIS
16. PATENT ANALYSIS
17. RECENT DEVELOPMENTS
- 17.1. Chapter Overview
- 17.2. Recent Funding
- 17.3. Recent Partnerships
- 17.4. Other Recent Initiatives
18. GLOBAL VIRTUAL FITNESS MARKET
- 18.1. Chapter Overview
- 18.2. Key Assumptions and Methodology
- 18.3. Trends Disruption Impacting Market
- 18.4. Demand Side Trends
- 18.5. Supply Side Trends
- 18.6. Global Virtual Fitness Market: Historical Trends (Since 2020) and Forecasted Estimates (Till 2035)
- 18.7. Multivariate Scenario Analysis
- 18.7.1. Conservative Scenario
- 18.7.2. Optimistic Scenario
- 18.8. Investment Feasibility Index
- 18.9. Key Market Segmentations
19. MARKET OPPORTUNITIES BASED ON TYPE OF SESSION
- 19.1. Chapter Overview
- 19.2. Key Assumptions and Methodology
- 19.3. Revenue Shift Analysis
- 19.4. Market Movement Analysis
- 19.5. Penetration-Growth (P-G) Matrix
- 19.6. Virtual Fitness Market for Group: Historical Trends (Since 2020) and Forecasted Estimates (Till 2035)
- 19.7. Virtual Fitness Market for Solo Assets: Historical Trends (Since 2020) and Forecasted Estimates (Till 2035)
- 19.8. Data Triangulation and Validation
- 19.8.1. Secondary Sources
- 19.8.2. Primary Sources
- 19.8.3. Statistical Modeling
20. MARKET OPPORTUNITIES BASED ON TYPE OF STREAMING
- 20.1. Chapter Overview
- 20.2. Key Assumptions and Methodology
- 20.3. Revenue Shift Analysis
- 20.4. Market Movement Analysis
- 20.5. Penetration-Growth (P-G) Matrix
- 20.6. Virtual Fitness Market for Live: Historical Trends (Since 2020) and Forecasted Estimates (Till 2035)
- 20.7. Virtual Fitness Market for On-Demand: Historical Trends (Since 2020) and Forecasted Estimates (Till 2035)
- 20.8. Data Triangulation and Validation
- 20.8.1. Secondary Sources
- 20.8.2. Primary Sources
- 20.8.3. Statistical Modeling
21. MARKET OPPORTUNITIES BASED ON TYPE OF DEVICE
- 21.1. Chapter Overview
- 21.2. Key Assumptions and Methodology
- 21.3. Revenue Shift Analysis
- 21.4. Market Movement Analysis
- 21.5. Penetration-Growth (P-G) Matrix
- 21.6. Virtual Fitness Market for Desktop: Historical Trends (Since 2020) and Forecasted Estimates (Till 2035)
- 21.7. Virtual Fitness Market for Laptops: Historical Trends (Since 2020) and Forecasted Estimates (Till 2035)
- 21.8. Virtual Fitness Market for Smart Phones: Historical Trends (Since 2020) and Forecasted Estimates (Till 2035)
- 21.9. Virtual Fitness Market for Smart TV: Historical Trends (Since 2020) and Forecasted Estimates (Till 2035)
- 21.10. Virtual Fitness Market for Others: Historical Trends (Since 2020) and Forecasted Estimates (Till 2035)
- 21.11. Data Triangulation and Validation
- 21.11.1. Secondary Sources
- 21.11.2. Primary Sources
- 21.11.3. Statistical Modeling
22. MARKET OPPORTUNITIES BASED ON TYPE OF REVENUE MODEL
- 22.1. Chapter Overview
- 22.2. Key Assumptions and Methodology
- 22.3. Revenue Shift Analysis
- 22.4. Market Movement Analysis
- 22.5. Penetration-Growth (P-G) Matrix
- 22.6. Virtual Fitness Market for Advertisement: Historical Trends (Since 2020) and Forecasted Estimates (Till 2035)
- 22.7. Virtual Fitness Market for Hybrid: Historical Trends (Since 2020) and Forecasted Estimates (Till 2035)
- 22.8. Virtual Fitness Market for Subscription: Historical Trends (Since 2020) and Forecasted Estimates (Till 2035)
- 22.9. Data Triangulation and Validation
- 22.9.1. Secondary Sources
- 22.9.2. Primary Sources
- 22.9.3. Statistical Modeling
23. MARKET OPPORTUNITIES BASED ON TYPE OF FITNESS GENRE
- 23.1. Chapter Overview
- 23.2. Key Assumptions and Methodology
- 23.3. Revenue Shift Analysis
- 23.4. Market Movement Analysis
- 23.5. Penetration-Growth (P-G) Matrix
- 23.6. Virtual Fitness Market for High Intensity Interval Training: Historical Trends (Since 2020) and Forecasted Estimates (Till 2035)
- 23.7. Virtual Fitness Market for Yoga and Mindfulness: Historical Trends (Since 2020) and Forecasted Estimates (Till 2035)
- 23.8. Data Triangulation and Validation
- 23.8.1. Secondary Sources
- 23.8.2. Primary Sources
- 23.8.3. Statistical Modeling
24. MARKET OPPORTUNITIES BASED ON END-USERS
- 24.1. Chapter Overview
- 24.2. Key Assumptions and Methodology
- 24.3. Revenue Shift Analysis
- 24.4. Market Movement Analysis
- 24.5. Penetration-Growth (P-G) Matrix
- 24.6. Virtual Fitness Market for Corporate Institutes: Historical Trends (Since 2020) and Forecasted Estimates (Till 2035)
- 24.7. Virtual Fitness Market for Defense Institutes: Historical Trends (Since 2020) and Forecasted Estimates (Till 2035)
- 24.8. Virtual Fitness Market for Educational Institutes: Historical Trends (Since 2020) and Forecasted Estimates (Till 2035)
- 24.9. Virtual Fitness Market for Individuals: Historical Trends (Since 2020) and Forecasted Estimates (Till 2035)
- 24.10. Virtual Fitness Market for Professional Institutes: Historical Trends (Since 2020) and Forecasted Estimates (Till 2035)
- 24.11. Virtual Fitness Market for Sport Institutes: Historical Trends (Since 2020) and Forecasted Estimates (Till 2035)
- 24.12. Virtual Fitness Market for Others: Historical Trends (Since 2020) and Forecasted Estimates (Till 2035)
- 24.13. Data Triangulation and Validation
- 24.13.1. Secondary Sources
- 24.13.2. Primary Sources
- 24.13.3. Statistical Modeling
25. MARKET OPPORTUNITIES VIRTUAL FITNESS IN NORTH AMERICA
- 25.1. Chapter Overview
- 25.2. Key Assumptions and Methodology
- 25.3. Revenue Shift Analysis
- 25.4. Market Movement Analysis
- 25.5. Penetration-Growth (P-G) Matrix
- 25.6. Virtual Fitness Market in North America: Historical Trends (Since 2020) and Forecasted Estimates (Till 2035)
- 25.6.1. Virtual Fitness Market in the US: Historical Trends (Since 2020) and Forecasted Estimates (Till 2035)
- 25.6.2. Virtual Fitness Market in Canada: Historical Trends (Since 2020) and Forecasted Estimates (Till 2035)
- 25.6.3. Virtual Fitness Market in Mexico: Historical Trends (Since 2020) and Forecasted Estimates (Till 2035)
- 25.6.4. Virtual Fitness Market in Other North American Countries: Historical Trends (Since 2020) and Forecasted Estimates (Till 2035)
- 25.7. Data Triangulation and Validation
26. MARKET OPPORTUNITIES FOR VIRTUAL FITNESS IN EUROPE
- 26.1. Chapter Overview
- 26.2. Key Assumptions and Methodology
- 26.3. Revenue Shift Analysis
- 26.4. Market Movement Analysis
- 26.5. Penetration-Growth (P-G) Matrix
- 26.6. Virtual Fitness Market in Europe: Historical Trends (Since 2020) and Forecasted Estimates (Till 2035)
- 26.6.1. Virtual Fitness Market in Austria: Historical Trends (Since 2020) and Forecasted Estimates (Till 2035)
- 26.6.2. Virtual Fitness Market in Belgium: Historical Trends (Since 2020) and Forecasted Estimates (Till 2035)
- 26.6.3. Virtual Fitness Market in Denmark: Historical Trends (Since 2020) and Forecasted Estimates (Till 2035)
- 26.6.4. Virtual Fitness Market in France: Historical Trends (Since 2020) and Forecasted Estimates (Till 2035)
- 26.6.5. Virtual Fitness Market in Germany: Historical Trends (Since 2020) and Forecasted Estimates (Till 2035)
- 26.6.6. Virtual Fitness Market in Ireland: Historical Trends (Since 2020) and Forecasted Estimates (Till 2035)
- 26.6.7. Virtual Fitness Market in Italy: Historical Trends (Since 2020) and Forecasted Estimates (Till 2035)
- 26.6.8. Virtual Fitness Market in Netherlands: Historical Trends (Since 2020) and Forecasted Estimates (Till 2035)
- 26.6.9. Virtual Fitness Market in Norway: Historical Trends (Since 2020) and Forecasted Estimates (Till 2035)
- 26.6.10. Virtual Fitness Market in Russia: Historical Trends (Since 2020) and Forecasted Estimates (Till 2035)
- 26.6.11. Virtual Fitness Market in Spain: Historical Trends (Since 2020) and Forecasted Estimates (Till 2035)
- 26.6.12. Virtual Fitness Market in Sweden: Historical Trends (Since 2020) and Forecasted Estimates (Till 2035)
- 26.6.13. Virtual Fitness Market in Switzerland: Historical Trends (Since 2020) and Forecasted Estimates (Till 2035)
- 26.6.14. Virtual Fitness Market in the UK: Historical Trends (Since 2020) and Forecasted Estimates (Till 2035)
- 26.6.15. Virtual Fitness Market in Other European Countries: Historical Trends (Since 2020) and Forecasted Estimates (Till 2035)
- 26.7. Data Triangulation and Validation
27. MARKET OPPORTUNITIES FOR VIRTUAL FITNESS IN ASIA
- 27.1. Chapter Overview
- 27.2. Key Assumptions and Methodology
- 27.3. Revenue Shift Analysis
- 27.4. Market Movement Analysis
- 27.5. Penetration-Growth (P-G) Matrix
- 27.6. Virtual Fitness Market in Asia: Historical Trends (Since 2020) and Forecasted Estimates (Till 2035)
- 27.6.1. Virtual Fitness Market in China: Historical Trends (Since 2020) and Forecasted Estimates (Till 2035)
- 27.6.2. Virtual Fitness Market in India: Historical Trends (Since 2020) and Forecasted Estimates (Till 2035)
- 27.6.3. Virtual Fitness Market in Japan: Historical Trends (Since 2020) and Forecasted Estimates (Till 2035)
- 27.6.4. Virtual Fitness Market in Singapore: Historical Trends (Since 2020) and Forecasted Estimates (Till 2035)
- 27.6.5. Virtual Fitness Market in South Korea: Historical Trends (Since 2020) and Forecasted Estimates (Till 2035)
- 27.6.6. Virtual Fitness Market in Other Asian Countries: Historical Trends (Since 2020) and Forecasted Estimates (Till 2035)
- 27.7. Data Triangulation and Validation
28. MARKET OPPORTUNITIES FOR VIRTUAL FITNESS IN MIDDLE EAST AND NORTH AFRICA (MENA)
- 28.1. Chapter Overview
- 28.2. Key Assumptions and Methodology
- 28.3. Revenue Shift Analysis
- 28.4. Market Movement Analysis
- 28.5. Penetration-Growth (P-G) Matrix
- 28.6. Virtual Fitness Market in Middle East and North Africa (MENA): Historical Trends (Since 2020) and Forecasted Estimates (Till 2035)
- 28.6.1. Virtual Fitness Market in Egypt: Historical Trends (Since 2020) and Forecasted Estimates (Till 205)
- 28.6.2. Virtual Fitness Market in Iran: Historical Trends (Since 2020) and Forecasted Estimates (Till 2035)
- 28.6.3. Virtual Fitness Market in Iraq: Historical Trends (Since 2020) and Forecasted Estimates (Till 2035)
- 28.6.4. Virtual Fitness Market in Israel: Historical Trends (Since 2020) and Forecasted Estimates (Till 2035)
- 28.6.5. Virtual Fitness Market in Kuwait: Historical Trends (Since 2020) and Forecasted Estimates (Till 2035)
- 28.6.6. Virtual Fitness Market in Saudi Arabia: Historical Trends (Since 2020) and Forecasted Estimates (Till 2035)
- 28.6.7. Virtual Fitness Market in United Arab Emirates (UAE): Historical Trends (Since 2020) and Forecasted Estimates (Till 2035)
- 28.6.8. Virtual Fitness Market in Other MENA Countries: Historical Trends (Since 2020) and Forecasted Estimates (Till 2035)
- 28.7. Data Triangulation and Validation
29. MARKET OPPORTUNITIES FOR VIRTUAL FITNESS IN LATIN AMERICA
- 29.1. Chapter Overview
- 29.2. Key Assumptions and Methodology
- 29.3. Revenue Shift Analysis
- 29.4. Market Movement Analysis
- 29.5. Penetration-Growth (P-G) Matrix
- 29.6. Virtual Fitness Market in Latin America: Historical Trends (Since 2020) and Forecasted Estimates (Till 2035)
- 29.6.1. Virtual Fitness Market in Argentina: Historical Trends (Since 2020) and Forecasted Estimates (Till 2035)
- 29.6.2. Virtual Fitness Market in Brazil: Historical Trends (Since 2020) and Forecasted Estimates (Till 2035)
- 29.6.3. Virtual Fitness Market in Chile: Historical Trends (Since 2020) and Forecasted Estimates (Till 2035)
- 29.6.4. Virtual Fitness Market in Colombia Historical Trends (Since 2020) and Forecasted Estimates (Till 2035)
- 29.6.5. Virtual Fitness Market in Venezuela: Historical Trends (Since 2020) and Forecasted Estimates (Till 2035)
- 29.6.6. Virtual Fitness Market in Other Latin American Countries: Historical Trends (Since 2020) and Forecasted Estimates (Till 2035)
- 29.7. Data Triangulation and Validation
30. MARKET OPPORTUNITIES FOR VIRTUAL FITNESS IN REST OF THE WORLD
- 30.1. Chapter Overview
- 30.2. Key Assumptions and Methodology
- 30.3. Revenue Shift Analysis
- 30.4. Market Movement Analysis
- 30.5. Penetration-Growth (P-G) Matrix
- 30.6. Virtual Fitness Market in Rest of the World: Historical Trends (Since 2020) and Forecasted Estimates (Till 2035)
- 30.6.1. Virtual Fitness Market in Australia: Historical Trends (Since 2020) and Forecasted Estimates (Till 2035)
- 30.6.2. Virtual Fitness Market in New Zealand: Historical Trends (Since 2020) and Forecasted Estimates (Till 2035)
- 30.6.3. Virtual Fitness Market in Other Countries: Historical Trends (Since 2020) and Forecasted Estimates (Till 2035)
- 30.7. Data Triangulation and Validation
31. MARKET CONCENTRATION ANALYSIS: DISTRIBUTION BY LEADING PLAYERS
32. ADJACENT MARKET ANALYSIS
33. KEY WINNING STRATEGIES
34. PORTER'S FIVE FORCES ANALYSIS
35. SWOT ANALYSIS
36. VALUE CHAIN ANALYSIS
37. ROOTS STRATEGIC RECOMMENDATIONS
- 37.1. Chapter Overview
- 37.2. Key Business-related Strategies
- 37.2.1. Research & Development
- 37.2.2. Product Manufacturing
- 37.2.3. Commercialization / Go-to-Market
- 37.2.4. Sales and Marketing
- 37.3. Key Operations-related Strategies
- 37.3.1. Risk Management
- 37.3.2. Workforce
- 37.3.3. Finance
- 37.3.4. Others
38. INSIGHTS FROM PRIMARY RESEARCH
39. REPORT CONCLUSION
40. TABULATED DATA
41. LIST OF COMPANIES AND ORGANIZATIONS
 虛擬健身市場規模、佔有率和成長分析:按課程類型、串流媒體類型、設備、平台、收入模式、應用和地區分類-2026-2033年產業預測
 全球虛擬健身市場
 虛擬健身硬體市場報告:趨勢、預測和競爭分析(至 2031 年)