


 |
市場調查報告書
商品編碼
2037825
全球再生海洋塑膠市場(至2035年):依塑膠類型、尺寸、再生材料、來源、再生產品形式、最終用途產業、分銷管道、地區、產業趨勢和預測分類Recycled Ocean Plastics Market, Till 2035: Distribution by Type of Plastic, Dimension, Recycled Material, Source of Material, Recycled Product Form, End Use Industry, Distribution Channel, and Geographical Regions: Industry Trends and Global Forecasts |
||||||
再生海洋塑膠市場展望
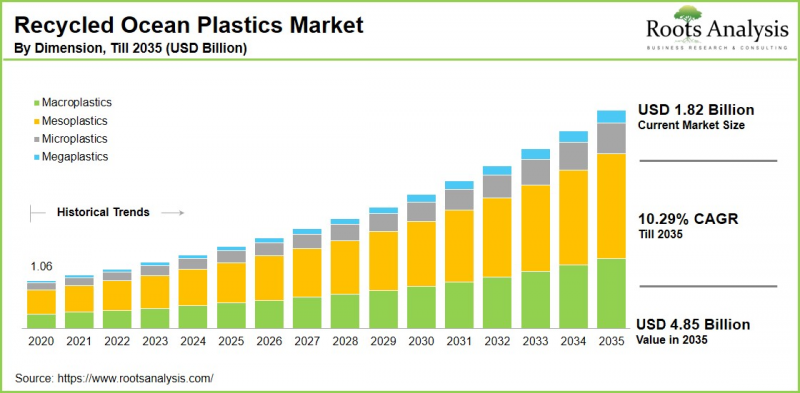
全球海洋塑膠回收市場預計將從目前的 18.2 億美元成長到 2035 年的 48.5 億美元,到 2035 年複合年成長率將達到 10.29%。
海洋再生塑膠(ROP)是指從海洋環境(海洋、海岸、近岸水域等)中回收的塑膠廢棄物,石化燃料。然而,ROP 的利用也面臨一些獨特的挑戰,例如回收材料通常存在劣化和污染,並且含有多種聚合物的混合物,這使得加工過程十分複雜。
儘管面臨這些挑戰,射出成型等製造技術的進步使得ROP技術得以在包括鞋類、汽車零件和高性能紡織品在內的廣泛應用領域中有效利用。海洋清理組織(The Ocean Cleanup)等行業領導企業正在證明,透過先進的清潔工藝和使用專用添加劑,海洋塑膠可以達到商業用途所需的技術和品質標準。然而,由於海洋塑膠廢棄物分佈廣泛以及收集和分類成本高昂,市場規模化仍面臨限制。儘管如此,化學回收領域的持續創新和合作努力正在提高回收海洋塑膠作為永續資源的效率、透明度和長期可行性。
為高階主管提供策略見解
再生海洋塑膠市場的主要成長促進因素
海洋塑膠回收產業正經歷顯著成長,這主要得益於環境、技術和商業性因素的共同推動。人們對海洋污染日益關注,促使全球推出更強力的政策因應措施,包括與歐盟的「一次性塑膠指令」和聯合國的永續目標(SDGs)保持一致。同時,企業永續性措施和消費者偏好的轉變也在加速海洋塑膠回收的普及。阿迪達斯和可口可樂等領導品牌已將海洋塑膠融入其核心產品線,從而提升市場信譽,並強化其對企業社會責任的承諾。
人工智慧分類系統、化學回收製程和基於區塊鏈的可追溯性等技術進步,進一步提升了再生材料的品質、效率和透明度。此外,關鍵終端應用領域(紡織、包裝、汽車、電子等)需求的成長,以及監管壓力和消費者對永續產品日益成長的偏好,都推動了市場成長。
再生海洋塑膠市場:產業公司競爭格局
海洋塑膠回收市場競爭異常激烈,Ocean Plastic Technologies、Patagonia、4Ocean、United by Blue、Aquafil、BIONIC 和 SEAQUAL INITIATIVE 等領先企業佔主導地位。這些企業積極參與大規模海洋清理行動,並部署先進的回收技術,包括人工智慧驅動的塑膠分類和基於區塊鏈的溯源系統。此外,這些公司也致力於開發循環產品設計方案,以提升永續性。
策略聯盟、併購和持續創新對於鞏固市場地位和拓展全球業務至關重要。此外,歐洲和亞太等地區受益於健全的政策框架和完善的基礎設施,這進一步加劇了市場競爭,同時也推動了整體市場成長。
本報告研究了全球再生海洋塑膠市場,提供了市場規模估算、機會分析、競爭格局和公司簡介等資訊。
目錄
第1章:專案概述
第2章:調查方法
第3章 市場動態
第4章 宏觀經濟指標
第5章摘要整理
第6章:引言
第7章 監管情景
第8章:主要公司綜合資料庫
第9章 競爭情勢
第10章:閒置頻段分析
第11章:企業競爭力分析
第12章:創業生態系分析
第13章:公司簡介
- 章節概要
- 4Ocean
- Adidas
- Aquafill
- BIONIC
- ECOALF
- Envision Plastics
- Interface
- Method Products
- Norton Point
- Ocean Plastic Technologies
- OCEANPLASTIK
- Ocean Waste Plastic
- Oceanworks
- Parley
- Patagonia
- Plastix
- Plastic Bank
- POPSICASE
- Prevented Ocean Plastic
- Repreve
- Resynergi
- SEAQUAL INITIATIVE
- Textil Santanderina
- TerraCycle
- The Ocean Cleanup
- Tide Ocean
- UPM Raflatac
- United By Blue
- Waste2Wear
- Waterhaul
第14章:分析大趨勢
第15章:未滿足需求的分析
第16章:專利分析
第17章 最新進展
第18章:全球再生海洋塑膠市場
第19章 市場機會:依塑膠類型分類
第20章 市場機會:依規模分類
第21章 市場機會:再生材料
第22章 市場機會:依來源分類
第23章 市場機會:依加工方法分類
第24章 市場機會:依再生產品形式分類
第25章 市場機會:依最終用途產業分類
第26章 市場機會:依分銷管道分類
第27章 歐洲再生海洋塑膠的市場機遇
第28章 亞太地區再生海洋塑膠的市場機會
第29章 拉丁美洲再生海洋塑膠的市場機遇
第30章 中東和非洲再生海洋塑膠的市場機遇
第31章 市場集中度分析:依主要公司分類
第32章:鄰近市場分析
第33章:關鍵成功策略
第34章:波特五力分析
第35章:SWOT分析
第36章:價值鏈分析
第37章:Roots的策略建議
第38章:來自初步調查的見解
第39章:報告結論
第40章:表格形式數據
第41章 公司和組織列表
Recycled Ocean Plastics Market Outlook
As per Roots Analysis, the global recycled ocean plastics market size is estimated to grow from USD 1.82 billion in current year to USD 4.85 billion by 2035, at a CAGR of 10.29% during the forecast period, till 2035.
Recycled ocean plastics (ROP) refer to plastic waste recovered from marine environments (including oceans, beaches, and coastal waterways), that is subsequently cleaned, processed, and converted into raw materials for the production of new goods. This approach not only addresses the pressing issue of marine pollution but also supports the transition towards a circular economy by reducing dependence on virgin, fossil-fuel-based plastics. However, the utilization of ROP presents inherent challenges, as the collected materials are often degraded, contaminated, and composed of mixed polymer types, making processing more complex.
Despite these difficulties, advancements in manufacturing technologies, such as injection molding, have enabled the effective incorporation of ROP into a wide range of applications, including footwear, automotive components, and high-performance textiles. Industry leaders like The Ocean Cleanup have demonstrated that, through advanced cleaning processes and the use of specialized additives, ocean plastics can meet the technical and quality standards required for commercial use. Nevertheless, the market continues to face scalability constraints due to the dispersed nature of marine plastic waste and the high costs associated with its collection and sorting. Ongoing innovations in chemical recycling, and collaborative initiatives are, however, enhancing efficiency, transparency, and the long-term viability of recycled ocean plastics as a sustainable resource.
Strategic Insights for Senior Leaders
Key Drivers Propelling Growth of Recycled Ocean Plastics Market
The recycled ocean plastics industry is experiencing significant growth, primarily by a convergence of environmental, technological, and commercial factors. Escalating concerns over marine pollution have prompted stronger global policy responses, including measures such as the EU's Single-Use Plastics Directive and alignment with the United Nations Sustainable Development Goals. At the same time, corporate sustainability initiatives and shifting consumer preferences are accelerating adoption. Major brands such as Adidas and Coca-Cola are incorporating ocean plastics into prominent product lines, thereby enhancing market credibility and reinforcing corporate social responsibility commitments.
Technological advancements, including AI-driven sorting systems, chemical recycling processes, and blockchain-enabled traceability, have further improved the quality, efficiency, and transparency of recycled materials. Additionally, expanding demand across key end-use sectors (such as textiles, packaging, automotive, and electronics) is supporting market growth, driven by regulatory pressures and increasing consumer preference for sustainable products.
Recycled Ocean Plastics Market: Competitive Landscape of Companies in this Industry
The recycled ocean plastics market is characterized by a highly competitive landscape, with prominent players such as Ocean Plastic Technologies, Patagonia, 4Ocean, United by Blue, Aquafil, BIONIC, and SEAQUAL INITIATIVE playing a leading role. These organizations are actively engaged in large-scale ocean cleanup efforts, the deployment of advanced recycling technologies, including artificial intelligence for plastic sorting and blockchain for traceability. Further, these companies are focusing on the development of circular product design solutions to enhance sustainability.
Strategic collaborations, mergers, and continuous innovation are central to strengthening their market position and expanding global reach. Additionally, regions such as Europe and Asia-Pacific benefit from robust policy frameworks and well-developed infrastructure, further intensifying competition while simultaneously driving overall market growth.
Adoption of Ocean Plastics in Eco-Friendly Packaging
The increasing adoption of recycled materials in packaging is driven by the need to comply with regulatory mandates on recycled content. It also reflects the growing consumer demand for environmentally responsible products. In addition, the availability of traceable and sustainable raw materials is enabling industries such as fast-moving consumer goods (FMCG), cosmetics, and food to enhance transparency across their supply chains. It also helps these industries strengthen their sustainability commitments.
Regulatory and Certification Frameworks for Ocean Plastics
Regulatory frameworks across North America, Europe, and the Asia-Pacific region are increasingly enforcing mandates on the use of recycled content, driving greater accountability within the plastics value chain. At the same time, certifications such as the Global Recycled Standard (GRS) play a critical role in ensuring material traceability, quality assurance, and compliance with established sustainability criteria. Collectively, these measures help strengthen consumer trust while minimizing the risk of greenwashing by promoting transparency and verified environmental claims.
Europe Dominates the Recycled Ocean Plastics Market
According to our analysis, in the current year, Europe captures the highest share of the global recycled ocean plastics market. This dominance is primarily driven by strong policy support for circular economy initiatives, stringent regulatory frameworks such as the European Green Deal and the Packaging and Packaging Waste Regulation. It is further supported by substantial investments in chemical recycling infrastructure and well-established supply chain accountability systems. In contrast, the Asia-Pacific region is projected to grow at a higher CAGR over the forecast period, supported by expanding industrial activity and increasing adoption of sustainable materials.
Prominent Challenges in the Recycled Ocean Plastics Market
The recycled ocean plastics market faces several critical challenges that may hinder its scalability and widespread adoption. High costs associated with the collection, sorting, and processing of marine plastics pose significant constraints on profitability, particularly in price-sensitive markets. Additionally, ocean-derived plastics are frequently degraded due to prolonged exposure to sunlight, saltwater, and contaminants, resulting in inconsistent material quality and technical limitations. This restrict their use in high-performance applications and increase manufacturing rejection rates.
The complexity of navigating diverse international regulations, eco-labeling standards, and certification requirements further adds to operational burdens, potentially delaying market entry and expansion, especially for smaller companies. Moreover, limited consumer awareness in certain regions, can impede market growth by reducing brand differentiation and limiting consumers' willingness to pay a premium for such sustainable products.
Recycled Ocean Plastics Market: Key Market Segmentation
Market Share by Type of Plastic
- High-Density Polyethylene (HDPE)
- Low-Density Polyethylene (LDPE)
- Polyethylene Terephthalate (PET)
- Polypropylene (PP)
- Polystyrene (PS)
- Polyvinyl Chloride (PVC)
- Polyurethane (PUR)
- Others
Market Share by Dimension
- Macroplastics
- Megaplastics
- Mesoplastics
- Microplastics
Market Share by Recycled Material
- Fibers
- Films
- Fishing Line
- Foams
- Plastic Bags
- Plastic Bottle
- Straws & Stirrers
- Others
Market Share by Source of Material
- Beach & Shoreline Cleanup
- Deep Ocean & Sea Surface
- Fishing Gear Recovery
- River Waste Interception
Market Share by Processing Method
- Chemical
- Energy Recovery
- Mechanical
Market Share by Recycled Product Form
- Pellets
- Sheets
Market Share by End Use Industry
- Aerospace and Defense
- Automotive
- Building & Construction
- Electrical & Electronics
- Furniture
- Packaging
- Textile & Clothing
- Others
Market Share by Distribution Channel
- Direct Sales
- Distributors
- Retail / E-Commerce
Market Share by Geographical Regions
- North America
- US
- Canada
- Mexico
- Rest of North America
- Europe
- Austria
- Belgium
- Denmark
- France
- Germany
- Ireland
- Italy
- Netherlands
- Norway
- Russia
- Spain
- Sweden
- Switzerland
- UK
- Rest of Europe
- Asia-Pacific
- Australia
- China
- India
- Japan
- New-Zealand
- Singapore
- South Korea
- Rest of Asia-Pacific
- Latin America
- Brazil
- Chile
- Colombia
- Venezuela
- Rest of Latin America
- Middle East and Africa (MEA)
- Egypt
- Iran
- Iraq
- Israel
- Kuwait
- Saudi Arabia
- UAE
- Rest of MEA
Example Players in Recycled Ocean Plastics Market
- 4Ocean
- Adidas
- Aquafil
- BIONIC
- Bureo
- ECOALF
- Envision Plastics
- Interface
- Method Products
- Norton Point
- Ocean Plastic Technologies
- Parley
- Patagonia
- Plastix
- Plastic Bank
- Repreve
- Resynergi
- UPM Raflatac
- United By Blue
- Waste2Wear
- Waterhaul
Recycled Ocean Plastics Market: Report Coverage
The report on the recycled ocean plastics market features insights on various sections, including:
- Market Sizing and Opportunity Analysis: An in-depth analysis of the recycled ocean plastics market, focusing on key market segments, including [A] type of plastic, [B] dimension, [C] recycled material, [D] source of material, [E] processing method, [F] recycled product form, [G] end use industry, [H] distribution channel, and [I] geographical regions.
- Competitive Landscape: A comprehensive analysis of the companies engaged in the recycled ocean plastics market, based on several relevant parameters, such as [A] year of establishment, [B] company size, [C] location of headquarters and [D] ownership structure.
- Company Profiles: Elaborate profiles of prominent players engaged in the recycled ocean plastics market, providing details on [A] location of headquarters, [B] company size, [C] company mission, [D] company footprint, [E] management team, [F] contact details, [G] financial information, [H] operating business segments, [I] product / technology portfolio, [J] recent developments, and an informed future outlook.
- Megatrends: An evaluation of ongoing megatrends in the recycled ocean plastics industry.
- Patent Analysis: An insightful analysis of patents filed / granted in the recycled ocean plastics domain, based on relevant parameters, including [A] type of patent, [B] patent publication year, [C] patent age and [D] leading players.
- Recent Developments: An overview of the recent developments made in the recycled ocean plastics market, along with analysis based on relevant parameters, including [A] year of initiative, [B] type of initiative, [C] geographical distribution and [D] most active players.
- Porter's Five Forces Analysis: An analysis of five competitive forces prevailing in the recycled ocean plastics market, including threats of new entrants, bargaining power of buyers, bargaining power of suppliers, threats of substitute products and rivalry among existing competitors.
- SWOT Analysis: An insightful SWOT framework, highlighting the strengths, weaknesses, opportunities and threats in the domain. Additionally, it provides Harvey ball analysis, highlighting the relative impact of each SWOT parameter.
Key Questions Answered in this Report
- What is the current and future market size?
- Who are the leading companies in this market?
- What are the growth drivers that are likely to influence the evolution of this market?
- What are the key partnership and funding trends shaping this industry?
- Which region is likely to grow at higher CAGR till 2035?
- How is the current and future market opportunity likely to be distributed across key market segments?
Reasons to Buy this Report
- Detailed Market Analysis: The report provides a comprehensive market analysis, offering detailed revenue projections of the overall market and its specific sub-segments. This information is valuable to both established market leaders and emerging entrants.
- In-depth Analysis of Trends: Stakeholders can leverage the report to gain a deeper understanding of the competitive dynamics within the market. Each report maps ecosystem activity across partnerships, funding, and patent landscapes to reveal growth hotspots and white spaces in the industry.
- Opinion of Industry Experts: The report features extensive interviews and surveys with key opinion leaders and industry experts to validate market trends mentioned in the report.
- Decision-ready Deliverables: The report offers stakeholders with strategic frameworks (Porter's Five Forces, value chain, SWOT), and complimentary Excel / slide packs with customization support.
Additional Benefits
- Complimentary Dynamic Excel Dashboards for Analytical Modules
- Exclusive 15% Free Content Customization
- Personalized Interactive Report Walkthrough with Our Expert Research Team
- Free Report Updates for Versions Older than 6-12 Months
TABLE OF CONTENTS
1. PROJECT OVERVIEW
- 1.1. Context
- 1.2. Project Objectives
2. RESEARCH METHODOLOGY
- 2.1. Chapter Overview
- 2.2. Research Assumptions
- 2.3. Database Building
- 2.3.1. Data Collection
- 2.3.2. Data Validation
- 2.3.3. Data Analysis
- 2.4. Project Methodology
- 2.4.1. Secondary Research
- 2.4.1.1. Annual Reports
- 2.4.1.2. Academic Research Papers
- 2.4.1.3. Company Websites
- 2.4.1.4. Investor Presentations
- 2.4.1.5. Regulatory Filings
- 2.4.1.6. White Papers
- 2.4.1.7. Industry Publications
- 2.4.1.8. Conferences and Seminars
- 2.4.1.9. Government Portals
- 2.4.1.10. Media and Press Releases
- 2.4.1.11. Newsletters
- 2.4.1.12. Industry Databases
- 2.4.1.13. Roots Proprietary Databases
- 2.4.1.14. Paid Databases and Sources
- 2.4.1.15. Social Media Portals
- 2.4.1.16. Other Secondary Sources
- 2.4.2. Primary Research
- 2.4.2.1. Introduction
- 2.4.2.2. Types
- 2.4.2.2.1. Qualitative
- 2.4.2.2.2. Quantitative
- 2.4.2.3. Advantages
- 2.4.2.4. Techniques
- 2.4.2.4.1. Interviews
- 2.4.2.4.2. Surveys
- 2.4.2.4.3. Focus Groups
- 2.4.2.4.4. Observational Research
- 2.4.2.4.5. Social Media Interactions
- 2.4.2.5. Stakeholders
- 2.4.2.5.1. Company Executives (CXOs)
- 2.4.2.5.2. Board of Directors
- 2.4.2.5.3. Company Presidents and Vice Presidents
- 2.4.2.5.4. Key Opinion Leaders
- 2.4.2.5.5. Research and Development Heads
- 2.4.2.5.6. Technical Experts
- 2.4.2.5.7. Subject Matter Experts
- 2.4.2.5.8. Scientists
- 2.4.2.5.9. Doctors and Other Healthcare Providers
- 2.4.2.6. Ethics and Integrity
- 2.4.2.6.1. Research Ethics
- 2.4.2.6.2. Data Integrity
- 2.4.3. Analytical Tools and Databases
- 2.4.1. Secondary Research
3. MARKET DYNAMICS
- 3.1. Forecast Methodology
- 3.1.1. Top-Down Approach
- 3.1.2. Bottom-Up Approach
- 3.1.3. Hybrid Approach
- 3.2. Market Assessment Framework
- 3.2.1. Total Addressable Market (TAM)
- 3.2.2. Serviceable Addressable Market (SAM)
- 3.2.3. Serviceable Obtainable Market (SOM)
- 3.2.4. Currently Acquired Market (CAM)
- 3.3. Forecasting Tools and Techniques
- 3.3.1. Qualitative Forecasting
- 3.3.2. Correlation
- 3.3.3. Regression
- 3.3.4. Time Series Analysis
- 3.3.5. Extrapolation
- 3.3.6. Convergence
- 3.3.7. Forecast Error Analysis
- 3.3.8. Data Visualization
- 3.3.9. Scenario Planning
- 3.3.10. Sensitivity Analysis
- 3.4. Key Considerations
- 3.4.1. Demographics
- 3.4.2. Market Access
- 3.4.3. Reimbursement Scenarios
- 3.4.4. Industry Consolidation
- 3.5. Robust Quality Control
- 3.6. Key Market Segmentations
- 3.7. Limitations
4. MACRO-ECONOMIC INDICATORS
- 4.1. Chapter Overview
- 4.2. Market Dynamics
- 4.2.1. Time Period
- 4.2.1.1. Historical Trends
- 4.2.1.2. Current and Forecasted Estimates
- 4.2.2. Currency Coverage
- 4.2.2.1. Overview of Major Currencies Affecting the Market
- 4.2.2.2. Impact of Currency Fluctuations on the Industry
- 4.2.3. Foreign Exchange Impact
- 4.2.3.1. Evaluation of Foreign Exchange Rates and Their Impact on Market
- 4.2.3.2. Strategies for Mitigating Foreign Exchange Risk
- 4.2.4. Recession
- 4.2.4.1. Historical Analysis of Past Recessions and Lessons Learnt
- 4.2.4.2. Assessment of Current Economic Conditions and Potential Impact on the Market
- 4.2.5. Inflation
- 4.2.5.1. Measurement and Analysis of Inflationary Pressures in the Economy
- 4.2.5.2. Potential Impact of Inflation on the Market Evolution
- 4.2.6. Interest Rates
- 4.2.6.1. Overview of Interest Rates and Their Impact on the Market
- 4.2.6.2. Strategies for Managing Interest Rate Risk
- 4.2.7. Commodity Flow Analysis
- 4.2.7.1. Type of Commodity
- 4.2.7.2. Origins and Destinations
- 4.2.7.3. Values and Weights
- 4.2.7.4. Modes of Transportation
- 4.2.8. Global Trade Dynamics
- 4.2.8.1. Import Scenario
- 4.2.8.2. Export Scenario
- 4.2.9. War Impact Analysis
- 4.2.9.1. Russian-Ukraine War
- 4.2.9.2. Israel-Hamas War
- 4.2.10. COVID Impact / Related Factors
- 4.2.10.1. Global Economic Impact
- 4.2.10.2. Industry-specific Impact
- 4.2.10.3. Government Response and Stimulus Measures
- 4.2.10.4. Future Outlook and Adaptation Strategies
- 4.2.11. Other Indicators
- 4.2.11.1. Fiscal Policy
- 4.2.11.2. Consumer Spending
- 4.2.11.3. Gross Domestic Product (GDP)
- 4.2.11.4. Employment
- 4.2.11.5. Taxes
- 4.2.11.6. R&D Innovation
- 4.2.11.7. Stock Market Performance
- 4.2.11.8. Supply Chain
- 4.2.11.9. Cross-Border Dynamics
- 4.2.1. Time Period
- 4.3. Concluding Remarks
5. EXECUTIVE SUMMARY
6. INTRODUCTION
- 6.1. Overview of Recycled Ocean Plastics Market
- 6.2. Application Areas for Recycled Ocean Plastics
- 6.3. Advantages of Recycling Ocean Plastics
- 6.4. Challenges Associated with Recycling Ocean Plastics
- 6.5. Future Perspective
7. REGULATORY SCENARIO
8. COMPREHENSIVE DATABASE OF LEADING PLAYERS
9. COMPETITIVE LANDSCAPE
- 9.1. Chapter Overview
- 9.2. Gallium-Oxide Power Devices Market: Overall Market Landscape
- 9.2.1. Analysis by Year of Establishment
- 9.2.2. Analysis by Company Size
- 9.2.3. Analysis by Location of Headquarters
- 9.2.4. Analysis by Type of Company
- 9.3. Key Findings
10. WHITE SPACE ANALYSIS
11. COMPANY COMPETITIVENESS ANALYSIS
12. STARTUP ECOSYSTEM ANALYSIS
- 12.1. Gallium-Oxide Power Devices Market: Startup Ecosystem Analysis
- 12.1.1. Analysis by Year of Establishment
- 12.1.2. Analysis by Company Size
- 12.1.3. Analysis by Location of Headquarters
- 12.1.4. Analysis by Ownership Type
- 12.2. Key Findings
13. COMPANY PROFILES
- 13.1. Chapter Overview
- 13.2. 4Ocean*
- 13.2.1. Company Overview
- 13.2.2. Company Mission
- 13.2.3. Company Footprint
- 13.2.4. Management Team
- 13.2.5. Contact Details
- 13.2.6. Financial Performance
- 13.2.7. Operating Business Segments
- 13.2.8. Service / Product Portfolio (project specific)
- 13.2.9. MOAT Analysis
- 13.2.10. Recent Developments and Future Outlook
- similar details are presented for other below mentioned companies based on information in the public domain
- 13.3. Adidas
- 13.4. Aquafill
- 13.5. BIONIC
- 13.6. ECOALF
- 13.7. Envision Plastics
- 13.8. Interface
- 13.9. Method Products
- 13.10. Norton Point
- 13.11. Ocean Plastic Technologies
- 13.12. OCEANPLASTIK
- 13.13. Ocean Waste Plastic
- 13.14. Oceanworks
- 13.15. Parley
- 13.16. Patagonia
- 13.17. Plastix
- 13.18. Plastic Bank
- 13.19. POPSICASE
- 13.20. Prevented Ocean Plastic
- 13.21. Repreve
- 13.22. Resynergi
- 13.23. SEAQUAL INITIATIVE
- 13.24. Textil Santanderina
- 13.25. TerraCycle
- 13.26. The Ocean Cleanup
- 13.27. Tide Ocean
- 13.28. UPM Raflatac
- 13.29. United By Blue
- 13.30. Waste2Wear
- 13.31. Waterhaul
14. MEGA TRENDS ANALYSIS
15. UNMET NEED ANALYSIS
16. PATENT ANALYSIS
17. RECENT DEVELOPMENTS
- 17.1. Chapter Overview
- 17.2. Recent Funding
- 17.3. Recent Partnerships
- 17.4. Other Recent Initiatives
18. GLOBAL RECYCLED OCEAN PLASTICS MARKET
- 18.1. Chapter Overview
- 18.2. Key Assumptions and Methodology
- 18.3. Trends Disruption Impacting Market
- 18.4. Demand Side Trends
- 18.5. Supply Side Trends
- 18.6. Global Recycled Ocean Plastics Market, Historical Trends (Since 2020) and Forecasted Estimates (Till 2035)
- 18.7. Multivariate Scenario Analysis
- 18.7.1. Conservative Scenario
- 18.7.2. Optimistic Scenario
- 18.8. Investment Feasibility Index
- 18.9. Key Market Segmentations
19. MARKET OPPORTUNITIES BASED ON TYPE OF PLASTIC
- 19.1. Chapter Overview
- 19.2. Key Assumptions and Methodology
- 19.3. Revenue Shift Analysis
- 19.4. Market Movement Analysis
- 19.5. Penetration-Growth (P-G) Matrix
- 19.6. Recycled Ocean Plastics Market for High-Density Polyethylene (HDPE): Historical Trends (Since 2020) and Forecasted Estimates (Till 2035)
- 19.7. Recycled Ocean Plastics Market for Low-Density Polyethylene (LDPE): Historical Trends (Since 2020) and Forecasted Estimates (Till 2035)
- 19.8. Recycled Ocean Plastics Market for Polyethylene Terephthalate (PET): Historical Trends (Since 2020) and Forecasted Estimates (Till 2035)
- 19.9. Recycled Ocean Plastics Market for Polypropylene (PP): Historical Trends (Since 2020) and Forecasted Estimates (Till 2035)
- 19.10. Recycled Ocean Plastics Market for Polystyrene (PS): Historical Trends (Since 2020) and Forecasted Estimates (Till 2035)
- 19.11. Recycled Ocean Plastics Market for Polyvinyl Chloride (PVC): Historical Trends (Since 2020) and Forecasted Estimates (Till 2035)
- 19.12. Recycled Ocean Plastics Market for Polyurethane (PUR): Historical Trends (Since 2020) and Forecasted Estimates (Till 2035)
- 19.13. Recycled Ocean Plastics Market for Others: Historical Trends (Since 2020) and Forecasted Estimates (Till 2035)
- 19.14. Data Triangulation and Validation
- 19.14.1. Secondary Sources
- 19.14.2. Primary Sources
- 19.14.3. Statistical Modeling
20. MARKET OPPORTUNITIES BASED ON DIMENSION
- 20.1. Chapter Overview
- 20.2. Key Assumptions and Methodology
- 20.3. Revenue Shift Analysis
- 20.4. Market Movement Analysis
- 20.5. Penetration-Growth (P-G) Matrix
- 20.6. Recycled Ocean Plastics Market for Macroplastics: Historical Trends (Since 2020) and Forecasted Estimates (Till 2035)
- 20.7. Recycled Ocean Plastics Market for Megaplastics: Historical Trends (Since 2020) and Forecasted Estimates (Till 2035)
- 20.8. Recycled Ocean Plastics Market for Mesoplastics: Historical Trends (Since 2020) and Forecasted Estimates (Till 2035)
- 20.9. Recycled Ocean Plastics Market for Microplastics: Historical Trends (Since 2020) and Forecasted Estimates (Till 2035)
- 20.10. Data Triangulation and Validation
- 20.10.1. Secondary Sources
- 20.10.2. Primary Sources
- 20.10.3. Statistical Modeling
21. MARKET OPPORTUNITIES BASED ON RECYCLED MATERIAL
- 21.1. Chapter Overview
- 21.2. Key Assumptions and Methodology
- 21.3. Revenue Shift Analysis
- 21.4. Market Movement Analysis
- 21.5. Penetration-Growth (P-G) Matrix
- 21.6. Recycled Ocean Plastics Market for Fibers: Historical Trends (Since 2020) and Forecasted Estimates (Till 2035)
- 21.7. Recycled Ocean Plastics Market for Films: Historical Trends (Since 2020) and Forecasted Estimates (Till 2035)
- 21.8. Recycled Ocean Plastics Market for Fishing Line: Historical Trends (Since 2020) and Forecasted Estimates (Till 2035)
- 21.9. Recycled Ocean Plastics Market for Foams: Historical Trends (Since 2020) and Forecasted Estimates (Till 2035)
- 21.10. Recycled Ocean Plastics Market for Plastic Bags: Historical Trends (Since 2020) and Forecasted Estimates (Till 2035)
- 21.11. Recycled Ocean Plastics Market for Plastic Bottle: Historical Trends (Since 2020) and Forecasted Estimates (Till 2035)
- 21.12. Recycled Ocean Plastics Market for Straws & Stirrers: Historical Trends (Since 2020) and Forecasted Estimates (Till 2035)
- 21.13. Recycled Ocean Plastics Market for Others: Historical Trends (Since 2020) and Forecasted Estimates (Till 2035)
- 21.14. Data Triangulation and Validation
- 21.14.1. Secondary Sources
- 21.14.2. Primary Sources
- 21.14.3. Statistical Modeling
22. MARKET OPPORTUNITIES BASED ON SOURCE OF MATERIAL
- 22.1. Chapter Overview
- 22.2. Key Assumptions and Methodology
- 22.3. Revenue Shift Analysis
- 22.4. Market Movement Analysis
- 22.5. Penetration-Growth (P-G) Matrix
- 22.6. Recycled Ocean Plastics Market for Beach & Shoreline Cleanup: Historical Trends (Since 2020) and Forecasted Estimates (Till 2035)
- 22.7. Recycled Ocean Plastics Market for Deep Ocean & Sea Surface: Historical Trends (Since 2020) and Forecasted Estimates (Till 2035)
- 22.8. Recycled Ocean Plastics Market for Fishing Gear Recovery: Historical Trends (Since 2020) and Forecasted Estimates (Till 2035)
- 22.9. Recycled Ocean Plastics Market for River Waste Interception: Historical Trends (Since 2020) and Forecasted Estimates (Till 2035)
- 22.10. Data Triangulation and Validation
- 22.10.1. Secondary Sources
- 22.10.2. Primary Sources
- 22.10.3. Statistical Modeling
23. MARKET OPPORTUNITIES BASED ON PROCESSING METHOD
- 23.1. Chapter Overview
- 23.2. Key Assumptions and Methodology
- 23.3. Revenue Shift Analysis
- 23.4. Market Movement Analysis
- 23.5. Penetration-Growth (P-G) Matrix
- 23.6. Recycled Ocean Plastics Market for Chemical: Historical Trends (Since 2020) and Forecasted Estimates (Till 2035)
- 23.7. Recycled Ocean Plastics Market for Energy Recovery: Historical Trends (Since 2020) and Forecasted Estimates (Till 2035)
- 23.8. Recycled Ocean Plastics Market for Mechanical: Historical Trends (Since 2020) and Forecasted Estimates (Till 2035)
- 23.9. Data Triangulation and Validation
- 23.9.1. Secondary Sources
- 23.9.2. Primary Sources
- 23.9.3. Statistical Modeling
24. MARKET OPPORTUNITIES BASED ON RECYCLED PRODUCT FORM
- 24.1. Chapter Overview
- 24.2. Key Assumptions and Methodology
- 24.3. Revenue Shift Analysis
- 24.4. Market Movement Analysis
- 24.5. Penetration-Growth (P-G) Matrix
- 24.6. Recycled Ocean Plastics Market for Pellets: Historical Trends (Since 2020) and Forecasted Estimates (Till 2035)
- 24.7. Recycled Ocean Plastics Market for Sheets: Historical Trends (Since 2020) and Forecasted Estimates (Till 2035)
- 24.8. Data Triangulation and Validation
- 24.8.1. Secondary Sources
- 24.8.2. Primary Sources
- 24.8.3. Statistical Modeling
25. MARKET OPPORTUNITIES BASED ON END USE INDUSTRY
- 25.1. Chapter Overview
- 25.2. Key Assumptions and Methodology
- 25.3. Revenue Shift Analysis
- 25.4. Market Movement Analysis
- 25.5. Penetration-Growth (P-G) Matrix
- 25.6. Recycled Ocean Plastics Market for Aerospace and Defense: Historical Trends (Since 2020) and Forecasted Estimates (Till 2035)
- 25.7. Recycled Ocean Plastics Market for Automotive: Historical Trends (Since 2020) and Forecasted Estimates (Till 2035)
- 25.8. Recycled Ocean Plastics Market for Building & Construction: Historical Trends (Since 2020) and Forecasted Estimates (Till 2035)
- 25.9. Recycled Ocean Plastics Market for Electrical & Electronics: Historical Trends (Since 2020) and Forecasted Estimates (Till 2035)
- 25.10. Recycled Ocean Plastics Market for Furniture: Historical Trends (Since 2020) and Forecasted Estimates (Till 2035)
- 25.11. Recycled Ocean Plastics Market for Packaging: Historical Trends (Since 2020) and Forecasted Estimates (Till 2035)
- 25.12. Recycled Ocean Plastics Market for Textile & Clothing: Historical Trends (Since 2020) and Forecasted Estimates (Till 2035)
- 25.13. Recycled Ocean Plastics Market for Others: Historical Trends (Since 2020) and Forecasted Estimates (Till 2035)
- 25.14. Data Triangulation and Validation
- 25.14.1. Secondary Sources
- 25.14.2. Primary Sources
- 25.14.3. Statistical Modeling
26. MARKET OPPORTUNITIES BASED ON DISTRIBUTION CHANNEL
- 26.1. Chapter Overview
- 26.2. Key Assumptions and Methodology
- 26.3. Revenue Shift Analysis
- 26.4. Market Movement Analysis
- 26.5. Penetration-Growth (P-G) Matrix
- 26.6. Recycled Ocean Plastics Market for Direct Sales: Historical Trends (Since 2020) and Forecasted Estimates (Till 2035)
- 26.7. Recycled Ocean Plastics Market for Distributors: Historical Trends (Since 2020) and Forecasted Estimates (Till 2035)
- 26.8. Recycled Ocean Plastics Market for Retail / E-Commerce: Historical Trends (Since 2020) and Forecasted Estimates (Till 2035)
- 26.9. Data Triangulation and Validation
- 26.9.1. Secondary Sources
- 26.9.2. Primary Sources
- 26.9.3. Statistical Modeling
27. MARKET OPPORTUNITIES FOR RECYCLED OCEAN PLASTICS IN EUROPE
- 27.1. Chapter Overview
- 27.2. Key Assumptions and Methodology
- 27.3. Revenue Shift Analysis
- 27.4. Market Movement Analysis
- 27.5. Penetration-Growth (P-G) Matrix
- 27.6. Recycled Ocean Plastics Market in Europe: Historical Trends (Since 2020) and Forecasted Estimates (Till 2035)
- 27.6.1. Recycled Ocean Plastics Market in Austria: Historical Trends (Since 2020) and Forecasted Estimates (Till 2035)
- 27.6.2. Recycled Ocean Plastics Market in Belgium: Historical Trends (Since 2020) and Forecasted Estimates (Till 2035)
- 27.6.3. Recycled Ocean Plastics Market in Denmark: Historical Trends (Since 2020) and Forecasted Estimates (Till 2035)
- 27.6.4. Recycled Ocean Plastics Market in France: Historical Trends (Since 2020) and Forecasted Estimates (Till 2035)
- 27.6.5. Recycled Ocean Plastics Market in Germany: Historical Trends (Since 2020) and Forecasted Estimates (Till 2035)
- 27.6.6. Recycled Ocean Plastics Market in Ireland: Historical Trends (Since 2020) and Forecasted Estimates (Till 2035)
- 27.6.7. Recycled Ocean Plastics Market in Italy: Historical Trends (Since 2020) and Forecasted Estimates (Till 2035)
- 27.6.8. Recycled Ocean Plastics Market in Netherlands: Historical Trends (Since 2020) and Forecasted Estimates (Till 2035)
- 27.6.9. Recycled Ocean Plastics Market in Norway: Historical Trends (Since 2020) and Forecasted Estimates (Till 2035)
- 27.6.10. Recycled Ocean Plastics Market in Russia: Historical Trends (Since 2020) and Forecasted Estimates (Till 2035)
- 27.6.11. Recycled Ocean Plastics Market in Spain: Historical Trends (Since 2020) and Forecasted Estimates (Till 2035)
- 27.6.12. Recycled Ocean Plastics Market in Sweden: Historical Trends (Since 2020) and Forecasted Estimates (Till 2035)
- 27.6.13. Recycled Ocean Plastics Market in Switzerland: Historical Trends (Since 2020) and Forecasted Estimates (Till 2035)
- 27.6.14. Recycled Ocean Plastics Market in the UK: Historical Trends (Since 2020) and Forecasted Estimates (Till 2035)
- 27.6.15. Recycled Ocean Plastics Market in Rest of Europe: Historical Trends (Since 2020) and Forecasted Estimates (Till 2035)
- 27.7. Data Triangulation and Validation
28. MARKET OPPORTUNITIES FOR RECYCLED OCEAN PLASTICS IN ASIA-PACIFIC
- 28.1. Chapter Overview
- 28.2. Key Assumptions and Methodology
- 28.3. Revenue Shift Analysis
- 28.4. Market Movement Analysis
- 28.5. Penetration-Growth (P-G) Matrix
- 28.6. Recycled Ocean Plastics Market in Asia-Pacific: Historical Trends (Since 2020) and Forecasted Estimates (Till 2035)
- 28.6.1. Recycled Ocean Plastics Market in Australia: Historical Trends (Since 2020) and Forecasted Estimates (Till 2035)
- 28.6.2. Recycled Ocean Plastics Market in China: Historical Trends (Since 2020) and Forecasted Estimates (Till 2035)
- 28.6.3. Recycled Ocean Plastics Market in India: Historical Trends (Since 2020) and Forecasted Estimates (Till 2035)
- 28.6.4. Recycled Ocean Plastics Market in Japan: Historical Trends (Since 2020) and Forecasted Estimates (Till 2035)
- 28.6.5. Recycled Ocean Plastics Market in New Zealand: Historical Trends (Since 2020) and Forecasted Estimates (Till 2035)
- 28.6.6. Recycled Ocean Plastics Market in Singapore: Historical Trends (Since 2020) and Forecasted Estimates (Till 2035)
- 28.6.7. Recycled Ocean Plastics Market in South Korea: Historical Trends (Since 2020) and Forecasted Estimates (Till 2035)
- 28.6.8. Recycled Ocean Plastics Market in Rest of Asia Pacific: Historical Trends (Since 2020) and Forecasted Estimates (Till 2035)
- 28.7. Data Triangulation and Validation
29. MARKET OPPORTUNITIES FOR RECYCLED OCEAN PLASTICS IN LATIN AMERICA
- 29.1. Chapter Overview
- 29.2. Key Assumptions and Methodology
- 29.3. Revenue Shift Analysis
- 29.4. Market Movement Analysis
- 29.5. Penetration-Growth (P-G) Matrix
- 29.6. Recycled Ocean Plastics Market in Latin America: Historical Trends (Since 2020) and Forecasted Estimates (Till 2035)
- 29.6.1. Recycled Ocean Plastics Market in Argentina: Historical Trends (Since 2020) and Forecasted Estimates (Till 2035)
- 29.6.2. Recycled Ocean Plastics Market in Brazil: Historical Trends (Since 2020) and Forecasted Estimates (Till 2035)
- 29.6.3. Recycled Ocean Plastics Market in Chile: Historical Trends (Since 2020) and Forecasted Estimates (Till 2035)
- 29.6.4. Recycled Ocean Plastics Market in Colombia Historical Trends (Since 2020) and Forecasted Estimates (Till 2035)
- 29.6.5. Recycled Ocean Plastics Market in Venezuela: Historical Trends (Since 2020) and Forecasted Estimates (Till 2035)
- 29.6.6. Recycled Ocean Plastics Market in Rest of Latin America: Historical Trends (Since 2020) and Forecasted Estimates (Till 2035)
- 29.7. Data Triangulation and Validation
30. MARKET OPPORTUNITIES FOR RECYCLED OCEAN PLASTICS IN THE MIDDLE EAST AND AFRICA (MEA)
- 30.1. Chapter Overview
- 30.2. Key Assumptions and Methodology
- 30.3. Revenue Shift Analysis
- 30.4. Market Movement Analysis
- 30.5. Penetration-Growth (P-G) Matrix
- 30.6. Recycled Ocean Plastics Market in Middle East and Africa (MEA): Historical Trends (Since 2020) and Forecasted Estimates (Till 2035)
- 30.6.1. Recycled Ocean Plastics Market in Egypt: Historical Trends (Since 2020) and Forecasted Estimates (Till 205)
- 30.6.2. Recycled Ocean Plastics Market in Iran: Historical Trends (Since 2020) and Forecasted Estimates (Till 2035)
- 30.6.3. Recycled Ocean Plastics Market in Iraq: Historical Trends (Since 2020) and Forecasted Estimates (Till 2035)
- 30.6.4. Recycled Ocean Plastics Market in Israel: Historical Trends (Since 2020) and Forecasted Estimates (Till 2035)
- 30.6.5. Recycled Ocean Plastics Market in Kuwait: Historical Trends (Since 2020) and Forecasted Estimates (Till 2035)
- 30.6.6. Recycled Ocean Plastics Market in New Zealand: Historical Trends (Since 2020) and Forecasted Estimates (Till 205)
- 30.6.7. Recycled Ocean Plastics Market in Saudi Arabia: Historical Trends (Since 2020) and Forecasted Estimates (Till 2035)
- 30.6.8. Recycled Ocean Plastics Market in United Arab Emirates (UAE): Historical Trends (Since 2020) and Forecasted Estimates (Till 2035)
- 30.6.9. Recycled Ocean Plastics Market in Rest of MEA: Historical Trends (Since 2020) and Forecasted Estimates (Till 2035)
- 30.7. Data Triangulation and Validation
31. MARKET CONCENTRATION ANALYSIS: DISTRIBUTION BY LEADING PLAYERS
32. ADJACENT MARKET ANALYSIS
33. KEY WINNING STRATEGIES
34. PORTER'S FIVE FORCES ANALYSIS
35. SWOT ANALYSIS
36. VALUE CHAIN ANALYSIS
37. ROOTS STRATEGIC RECOMMENDATIONS
- 37.1. Chapter Overview
- 37.2. Key Business-related Strategies
- 37.2.1. Research & Development
- 37.2.2. Product Manufacturing
- 37.2.3. Commercialization / Go-to-Market
- 37.2.4. Sales and Marketing
- 37.3. Key Operations-related Strategies
- 37.3.1. Risk Management
- 37.3.2. Workforce
- 37.3.3. Finance
- 37.3.4. Others


