


 |
市場調查報告書
商品編碼
2037822
遊戲化市場(至2035年):按組件類型、應用領域、部署模式、組織規模、最終用戶產業、地區和主要參與者分類:產業趨勢和全球市場預測Gamification Market, Till 2035: Distribution by Type of Component, Application Area, Deployment Mode, Organization Size, End Use Industry, Geographical Regions and Key Players: Industry Trends and Global Forecasts |
||||||
遊戲化市場展望
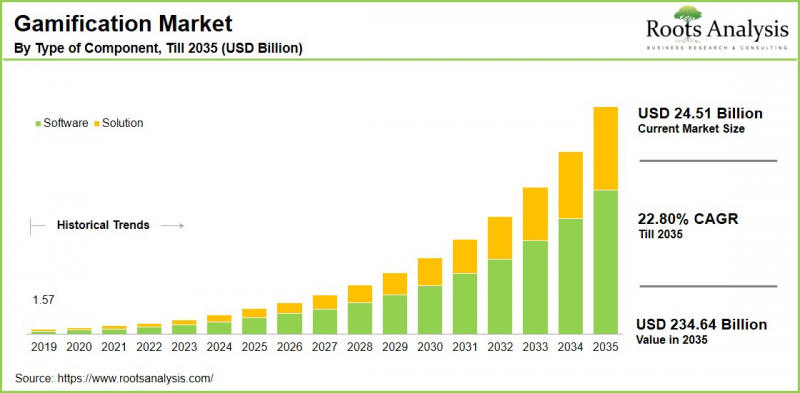
根據 Roots Analysis 的研究,全球遊戲化市場預計到 2035 年將以 22.80% 的複合年成長率成長,從目前的 245.1 億美元成長到 2035 年的 2346.4 億美元。
遊戲化是指將遊戲設計元素和機制策略性地融入非遊戲環境,以提升使用者參與度,尤其是在成人教育等複雜領域。透過引入互動式和獎勵驅動的體驗,遊戲化能夠培養創造力、想像和問題解決能力,同時使原本困難的任務更具吸引力和可操作性。因此,遊戲化已被廣泛應用於行銷、教育和醫療保健等領域,以提高用戶參與度和整體效率。
在商業和行銷領域,遊戲化正日益被用於促進數位化工具和學習管理系統的應用,從而提升員工敬業度、留存率和生產力。 Axonify 和 Centrical 等平台能夠實現系統化的知識共用,有助於提高員工績效和滿意度。這一趨勢在企業培訓領域尤其明顯,各組織正在整合遊戲化驅動的解決方案來加強人才發展。此外,人工智慧、機器學習、虛擬實境 (VR) 和擴增實境(AR) 等技術的快速發展正在改變遊戲化的格局。隨著行動裝置的普及和遊戲化方法的不斷創新,預計全球遊戲化市場將在預測期內顯著成長。
遊戲化市場成長的關鍵市場促進因素
遊戲化市場的發展受到數位轉型措施、不斷變化的客戶期望以及快速的技術進步的共同推動。隨著企業擴大採用混合辦公模式,遊戲化正被應用於提升員工敬業度、生產力和跨團隊協作,同時實現可衡量的績效追蹤和更高的員工留存率。同時,對個人化客戶體驗日益成長的需求正促使企業將遊戲化融入其行銷策略,提供互動式和客製化的互動解決方案。此類解決方案能夠增強品牌忠誠度並推動營收成長。
此外,人工智慧、虛擬實境(VR)和擴增實境(AR)等身臨其境型技術的進步,正推動著高度適應性和個人化遊戲化體驗的開發。這些創新正在加速遊戲化技術在整體業務職能中的應用,以鞏固其作為提升用戶參與度和拓展市場關鍵驅動力的地位。
遊戲化市場:產業公司競爭格局
目前的遊戲化市場呈現出多元化的格局,既有大型科技公司,也有中小型軟體和服務供應商,以及新興新創公司。成熟企業憑藉其龐大的基本客群、先進的雲端基礎設施和整合的數位化能力,提供擴充性的企業級遊戲化解決方案。此外,專業服務提供者和利基市場參與者專注於創新,提供客製化平台和特定領域的解決方案,以滿足客戶的獨特需求。所有這些參與者共同協作,形成了一個由規模和創新驅動的充滿活力的市場環境。
新創企業透過創新技術推動市場擴張
新興新創公司正透過利用人工智慧驅動的個人化、身臨其境型環境和基於區塊鏈的獎勵系統等技術來提升用戶參與度,從而在推動下一代遊戲化方面發揮著至關重要的作用。例如,總部位於阿拉伯聯合大公國的遊戲化技術新創公司 PlaysOut 近期完成了 700 萬美元的種子輪融資,估值達到 7,000 萬美元。
Playgama 在 The Open Platform主導、FJ Labs 和 The Games Fund 跟投的資金籌措輪中籌集了 300 萬美元,這再次印證了投資者對以開發者為中心的遊戲化基礎設施的強勁信心。這些新創公司專注於去中心化架構、基於 NFT 的獎勵以及與 Web3 生態系統的整合等新興趨勢,致力於提供差異化且創新的遊戲化解決方案,以滿足數位原生用戶的共鳴。這些資金籌措活動的強勁勢頭凸顯了人們日益認知到遊戲化在變革用戶互動模式以及推動商業環境中高級遊戲化應用普及方面的潛力。
預測期內,電信和IT產業將推動市場成長。
預計在整個預測期內,IT和電信業將成為遊戲化市場成長的主要驅動力。這是因為為了應對激烈的市場競爭和不斷變化的客戶期望,各組織正在加強遊戲化解決方案的採用。 Verizon和Vodafone等領先的通訊業者正在將遊戲化融入其數位平台,以增強客戶參與,並利用互動入口網站和獎勵機制來提高用戶忠誠度。
此外,東南亞的通訊業者正在將遊戲化元素融入忠誠度計畫中,允許客戶透過小型遊戲和獎勵兌換積分,從而提高應用參與度和產生收入。除了面向客戶的應用之外,遊戲化還能透過收集詳細的使用者行為數據來實現服務個人化,進而支援精準行銷策略。
在持續推進的數位轉型措施和雲端平台擴展的支持下,遊戲化技術在該領域的應用預計將加速,從而顯著促進整體市場成長。
遊戲化市場:主要市場區隔
組件類型
- 解決方案
- 服務
應用領域
- 客戶參與
- 人力資源與員工敬業度
- 忠誠度計畫
- 行銷
- 產品開發
- 銷售
- 培訓和教育
部署模式
- 雲
- 現場
公司規模
- 大公司
- 小型企業
終端用戶產業
- 金融、保險和服務
- 教育
- 醫療保健
- 資訊科技/通訊
- 媒體與娛樂
- 零售
- 其他
地區
- 北美洲
- 美國
- 加拿大
- 墨西哥
- 其他北美國家
- 歐洲
- 奧地利
- 比利時
- 丹麥
- 法國
- 德國
- 愛爾蘭
- 義大利
- 荷蘭
- 挪威
- 俄羅斯
- 西班牙
- 瑞典
- 瑞士
- 英國
- 其他歐洲國家
- 亞洲
- 中國
- 印度
- 日本
- 新加坡
- 韓國
- 其他亞洲國家
- 拉丁美洲
- 巴西
- 智利
- 哥倫比亞
- 委內瑞拉
- 其他拉丁美洲國家
- 中東和北非
- 埃及
- 伊朗
- 伊拉克
- 以色列
- 科威特
- 沙烏地阿拉伯
- 阿拉伯聯合大公國
- 其他中東和北非國家
- 世界其他地區
- 澳洲
- 紐西蘭
- 其他國家
本報告對全球遊戲化市場進行了分析,提供了概述、背景、市場影響因素分析、市場規模趨勢和預測、各個細分市場的詳細分析、競爭格局以及主要公司的概況。
目錄
第1章:序言
第2章:調查方法
第3章 經濟及其他項目特定考量因素
第4章 宏觀經濟指標
第5章摘要整理
第6章:引言
第7章 競爭情勢
第8章:公司簡介
- 章節概要
- Actionable Gamification
- Ambition Solution
- Aon Plc
- Ascent Cloud
- Axonify
- Badgeville
- BI WORLDWIDE
- BIZ_Effective
- Centrical
- Classcraft
- Cognizant
- FrogAsia
- GamEffective
- Gametize
- G-Cube Webwide Software
- Influitive
- Kahoot
- LevelEleven
- Mambo Solutions
- Microsoft
- MPS
- Raydiant
- SAP
- Verint Systems
第9章:價值鏈分析
第10章 SWOT 分析
第11章:全球遊戲化市場
第12章 按組件分類的市場機會
第13章 按應用領域分類的市場機會
第14章 依部署模式分類的市場機會
第15章 依組織規模分類的市場機會
第16章 終端用戶產業的市場機會
第17章 北美遊戲化市場機遇
第18章 歐洲遊戲化市場機遇
第19章:亞洲遊戲化市場機遇
第20章:中東和北非遊戲化市場的機會
第21章 拉丁美洲遊戲化市場機遇
第22章 遊戲化在世界其他地區的市場機會
第23章:表格形式數據
第24章 公司與組織列表
第25章 客製化的機會
第26章:ROOTS的策略建議
第26章 作者信息
Gamification Market Outlook
As per Roots Analysis, the global gamification market size is estimated to grow from USD 24.51 billion in the current year to USD 234.64 billion by 2035, at a CAGR of 22.80% during the forecast period, till 2035.
Gamification refers to the strategic incorporation of game design elements and mechanics into non-game environments to enhance user engagement and participation, particularly in complex domains such as adult learning. By introducing interactive and reward-driven experiences, it fosters creativity, imagination, and problem-solving capabilities, while making otherwise challenging tasks more engaging and accessible. As a result, gamification has been widely adopted across sectors including marketing, education, and healthcare to improve user involvement and overall effectiveness.
In corporate and marketing context, gamification is increasingly leveraged to drive the adoption of digital tools and learning management systems, thereby enhancing employee engagement, retention, and productivity. Platforms such as Axonify and Centrical enable structured knowledge sharing and contribute to improved workforce performance and satisfaction. This trend is particularly evident in corporate training, where organizations are integrating gamified solutions to strengthen workforce development. Furthermore, rapid advancements in technologies such as artificial intelligence, machine learning, virtual reality (VR), and augmented reality (AR) are transforming the gamification landscape. Coupled with the widespread adoption of mobile devices and continuous innovation in gamification techniques, the global gamification market is expected to rise significantly throughout the forecast period.
Strategic Insights for Senior Leaders
Key Drivers Propelling Growth of Gamification Market
The gamification market is being propelled by convergence of digital transformation initiatives, evolving customer expectations, and rapid technological advancements. As organizations increasingly adopt hybrid work models, gamification is deployed to enhance employee engagement, productivity, and collaboration across distributed teams, while enabling measurable performance tracking and improved retention. Simultaneously, the rising demand for personalized customer experiences is encouraging enterprises to integrate gamification into marketing strategies, delivering interactive and tailored engagement solutions. Such solutions strengthen brand loyalty and drive revenue growth.
Further, advancements in artificial intelligence and immersive technologies, such as virtual and augmented reality, are enabling the development of adaptive, highly personalized gamified experiences. These innovations are accelerating adoption across business functions and reinforcing the role of gamification as a key enabler of enhanced user engagement and market expansion.
Gamification Market: Competitive Landscape of Companies in this Industry
The current landscape of the gamification market is characterized by a diverse mix of large technology enterprises, small and medium-sized software and service providers, and emerging startups. Established companies leverage their extensive customer base, advanced cloud infrastructure, and integrated digital capabilities to deliver scalable, enterprise-grade gamification solutions. Further, specialized providers and niche players focus on innovation, offering tailored platforms and domain-specific solutions to address unique customer requirements. Together, these participants contribute to a dynamic market environment driven by both scale and innovation
Startups Driving Market Expansion Through Innovative Technologies
Emerging startups are playing a pivotal role in advancing next-generation gamification by leveraging technologies such as artificial intelligence-driven personalization, immersive environments, and blockchain-enabled reward systems to enhance user engagement. For instance, recently, UAE-based gametech startup PlaysOut secured $7 million in seed funding at a $70 million valuation.
Similarly, Playgama raised $3 million in a funding round led by The Open Platform, alongside backing from FJ Labs and The Games Fund, underscoring strong investor confidence in developer-centric gamification infrastructure. By focusing on emerging trends such as decentralized architectures, NFT-based incentives, and integration with Web3 ecosystems, these startups are delivering differentiated and innovative gamification solutions that resonate with digitally native users. The momentum reflected in these funding activities highlights the growing recognition of gamification's potential to transform engagement models and drive adoption of advanced gamified applications across business environments.
Telecom and IT Sector Fueling Market Growth Over the Forecast Period
The IT and telecommunication sector is poised to be a key driver of growth in the gamification market throughout the forecast period, as organizations increasingly adopt gamified solutions to navigate intense competition and evolving customer expectations. Leading telecom providers such as Verizon and Vodafone have integrated gamification into their digital platforms to enhance customer engagement, utilizing interactive portals, and reward-based systems to strengthen user loyalty.
Additionally, operators in Southeast Asia are using game-like mechanics into loyalty programs, enabling customers to redeem points through mini-games and incentives, thereby increasing application engagement and revenue generation. Beyond customer-facing applications, gamification is also enabling service personalization by capturing detailed user behavior data, which supports targeted marketing strategies.
Supported by ongoing digital transformation initiatives and the expansion of cloud-based platforms, the sector is expected to witness accelerated adoption of gamification technologies, contributing significantly to overall market expansion.
Key Challenges in the Gamification Market
The gamification market faces several operational and strategic constraints that may impact its widespread adoption. Stringent data privacy regulations, (such as the General Data Protection Regulation), limit the extent of user data utilization, thereby restricting personalization capabilities and increasing the complexity of developing compliant solutions. In addition, the high upfront investment required for implementation and customization of gamification tools across enterprise systems presents a significant barrier. Furthermore, user adoption challenges persist, as poorly designed gamification strategies can lead to engagement fatigue or perceptions of manipulation. To sustain user interest and maximize effectiveness, organizations must continuously refine and innovate their gamification approaches.
Gamification Market: Key Market Segmentation
Type of Component
- Solutions
- Services
Application Area
- Customer Engagement
- Human Resources & Employee Engagement
- Loyalty Programs
- Marketing
- Product Development
- Sales
- Training & Education
Deployment Mode
- Cloud
- On-Premises
Organization Size
- Large Enterprises
- Small and Medium Enterprises (SMEs)
End Use Industry
- BFSI
- Education
- Healthcare
- IT & Telecommunication
- Media & Entertainment
- Retail
- Others
Geographical Regions
- North America
- US
- Canada
- Mexico
- Rest of North America
- Europe
- Austria
- Belgium
- Denmark
- France
- Germany
- Ireland
- Italy
- Netherlands
- Norway
- Russia
- Spain
- Sweden
- Switzerland
- UK
- Rest of Europe
- Asia
- China
- India
- Japan
- Singapore
- South Korea
- Rest of Asia
- Latin America
- Brazil
- Chile
- Colombia
- Venezuela
- Rest of Latin America
- Middle East and North Africa (MENA)
- Egypt
- Iran
- Iraq
- Israel
- Kuwait
- Saudi Arabia
- UAE
- Rest of the MENA
- Rest of the World
- Australia
- New Zealand
- Other countries
Example Players in Gamification Market
- Actionable Gamification
- Ambition Solutions
- Aon Plc
- Ascent Cloud
- Axonify
- Badgeville
- BI WORLDWIDE
- BIZ-Effective
- Centrical
- Classcraft
- Cognizant
- FrogAsia
- GamEffective
- Gametize
- G-Cube Webwide Software
- Influitive
- Kahoot
- LevelEleven
- Mambo Solutions
- Microsoft
- MPS
- Raydiant
- SAP
- Schoenckers
- Scrimmage
- Talented Learning
- The Game Agency
- Verint Systems
Gamification Market: Report Coverage
The report on the gamification market features insights on various sections, including:
- Market Sizing and Opportunity Analysis: An in-depth analysis of the gamification market, focusing on key market segments, including [A] type of component, [B] application area, [C] deployment mode, [D] organization size, [E] end use industry, [F] geographical regions and [G] key players.
- Competitive Landscape: A comprehensive analysis of the companies engaged in the gamification market, based on several relevant parameters, such as [A] year of establishment, [B] company size, [C] location of headquarters and [D] ownership structure.
- Company Profiles: Elaborate profiles of prominent players engaged in the gamification market, providing details on [A] location of headquarters, [B] company size, [C] company mission, [D] company footprint, [E] management team, [F] contact details, [G] financial information, [H] operating business segments, [I] product / technology portfolio, [J] recent developments, and an informed future outlook.
- Megatrends: An evaluation of ongoing megatrends in the gamification industry.
- Patent Analysis: An insightful analysis of patents filed / granted in the gamification domain, based on relevant parameters, including [A] type of patent, [B] patent publication year, [C] patent age and [D] leading players.
- Recent Developments: An overview of the recent developments made in the gamification market, along with analysis based on relevant parameters, including [A] year of initiative, [B] type of initiative, [C] geographical distribution and [D] most active players.
- Porter's Five Forces Analysis: An analysis of five competitive forces prevailing in the gamification market, including threats of new entrants, bargaining power of buyers, bargaining power of suppliers, threats of substitute products and rivalry among existing competitors.
- SWOT Analysis: An insightful SWOT framework, highlighting the strengths, weaknesses, opportunities and threats in the domain. Additionally, it provides Harvey ball analysis, highlighting the relative impact of each SWOT parameter.
Key Questions Answered in this Report
- What is the current and future market size?
- Who are the leading companies in this market?
- What are the growth drivers that are likely to influence the evolution of this market?
- What are the key partnership and funding trends shaping this industry?
- Which region is likely to grow at higher CAGR till 2035?
- How is the current and future market opportunity likely to be distributed across key market segments?
Reasons to Buy this Report
- Detailed Market Analysis: The report provides a comprehensive market analysis, offering detailed revenue projections of the overall market and its specific sub-segments. This information is valuable to both established market leaders and emerging entrants.
- In-depth Analysis of Trends: Stakeholders can leverage the report to gain a deeper understanding of the competitive dynamics within the market. Each report maps ecosystem activity across partnerships, funding, and patent landscapes to reveal growth hotspots and white spaces in the industry.
- Opinion of Industry Experts: The report features extensive interviews and surveys with key opinion leaders and industry experts to validate market trends mentioned in the report.
- Decision-ready Deliverables: The report offers stakeholders with strategic frameworks (Porter's Five Forces, value chain, SWOT), and complimentary Excel / slide packs with customization support.
Additional Benefits
- Complimentary Dynamic Excel Dashboards for Analytical Modules
- Exclusive 15% Free Content Customization
- Personalized Interactive Report Walkthrough with Our Expert Research Team
- Free Report Updates for Versions Older than 6-12 Months
TABLE OF CONTENTS
1. PREFACE
- 1.1. Introduction
- 1.2. Market Share Insights
- 1.3. Key Market Insights
- 1.4. Report Coverage
- 1.5. Key Questions Answered
- 1.6. Chapter Outlines
2. RESEARCH METHODOLOGY
- 2.1. Chapter Overview
- 2.2. Research Assumptions
- 2.3. Database Building
- 2.3.1. Data Collection
- 2.3.2. Data Validation
- 2.3.3. Data Analysis
- 2.4. Project Methodology
- 2.4.1. Secondary Research
- 2.4.1.1. Annual Reports
- 2.4.1.2. Academic Research Papers
- 2.4.1.3. Company Websites
- 2.4.1.4. Investor Presentations
- 2.4.1.5. Regulatory Filings
- 2.4.1.6. White Papers
- 2.4.1.7. Industry Publications
- 2.4.1.8. Conferences and Seminars
- 2.4.1.9. Government Portals
- 2.4.1.10. Media and Press Releases
- 2.4.1.11. Newsletters
- 2.4.1.12. Industry Databases
- 2.4.1.13. Roots Proprietary Databases
- 2.4.1.14. Paid Databases and Sources
- 2.4.1.15. Social Media Portals
- 2.4.1.16. Other Secondary Sources
- 2.4.2. Primary Research
- 2.4.2.1. Introduction
- 2.4.2.2. Types
- 2.4.2.2.1. Qualitative
- 2.4.2.2.2. Quantitative
- 2.4.2.3. Advantages
- 2.4.2.4. Techniques
- 2.4.2.4.1. Interviews
- 2.4.2.4.2. Surveys
- 2.4.2.4.3. Focus Groups
- 2.4.2.4.4. Observational Research
- 2.4.2.4.5. Social Media Interactions
- 2.4.2.5. Stakeholders
- 2.4.2.5.1. Company Executives (CXOs)
- 2.4.2.5.2. Board of Directors
- 2.4.2.5.3. Company Presidents and Vice Presidents
- 2.4.2.5.4. Key Opinion Leaders
- 2.4.2.5.5. Research and Development Heads
- 2.4.2.5.6. Technical Experts
- 2.4.2.5.7. Subject Matter Experts
- 2.4.2.5.8. Scientists
- 2.4.2.5.9. Doctors and Other Healthcare Providers
- 2.4.2.6. Ethics and Integrity
- 2.4.2.6.1. Research Ethics
- 2.4.2.6.2. Data Integrity
- 2.4.3. Analytical Tools and Databases
- 2.4.1. Secondary Research
3. ECONOMIC AND OTHER PROJECT SPECIFIC CONSIDERATIONS
- 3.1. Forecast Methodology
- 3.1.1. Top-Down Approach
- 3.1.2. Bottom-Up Approach
- 3.1.3. Hybrid Approach
- 3.2. Market Assessment Framework
- 3.2.1. Total Addressable Market (TAM)
- 3.2.2. Serviceable Addressable Market (SAM)
- 3.2.3. Serviceable Obtainable Market (SOM)
- 3.2.4. Currently Acquired Market (CAM)
- 3.3. Forecasting Tools and Techniques
- 3.3.1. Qualitative Forecasting
- 3.3.2. Correlation
- 3.3.3. Regression
- 3.3.4. Time Series Analysis
- 3.3.5. Extrapolation
- 3.3.6. Convergence
- 3.3.7. Forecast Error Analysis
- 3.3.8. Data Visualization
- 3.3.9. Scenario Planning
- 3.3.10. Sensitivity Analysis
- 3.4. Key Considerations
- 3.4.1. Demographics
- 3.4.2. Market Access
- 3.4.3. Reimbursement Scenarios
- 3.4.4. Industry Consolidation
- 3.5. Robust Quality Control
- 3.6. Key Market Segmentations
- 3.7. Limitations
4. MACRO-ECONOMIC INDICATORS
- 4.1. Chapter Overview
- 4.2. Market Dynamics
- 4.2.1. Time Period
- 4.2.1.1. Historical Trends
- 4.2.1.2. Current and Forecasted Estimates
- 4.2.2. Currency Coverage
- 4.2.2.1. Overview of Major Currencies Affecting the Market
- 4.2.2.2. Impact of Currency Fluctuations on the Industry
- 4.2.3. Foreign Exchange Impact
- 4.2.3.1. Evaluation of Foreign Exchange Rates and Their Impact on Market
- 4.2.3.2. Strategies for Mitigating Foreign Exchange Risk
- 4.2.4. Recession
- 4.2.4.1. Historical Analysis of Past Recessions and Lessons Learnt
- 4.2.4.2. Assessment of Current Economic Conditions and Potential Impact on the Market
- 4.2.5. Inflation
- 4.2.5.1. Measurement and Analysis of Inflationary Pressures in the Economy
- 4.2.5.2. Potential Impact of Inflation on the Market Evolution
- 4.2.6. Interest Rates
- 4.2.6.1. Overview of Interest Rates and Their Impact on the Market
- 4.2.6.2. Strategies for Managing Interest Rate Risk
- 4.2.7. Commodity Flow Analysis
- 4.2.7.1. Type of Commodity
- 4.2.7.2. Origins and Destinations
- 4.2.7.3. Values and Weights
- 4.2.7.4. Modes of Transportation
- 4.2.8. Global Trade Dynamics
- 4.2.8.1. Import Scenario
- 4.2.8.2. Export Scenario
- 4.2.9. War Impact Analysis
- 4.2.9.1. Russian-Ukraine War
- 4.2.9.2. Israel-Hamas War
- 4.2.10. COVID Impact / Related Factors
- 4.2.10.1. Global Economic Impact
- 4.2.10.2. Industry-specific Impact
- 4.2.10.3. Government Response and Stimulus Measures
- 4.2.10.4. Future Outlook and Adaptation Strategies
- 4.2.11. Other Indicators
- 4.2.11.1. Fiscal Policy
- 4.2.11.2. Consumer Spending
- 4.2.11.3. Gross Domestic Product (GDP)
- 4.2.11.4. Employment
- 4.2.11.5. Taxes
- 4.2.11.6. R&D Innovation
- 4.2.11.7. Stock Market Performance
- 4.2.11.8. Supply Chain
- 4.2.11.9. Cross-Border Dynamics
- 4.2.1. Time Period
5. EXECUTIVE SUMMARY
6. INTRODUCTION
- 6.1. Chapter Overview
- 6.2. Overview of Gamification Market
- 6.2.1. Type of Component
- 6.2.2. Type of Application
- 6.2.3. Type of Deployment
- 6.2.4. Type of Organization Size
- 6.2.5. Type of Vertical
- 6.3. Future Perspective
7. COMPETITIVE LANDSCAPE
- 7.1. Chapter Overview
- 7.2. Gamification: Overall Market Landscape
- 7.2.1. Analysis by Year of Establishment
- 7.2.2. Analysis by Company Size
- 7.2.3. Analysis by Location of Headquarters
- 7.2.4. Analysis by Ownership Structure
8. COMPANY PROFILES
- 8.1. Chapter Overview
- 8.2. Actionable Gamification*
- 8.2.1. Company Overview
- 8.2.2. Company Mission
- 8.2.3. Company Footprint
- 8.2.4. Management Team
- 8.2.5. Contact Details
- 8.2.6. Financial Performance
- 8.2.7. Operating Business Segments
- 8.2.8. Service / Product Portfolio (project specific)
- 8.2.9. MOAT Analysis
- 8.2.10. Recent Developments and Future Outlook
- 8.3. Ambition Solution
- 8.4. Aon Plc
- 8.5. Ascent Cloud
- 8.6. Axonify
- 8.7. Badgeville
- 8.8. BI WORLDWIDE
- 8.9. BIZ_Effective
- 8.10. Centrical
- 8.11. Classcraft
- 8.12. Cognizant
- 8.13. FrogAsia
- 8.14. GamEffective
- 8.15. Gametize
- 8.16. G-Cube Webwide Software
- 8.17. Influitive
- 8.18. Kahoot
- 8.19. LevelEleven
- 8.20. Mambo Solutions
- 8.21. Microsoft
- 8.22. MPS
- 8.23. Raydiant
- 8.24. SAP
- 8.25. Verint Systems
9. VALUE CHAIN ANALYSIS
10. SWOT ANALYSIS
11. GLOBAL GAMIFICATION MARKET
- 11.1. Chapter Overview
- 11.2. Key Assumptions and Methodology
- 11.3. Trends Disruption Impacting Market
- 11.4. Global Gamification Market, Historical Trends (Since 2019) and Forecasted Estimates (Till 2035)
- 11.5. Multivariate Scenario Analysis
- 11.5.1. Conservative Scenario
- 11.5.2. Optimistic Scenario
- 11.6. Key Market Segmentations
12. MARKET OPPORTUNITIES BASED ON TYPE OF COMPONENT
- 12.1. Chapter Overview
- 12.2. Key Assumptions and Methodology
- 12.3. Revenue Shift Analysis
- 12.4. Market Movement Analysis
- 12.5. Penetration-Growth (P-G) Matrix
- 12.6. Gamification Market for Software: Historical Trends (Since 2019) and Forecasted Estimates (Till 2035)
- 12.7. Gamification Market for Services: Historical Trends (Since 2019) and Forecasted Estimates (Till 2035)
- 12.8. Data Triangulation and Validation
13. MARKET OPPORTUNITIES BASED ON APPLICATION AREA
- 13.1. Chapter Overview
- 13.2. Key Assumptions and Methodology
- 13.3. Revenue Shift Analysis
- 13.4. Market Movement Analysis
- 13.5. Penetration-Growth (P-G) Matrix
- 13.6. Gamification Market for Customer Engagement: Historical Trends (Since 2019) and Forecasted Estimates (Till 2035)
- 13.7. Gamification Market for Human Resources & Employee Engagement: Historical Trends (Since 2019) and Forecasted Estimates (Till 2035)
- 13.8. Gamification Market for Loyalty Programs: Historical Trends (Since 2019) and Forecasted Estimates (Till 2035)
- 13.9. Gamification Market for Marketing: Historical Trends (Since 2019) and Forecasted Estimates (Till 2035)
- 13.10. Gamification Market for Product Development: Historical Trends (Since 2019) and Forecasted Estimates (Till 2035)
- 13.11. Gamification Market for Sales: Historical Trends (Since 2019) and Forecasted Estimates (Till 2035)
- 13.12. Gamification Market for Training & Education: Historical Trends (Since 2019) and Forecasted Estimates (Till 2035)
- 13.13. Data Triangulation and Validation
14. MARKET OPPORTUNITIES BASED ON DEPLOYMENT MODE
- 14.1. Chapter Overview
- 14.2. Key Assumptions and Methodology
- 14.3. Revenue Shift Analysis
- 14.4. Market Movement Analysis
- 14.5. Penetration-Growth (P-G) Matrix
- 14.6. Gamification Market for Cloud-Based: Historical Trends (Since 2019) and Forecasted Estimates (Till 2035)
- 14.7. Gamification Market for On-Premises: Historical Trends (Since 2019) and Forecasted Estimates (Till 2035)
- 14.8. Data Triangulation and Validation
15. MARKET OPPORTUNITIES BASED ON ORGANIZATION SIZE
- 15.1. Chapter Overview
- 15.2. Key Assumptions and Methodology
- 15.3. Revenue Shift Analysis
- 15.4. Market Movement Analysis
- 15.5. Penetration-Growth (P-G) Matrix
- 15.6. Gamification Market for Large Enterprises: Historical Trends (Since 2019) and Forecasted Estimates (Till 2035)
- 15.7. Gamification Market for Small and Medium Enterprises: Historical Trends (Since 2019) and Forecasted Estimates (Till 2035)
- 15.8. Data Triangulation and Validation
16. MARKET OPPORTUNITIES BASED ON END USE INDUSTRY
- 16.1. Chapter Overview
- 16.2. Key Assumptions and Methodology
- 16.3. Revenue Shift Analysis
- 16.4. Market Movement Analysis
- 16.5. Penetration-Growth (P-G) Matrix
- 16.6. Gamification Market for Construction: Historical Trends (Since 2019) and Forecasted Estimates (Till 2035)
- 16.7. Gamification Market for Energy & Utility: Historical Trends (Since 2019) and Forecasted Estimates (Till 2035)
- 16.8. Gamification Market for Healthcare & Life Science: Historical Trends (Since 2019) and Forecasted Estimates (Till 2035)
- 16.9. Gamification Market for IT & ITeS: Historical Trends (Since 2019) and Forecasted Estimates (Till 2035)
- 16.10. Gamification Market for Manufacturing: Historical Trends (Since 2019) and Forecasted Estimates (Till 2035)
- 16.11. Gamification Market for Oil & Gas: Historical Trends (Since 2019) and Forecasted Estimates (Till 2035)
- 16.12. Gamification Market for Retail: Historical Trends (Since 2019) and Forecasted Estimates (Till 2035)
- 16.13. Gamification Market for Telecommunication: Historical Trends (Since 2019) and Forecasted Estimates (Till 2035)
- 16.14. Gamification Market for Transportation & Logistics: Historical Trends (Since 2019) and Forecasted Estimates (Till 2035)
- 16.15. Gamification Market for Others: Historical Trends (Since 2019) and Forecasted Estimates (Till 2035)
- 16.16. Data Triangulation and Validation
17. MARKET OPPORTUNITIES FOR GAMIFICATION IN NORTH AMERICA
- 17.1. Chapter Overview
- 17.2. Key Assumptions and Methodology
- 17.3. Revenue Shift Analysis
- 17.4. Market Movement Analysis
- 17.5. Penetration-Growth (P-G) Matrix
- 17.6. Gamification Market in North America: Historical Trends (Since 2019) and Forecasted Estimates (Till 2035)
- 17.6.1. Gamification Market in the US: Historical Trends (Since 2019) and Forecasted Estimates (Till 2035)
- 17.6.2. Gamification Market in Canada: Historical Trends (Since 2019) and Forecasted Estimates (Till 2035)
- 17.6.3. Gamification Market in Mexico: Historical Trends (Since 2019) and Forecasted Estimates (Till 2035)
- 17.6.4. Gamification Market in Other North American Countries: Historical Trends (Since 2019) and Forecasted Estimates (Till 2035)
- 17.7. Data Triangulation and Validation
18. MARKET OPPORTUNITIES FOR GAMIFICATION IN EUROPE
- 18.1. Chapter Overview
- 18.2. Key Assumptions and Methodology
- 18.3. Revenue Shift Analysis
- 18.4. Market Movement Analysis
- 18.5. Penetration-Growth (P-G) Matrix
- 18.6. Gamification Market in Europe: Historical Trends (Since 2019) and Forecasted Estimates (Till 2035)
- 18.6.1. Gamification Market in Austria: Historical Trends (Since 2019) and Forecasted Estimates (Till 2035)
- 18.6.2. Gamification Market in Belgium: Historical Trends (Since 2019) and Forecasted Estimates (Till 2035)
- 18.6.3. Gamification Market in Denmark: Historical Trends (Since 2019) and Forecasted Estimates (Till 2035)
- 18.6.4. Gamification Market in France: Historical Trends (Since 2019) and Forecasted Estimates (Till 2035)
- 18.6.5. Gamification Market in Germany: Historical Trends (Since 2019) and Forecasted Estimates (Till 2035)
- 18.6.6. Gamification Market in Ireland: Historical Trends (Since 2019) and Forecasted Estimates (Till 2035)
- 18.6.7. Gamification Market in Italy: Historical Trends (Since 2019) and Forecasted Estimates (Till 2035)
- 18.6.8. Gamification Market in Netherlands: Historical Trends (Since 2019) and Forecasted Estimates (Till 2035)
- 18.6.9. Gamification Market in Norway: Historical Trends (Since 2019) and Forecasted Estimates (Till 2035)
- 18.6.10. Gamification Market in Russia: Historical Trends (Since 2019) and Forecasted Estimates (Till 2035)
- 18.6.11. Gamification Market in Spain: Historical Trends (Since 2019) and Forecasted Estimates (Till 2035)
- 18.6.12. Gamification Market in Sweden: Historical Trends (Since 2019) and Forecasted Estimates (Till 2035)
- 18.6.13. Gamification Market in Switzerland: Historical Trends (Since 2019) and Forecasted Estimates (Till 2035)
- 18.6.14. Gamification Market in the UK: Historical Trends (Since 2019) and Forecasted Estimates (Till 2035)
- 18.6.15. Gamification Marketing Other European Countries: Historical Trends (Since 2019) and Forecasted Estimates (Till 2035)
- 18.7. Data Triangulation and Validation
19. MARKET OPPORTUNITIES FOR GAMIFICATION IN ASIA
- 19.1. Chapter Overview
- 19.2. Key Assumptions and Methodology
- 19.3. Revenue Shift Analysis
- 19.4. Market Movement Analysis
- 19.5. Penetration-Growth (P-G) Matrix
- 19.6. Gamification Market in Asia: Historical Trends (Since 2019) and Forecasted Estimates (Till 2035)
- 19.6.1. Gamification Market in China: Historical Trends (Since 2019) and Forecasted Estimates (Till 2035)
- 19.6.2. Gamification Market in India: Historical Trends (Since 2019) and Forecasted Estimates (Till 2035)
- 19.6.3. Gamification Market in Japan: Historical Trends (Since 2019) and Forecasted Estimates (Till 2035)
- 19.6.4. Gamification Market in Singapore: Historical Trends (Since 2019) and Forecasted Estimates (Till 2035)
- 19.6.5. Gamification Market in South Korea: Historical Trends (Since 2019) and Forecasted Estimates (Till 2035)
- 19.6.6. Gamification Market in Other Asian Countries: Historical Trends (Since 2019) and Forecasted Estimates (Till 2035)
- 19.7. Data Triangulation and Validation
20. MARKET OPPORTUNITIES FOR GAMIFICATION IN MIDDLE EAST AND NORTH AFRICA (MENA)
- 20.1. Chapter Overview
- 20.2. Key Assumptions and Methodology
- 20.3. Revenue Shift Analysis
- 20.4. Market Movement Analysis
- 20.5. Penetration-Growth (P-G) Matrix
- 20.6. Gamification Market in Middle East and North Africa (MENA): Historical Trends (Since 2019) and Forecasted Estimates (Till 2035)
- 20.6.1. Gamification Market in Egypt: Historical Trends (Since 2019) and Forecasted Estimates (Till 205)
- 20.6.2. Gamification Market in Iran: Historical Trends (Since 2019) and Forecasted Estimates (Till 2035)
- 20.6.3. Gamification Market in Iraq: Historical Trends (Since 2019) and Forecasted Estimates (Till 2035)
- 20.6.4. Gamification Market in Israel: Historical Trends (Since 2019) and Forecasted Estimates (Till 2035)
- 20.6.5. Gamification Market in Kuwait: Historical Trends (Since 2019) and Forecasted Estimates (Till 2035)
- 20.6.6. Gamification Market in Saudi Arabia: Historical Trends (Since 2019) and Forecasted Estimates (Till 2035)
- 20.6.7. Gamification Market in United Arab Emirates (UAE): Historical Trends (Since 2019) and Forecasted Estimates (Till 2035)
- 20.6.8. Gamification Market in Other MENA Countries: Historical Trends (Since 2019) and Forecasted Estimates (Till 2035)
- 20.7. Data Triangulation and Validation
21. MARKET OPPORTUNITIES FOR GAMIFICATION IN LATIN AMERICA
- 21.1. Chapter Overview
- 21.2. Key Assumptions and Methodology
- 21.3. Revenue Shift Analysis
- 21.4. Market Movement Analysis
- 21.5. Penetration-Growth (P-G) Matrix
- 21.6. Gamification Market in Latin America: Historical Trends (Since 2019) and Forecasted Estimates (Till 2035)
- 21.6.1. Gamification Market in Argentina: Historical Trends (Since 2019) and Forecasted Estimates (Till 2035)
- 21.6.2. Gamification Market in Brazil: Historical Trends (Since 2019) and Forecasted Estimates (Till 2035)
- 21.6.3. Gamification Market in Chile: Historical Trends (Since 2019) and Forecasted Estimates (Till 2035)
- 21.6.4. Gamification Market in Colombia Historical Trends (Since 2019) and Forecasted Estimates (Till 2035)
- 21.6.5. Gamification Market in Venezuela: Historical Trends (Since 2019) and Forecasted Estimates (Till 2035)
- 21.6.6. Gamification Market in Other Latin American Countries: Historical Trends (Since 2019) and Forecasted Estimates (Till 2035)
- 21.7. Data Triangulation and Validation
22. MARKET OPPORTUNITIES FOR GAMIFICATION IN REST OF THE WORLD
- 22.1. Chapter Overview
- 22.2. Key Assumptions and Methodology
- 22.3. Revenue Shift Analysis
- 22.4. Market Movement Analysis
- 22.5. Penetration-Growth (P-G) Matrix
- 22.6. Gamification Market in Rest of the World: Historical Trends (Since 2019) and Forecasted Estimates (Till 2035)
- 22.6.1. Gamification Market in Australia: Historical Trends (Since 2019) and Forecasted Estimates (Till 2035)
- 22.6.2. Gamification Market in New Zealand: Historical Trends (Since 2019) and Forecasted Estimates (Till 2035)
- 22.6.3. Gamification Market in Other Countries
- 22.7. Data Triangulation and Validation
23. TABULATED DATA
24. LIST OF COMPANIES AND ORGANIZATIONS
25. CUSTOMIZATION OPPORTUNITIES
26. ROOTS SUBSCRIPTION SERVICES
26. AUTHOR DETAIL
 遊戲化市場-全球產業規模、佔有率、趨勢、機會與預測:按解決方案、部署類型、組織規模、最終用戶產業、地區和競爭對手分類,2021-2031年
 銷售遊戲化軟體市場:按組件、部署類型、組織規模、應用和產業分類-2026-2032年全球市場預測
 遊戲化市場規模、佔有率、趨勢和預測:按組件、部署模式、企業規模、行業和地區分類,2026-2034 年遊戲化市場:全球市場按類型、平台、應用、最終用戶和部署方式分類的預測——2026-2032年
 2026年全球學習遊戲化市場報告2026年全球教育遊戲化市場報告
 遊戲化市場:按組件、部署方式、最終用戶產業和地區分類2026年全球遊戲化市場報告
 遊戲化市場分析及預測(至2035年):依類型、產品、服務、技術、組件、應用、設備、部署模式及最終用戶分類
 全球遊戲化市場規模、佔有率、趨勢和成長分析報告(2026-2034)