


 |
市場調查報告書
商品編碼
2037812
mRNA疫苗和治療市場(第四版):按應用、目標疾病和地區分類-趨勢和預測(至2035年)mRNA Vaccine and Therapeutics Market (4th Edition) by Application Area, Target Disease Indication and Geographical Regions - Trends and Forecast, Till 2035 |
||||||
mRNA疫苗和治療市場概覽
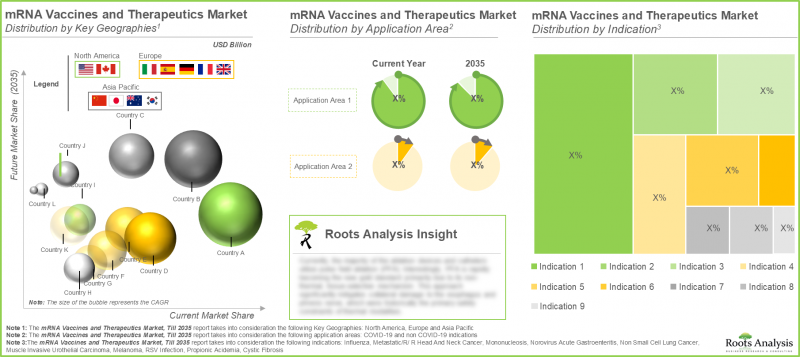
預計到 2035 年,mRNA 疫苗和治療市場將以較高的年複合成長率成長,從今年的 900 萬美元成長到 2035 年的 170.36 億美元。
mRNA疫苗與治療市場-成長與趨勢
信使核糖核酸(mRNA)技術徹底革新了蛋白質合成,它能夠以單鏈RNA的形式將遺傳訊息從DNA傳遞到核醣體。基於mRNA平台的應用大大改變了全球生物醫學領域的格局,為以往難以治療的疾病開闢了新的治療途徑。因此,基於mRNA的療法和疫苗已成為傳統治療方法的強大替代方案。
新冠疫情爆發後,全球mRNA疫苗和療法市場經歷了顯著成長,這主要得益於mRNA疫苗的快速研發和成功應用。這一突破性事件展現了mRNA技術的擴充性和適應性,加速了多個治療領域的研究活動和投資。儘管受新冠疫情相關需求下降的影響,市場一度出現短暫放緩,但預計從2029年起將強勁復甦,這主要得益於mRNA技術在腫瘤學、罕見病和其他感染疾病領域的應用不斷拓展。
在當前情況下,mRNA癌症疫苗和治療領域取得了顯著進展,越來越多的癌症患者接受了基於mRNA平台的標靶免疫療法。目前,mRNA在癌症治療領域的應用約佔整個市場的25%,這反映出整個產業正朝著精準醫療主導、以免疫為中心的癌症治療方向轉變。
目前,已有五家mRNA疫苗研發公司的產品獲得監管部門核准,這標誌著基於mRNA的多種疾病治療方案商業化過程中的一個重要里程碑。強大的臨床研發管線進一步推動了這項進展,多個mRNA疫苗和治療候選藥物正在積極招募患者並進行全面的臨床評估,目前已進入III期臨床試驗階段。
此外,mRNA研發公司不斷擴充的產品線正在推動mRNA合成和生產市場的成長。這是因為企業越來越傾向於尋求合約研發生產(CDMO)服務,以支持基於mRNA的疫苗和療法的規模化生產和商業化。
成長促進因素-市場擴張的策略推動者
受輝瑞、BioNTech 和 Moderna 等先驅企業研發的新冠疫苗取得突破性成功所推動,mRNA 疫苗和療法市場正經歷著蓬勃發展。這項成功凸顯了該平台無與倫比的優勢,包括以周而非年為單位的快速設計和生產週期、極高的療效和極小的副作用,以及對不斷演變的病原體和患者特定需求的卓越適應性。
這項概念驗證(PoC)促進了大量的研發投資和策略夥伴關係,包括政府主導的舉措、創業投資的增加以及合作範圍的擴大。這些進展正在推動一個強大的研發管線的形成,其應用範圍已從感染疾病擴展到個人化癌症療法、囊腫纖維化等罕見遺傳疾病、自體免疫疾病,甚至包括針對流感、呼吸道合胞病毒(RSV)、結核病和類痘病毒(MPOX)等威脅的預防性流行病應對措施。此外,脂質體奈米顆粒(LNP)等遞送技術的進步以及加速監管核准等支援措施,正在推動精準醫療領域可擴展、靈活的生產和應用,從而進一步加速成長。
市場挑戰-阻礙進展的主要障礙
儘管mRNA疫苗和療法市場具有強勁的成長潛力,但仍有許多重大挑戰限制其廣泛應用和規模化推廣。由於生產流程複雜、需要特殊原料以及複雜的純化過程(需要先進的設備和熟練的人員),高昂的生產成本仍然是一大障礙。此外,mRNA分子固有的不穩定性要求嚴格的低溫運輸物流,通常需要超低溫儲存和運輸。這增加了成本,並使分銷更加複雜,尤其是在基礎設施薄弱的中低收入國家。監管障礙進一步阻礙了發展。隨著指南的不斷完善,需要進行嚴格的品管、長期的臨床試驗以及對潛在安全問題(包括免疫抗原性和長期影響)的仔細評估。公眾對疫苗的懷疑和猶豫,以及關於安全性和脂質奈米顆粒成分的錯誤訊息,可能會降低疫苗接種率並減緩市場滲透。這些因素,加上偶爾出現的供應鏈脆弱性和智慧財產權問題,都要求在降低成本、提高製劑穩定性以及相關人員合作方面不斷創新,才能充分發揮該平台的治療潛力。
mRNA疫苗和治療市場—關鍵洞察
本報告對mRNA疫苗和療法市場的現狀進行了詳細分析,並指出了該行業潛在的成長機會。報告的主要發現包括:
- 當前市場格局較為分散,既有老牌企業,也有新參與企業。其中,約40%的mRNA疫苗和療法是由中小企業研發的。
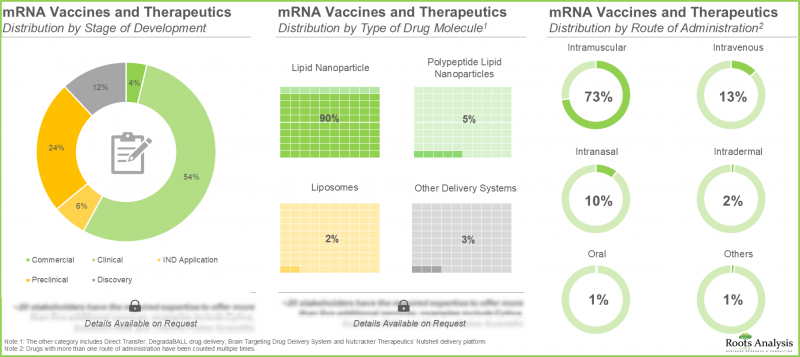
- 目前,大多數mRNA疫苗和療法正處於不同的研發階段。其中,約55%的疫苗處於臨床階段,其次是臨床前階段(24%)。
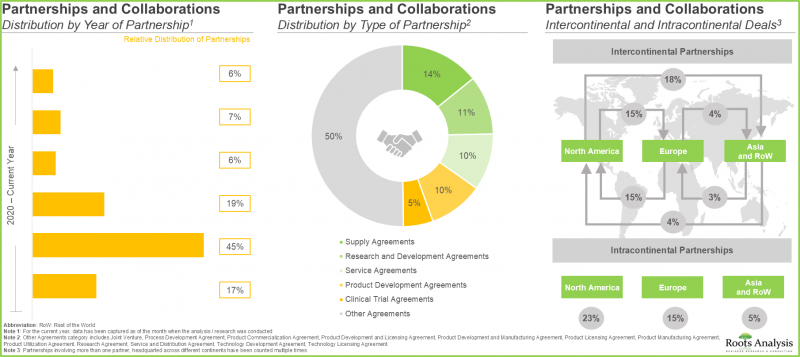
- 相關人員對該領域的持續關注從他們的合作活動中可見一斑。所有合作項目中,50%為供應合約。
- 近年來,註冊臨床試驗的數量顯著增加。在評估mRNA疫苗和療法的試驗中,大多數(72%)得到了行業相關人員的支持。
- 近年來,資金籌措和投資大幅增加,其中 65% 的 mRNA 疫苗和療法投資集中在北美。
- 近年來,知識產權資本穩步成長。絕大多數專利(92%)仍處於申請階段,預計在未來幾年內獲得核准。
- 隨著時間的推移,許多新創公司已在該領域開展了各種研發活動。我們獨有的新創企業健康指數分析揭示了業界最具發展潛力的相關人員。
- 大型製藥企業正採取多項舉措,從自主研發產品到進行策略性投資,以抓住這個快速成長的市場中盈利機會。
- 北美 mRNA 疫苗和療法市場目前佔據了大部分市場佔有率(75%),這得益於先進的醫療保健基礎設施、活性化的研究活動以及有利的監管指導方針。
mRNA疫苗和治療藥物市場
市場規模和機會分析是根據以下參數進行細分的:
- 透過使用
- COVID-19
- 除了新冠肺炎之外
- 按目標疾病
- 呼吸道合胞感染疾病
- 復發/轉移性頭頸癌
- 流感
- 非小細胞肺癌
- 惡性黑色素瘤
- 肌層浸潤性尿路上皮癌
- 諾羅病毒相關急性腸胃炎
- 丙酸血症
- 傳染性單核球增多症
- 囊腫纖維化
- 按地區
- 北美洲
- 美國
- 加拿大
- 歐洲
- 英國
- 德國
- 西班牙
- 義大利
- 法國
- 其他歐洲國家
- 亞太地區
- 中國
- 澳洲
- 韓國
- 日本
mRNA疫苗和治療市場-主要細分市場
預計未來mRNA疫苗和療法市場除新冠肺炎以外的其他應用領域將佔據主導地位。
全球市場依應用領域分為新冠肺炎(COVID-19)及非新冠肺炎(非COVID-19)兩大板塊。根據mRNA疫苗和療法的研究,新冠肺炎領域今年佔據最大的市場佔有率。全球龐大的需求、不斷增加的核准、日益嚴格的監管合規要求以及mRNA新冠疫苗的廣泛應用是推動市場擴張的主要因素。隨著研發投入的增加、臨床開發的進展以及在癌症免疫療法、罕見疾病、流感、呼吸道合胞病毒(RSV)和遺傳性疾病等多種應用領域獲得監管部門的核准,預計未來幾年非新冠肺炎mRNA領域將成為市場成長的主要驅動力。
北美市場主導。
北美地區佔全球75%的市場佔有率,引領mRNA疫苗和療法產業。這得歸功於強力的政府資助、有利的監管核准、大型生物技術公司大量的研發投入以及先進的醫療基礎設施。
美國mRNA癌症疫苗和療法的市場趨勢
美國憑藉其先進的醫療基礎設施、主要生物技術公司的大量研發投資、美國國立衛生研究院 (NIH) 的大力政府支持、美國食品藥品監督核准津貼已建立的生物製造能力,在該行業中處於領先地位。
第一次調查總結
本研究的觀點和見解受到了該領域多位相關人員的討論的影響。本市場報告包含與以下相關人員的詳細訪談記錄:
- 澳洲一家中型公司的業務拓展經理
- 比利時一家大型公司業務發展資深總監
- 韓國大型組織團隊負責人
此外,本市場報告還包含與以下第三方進行的討論記錄:
- 美國,大型企業,執行長
- 瑞士某中型企業執行長
- 德國醫療專業人員、大型組織
- 義大利大型組織執行長
- 英國中型組織資深藥物傳遞技術總監
- 德國某大型機構共同創辦人
- 美國某中型企業執行長
- 美國大型企業執行長
- 美國,中型企業,副經理
- 德國某中型企業的共同創辦人兼執行長
mRNA疫苗和療法市場主要參與者範例
- Moderna
- BioNTech
- Providence Therapeutics
- Suzhou Abogen Biosciences
- CureVac
- RNAimmune(Subsidiary of Sirnaomics)
- Turn Biotechnologies
- Arcturus Therapeutics
- Walvax
mRNA疫苗和治療市場—研究範圍
- 市場規模和機會分析:本報告對 mRNA 疫苗和治療藥物市場進行了詳細分析,重點關注關鍵市場細分,例如 [A] 應用領域、[B] 目標疾病和 [C] 地區。
- mRNA疫苗和治療市場概覽:除了對mRNA疫苗和治療市場的整體概覽進行詳細評估外,本報告還包括有關幾個相關參數的信息,例如[A] 開發狀態,[B] 候選藥物類型,[C] 項目類型,[D] 遞送系統類型,[E] 編碼分子類型,[F] 給藥途徑,[G] 治療領域,[I]] 公司規模,[H] 給藥途徑,[G] 治療領域,[I] 公司規模。
- 公司簡介:我們根據多個參數(如[A]成立年份、[B]總部所在地、[C]藥物組合、[D]近期發展、[E]未來展望)提供參與mRNA疫苗和治療市場的關鍵公司的詳細簡介。
- 競爭分析:我們對 mRNA 開發公司提供的疫苗和療法進行詳細的競爭分析,分析依據是 [A] 開發公司的優勢,[B] 產品的競爭力,以及 [C] 開發階段。
- 大型製藥企業舉措:對大型製藥企業所進行的各項以mRNA為重點的措施進行全面回顧。除了重點介紹正在研發的mRNA疫苗和療法外,還包括有關[A]籌集資金、[B]合作活動和[C]產品系列多樣性的資訊。
- 創業健康指數是對該產業新創公司進行詳細分析的依據,基於幾個相關參數,包括 [A] 公司實力、[B] 專案成熟度、[C] 專案實力、[D]資金籌措狀況、[E] 投資者實力和 [F] 合作活動。
- 臨床試驗分析:我們基於各種相關參數,對已完成和正在進行的與 mRNA 疫苗和療法相關的臨床試驗進行深入分析,例如 [A] 試驗註冊年份,[B]實驗狀況,[C] 入組患者的性別,[D] 目標患者人群,[E] 試驗設計,[F] 申辦方類型,[G] 最合作的地區,申辦方/地區。
- 合作與合作研究:我們將基於幾個相關參數,對 mRNA 疫苗和治療行業近期的合作與合作研究進行詳細分析,包括 [A] 合作年份,[B] 合作類型,[C] 治療領域,[D] 最活躍的參與企業(基於簽訂的合約數量),以及 [E] 該領域合作活動的區域分佈。
- 資金籌措和投資分析:本分析基於幾個相關參數,詳細考察了參與企業的資金籌措,包括[A]資金籌措年份,[B]資金籌措形式,[C]投資金額,[D]治療領域,[E]最活躍的參與企業(基於資金籌措數量和投資金額),以及[F]主要投資者(基於融資交易數量)。
- 專利分析:我們基於相關參數,對mRNA疫苗和治療藥物領域提交和註冊的各種專利進行詳細分析,例如[A]專利類型(已註冊專利、專利申請、其他)、[B]公開年份、[C]地區、[D]CPC代碼、[E]主要公司(基於申請和註冊數量)和[F]專利價值。
- 案例研究1—FDA核准策略:本部分對mRNA疫苗和療法市場中疫苗研發公司可實施的各種競爭策略進行了獨特的分析,旨在加速其疫苗獲得FDA核准的進程。本部分還包含有關臨床證據、津貼和津貼、合作關係以及知識產權等多個相關參數的資訊。
- 案例研究2-外包:決策架構:這份深入分析外包架構的報告重點在於mRNA疫苗和治療公司在決定是自行生產產品還是利用契約製造組織(CMO)的服務時應考慮的各種因素。此外,該分析還根據公司規模,揭示了每家參與企業在做出上述決策時應考慮的所有關鍵參數。
- 市場影響分析:本部分詳細分析可能影響市場成長的因素,包括關鍵市場促進因素、潛在限制因素、新興機會以及該行業現有挑戰的識別和分析。
目錄
第1章:序言
第2章:調查方法
第3章 市場動態
第4章 宏觀經濟指標
第5章執行摘要
第6章:引言
- 章節概要
- mRNA治療藥物
- 藥效疫苗
- mRNA遞送途徑
- mRNA遞送策略
- mRNA疫苗和療法面臨的主要挑戰
- 前景
第7章 市場狀況
- 章節概要
- mRNA疫苗與療法:市場現狀
- mRNA疫苗與療法:研發公司的現狀
第8章:產品競爭力分析
- 章節概要
- 前提條件和關鍵參數
- 調查方法
- mRNA疫苗與療法:產品競爭力分析
第9章:小分子無菌灌裝和包裝服務供應商概況
第9章 公司簡介:總部位於北美的mRNA疫苗和治療藥物研發公司
- 章節概要
- 一家總部位於北美的mRNA疫苗和治療藥物研發公司。
- Arcturus Therapeutics
- Immorna
- Moderna
- Providence Therapeutics
- Innovac Therapeutics
- Kernal Biologics
- Recode Therapeutics
- Rejuvenation Technologies
- RNAimmune
- Turn Biotechnologies
- Strand Therapeutics
第10章 公司簡介:總部位於歐洲的mRNA疫苗和治療藥物研發公司
- 章節概要
- 總部位於歐洲、致力於開發mRNA疫苗和療法的公司。
- BioNTech
- CureVac
- Ethris
第11章 公司簡介:亞太地區mRNA疫苗和治療藥物研發公司
- 章節概要
- 總部位於亞太地區的mRNA疫苗和療法研發公司。
- Suzhou Abogen Biosciences
- Gennova Biopharmaceuticals
- RNACure
- Walvax
第12章:主要製藥公司的舉措
- 章節概要
- 研究範圍和調查方法
- mRNA疫苗和療法市場-領導企業的努力
- 基準分析:大型製藥企業
- 結論
第13章:新創企業健康指標
- 章節概要
- 專注於mRNA疫苗和療法的新創公司。
- 新創公司基準分析
- 新創公司健康指數
第14章 臨床試驗分析
- 章節概要
- 研究範圍和調查方法
- mRNA疫苗與治療藥物:臨床試驗分析
第15章夥伴關係與合作
第16章資金籌措與投資
第17章 專利分析
第18章:FDA核准策略
- 章節概要
- 調查方法
- 關鍵參數
- mRNA疫苗和療法臨床試驗失敗的常見原因
- 基準分析:mRNA疫苗和治療藥物的主要策略分佈
第19章 外包:可行/不可行框架
- 章節概要
- 外包:Go/NoGo 框架
- mRNA疫苗與治療藥物外包:可行/不可行框架
第20章 市場影響分析
- 章節概要
- 市場促進因素
- 市場限制
- 市場機遇
- 市場挑戰
- 結論
第21章 全球mRNA疫苗與治療市場
第22章:mRNA疫苗和治療市場(按應用領域分類)
第23章:mRNA疫苗與治療市場(依目標疾病分類)
第24章:mRNA疫苗和治療市場(按地區分類)
第25章 市場機會分析:北美
第26章 市場機會分析:歐洲
第27章 市場機會分析:亞太地區
第28章結論
第29章:高階主管洞察
第30章 附錄1:表格形式數據
第31章 附錄2:公司與組織列表
mRNA Vaccines and Therapeutics Market: Overview
As per Roots Analysis, the mRNA vaccines and therapeutics market is estimated to grow from USD 9 million in the current year to USD 17,036 million by 2035, at a high CAGR during the forecast period, till 2035.
mRNA Vaccines and Therapeutics Market: Growth and Trends
Messenger ribonucleic acid (mRNA) technology has transformed protein synthesis by enabling the delivery of genetic instructions from DNA to ribosomes in the form of single-stranded RNA. The adoption of mRNA-based platforms has significantly reshaped the global biomedical landscape, unlocking new therapeutic possibilities for previously untreatable conditions. Consequently, mRNA therapeutics and vaccines have emerged as a compelling alternative to traditional treatment modalities.
Following the COVID-19 pandemic, the global mRNA vaccines and therapeutics market experienced substantial growth, driven by the rapid development and successful deployment of mRNA-based vaccines. This milestone demonstrated the scalability and adaptability of mRNA technology, accelerating research activities and investment across multiple therapeutic areas. Although the market has experienced a temporary slowdown with the decline of COVID-19-related demand, it is projected to witness strong recovery post-2029, supported by expanding applications in oncology, rare diseases, and other infectious diseases.
Within this evolving landscape, the mRNA cancer vaccines and therapeutics segment has demonstrated significant progress, with an increasing number of oncology patients receiving targeted, immune-based therapies enabled by mRNA platforms. Currently, oncological applications account for approximately 25% of the overall market share, reflecting a broader industry shift toward precision-driven, immune-centric cancer treatments.
At present, five mRNA vaccine developers have achieved regulatory approval for their products, representing a key milestone in the commercialization of mRNA-based solutions across multiple disease indications. This progress is further reinforced by a robust clinical pipeline, with several mRNA vaccine and therapeutic candidates advancing into Phase III trials, supported by strong patient enrollment and comprehensive clinical evaluation.
Additionally, the expanding pipeline of mRNA developers is driving growth in the mRNA synthesis and manufacturing market, as companies increasingly seek contract development and manufacturing services to scale up production and support the commercialization of mRNA-based vaccines and therapeutics.
Growth Drivers: Strategic Enablers of Market Expansion
The mRNA vaccines and therapeutics market is undergoing dynamic expansion, propelled by the transformative success of COVID-19 vaccines developed by pioneers such as Pfizer-BioNTech and Moderna. This success highlights the platform's unparalleled advantages, including rapid design and production timelines measured in weeks rather than years, exceptional potency with fewer side effects, and remarkable adaptability to evolving pathogens or patient-specific needs.
This proof-of-concept has sparked substantial R&D investments and strategic partnerships, including government-backed initiatives, increased venture capital funding, and expanded collaborations. These developments are fueling a robust pipeline that extends beyond infectious diseases into personalized oncology, rare genetic disorders such as cystic fibrosis, autoimmune conditions, and proactive pandemic preparedness for threats like influenza, RSV, tuberculosis, and mpox. Further, advancements in delivery technologies like lipid nanoparticles (LNPs) and supportive regulatory fast-tracks further amplify growth by enabling scalable, flexible production and precision medicine applications.
Market Challenges: Critical Barriers Impeding Progress
Despite the strong growth potential in the mRNA vaccines and therapeutics market, several significant challenges continue to limit broader adoption and scalability. High manufacturing costs remain a primary barrier, driven by the complexity of production processes, the need for specialized raw materials, and intricate purification steps that require advanced facilities and skilled personnel. Additionally, the inherent instability of mRNA molecules necessitates stringent cold-chain logistics, often involving ultra-low temperature storage and transportation, which increases expenses and complicates distribution particularly in low and middle-income countries with limited infrastructure. Further, regulatory hurdles further impede progress, as evolving guidelines demand rigorous quality control, extended clinical trials, and careful evaluation of potential safety concerns, including immunogenicity and long-term effects. Public skepticism and vaccine hesitancy, fueled by misinformation regarding safety profiles and lipid nanoparticle components, can reduce uptake and slow market penetration. Together, these factors combined with occasional supply chain vulnerabilities and intellectual property issues require sustained innovation in cost reduction, formulation stability, and stakeholder engagement to fully realize the platform's therapeutic promise.
mRNA Vaccines and Therapeutics Market: Key Insights
The report delves into the current state of the mRNA vaccines and therapeutics market and identifies potential growth opportunities within industry. Some key findings from the report include:
- The current market landscape is fragmented, featuring the presence of both established players and new entrants; of these, around 40% of mRNA vaccines and therapeutics are being developed by small companies.
- Majority of the mRNA vaccines and therapeutics are currently evaluated under different stages of development; of these, around 55% of vaccines are in clinical phase, followed by preclinical phase (24%)
- The continuous interest of stakeholders in this domain is evident from the partnership activity; 50% of the total number of partnerships were supply agreements.
- A decent increase in the number of registered clinical trials has been observed in the recent years; majority (72%) of the trials evaluating mRNA vaccines and therapeutics have been sponsored by industry players.
- There has been a notable rise in funding and investments over the past few years; 65% of the investments assessing mRNA vaccines and therapeutics have been concentrated in North America.
- The intellectual capital is growing at a steady pace in the past few years; majority (92%) of the patents are applications, which are likely to get approval in the coming years.
- Over time, several start-ups have initiated various R&D initiatives in this domain; our proprietary start-up health indexing analysis reveals the most promising stakeholders in the industry.
- Big pharma players have undertaken several initiatives, ranging from proprietary product development to strategic investments, to tap the lucrative opportunity in this rapidly growing market.
- The mRNA vaccines and therapeutics market in North America currently captures the majority (75%) of the market owing to advanced healthcare infrastructure, rise in research activities and favorable regulatory guidelines.
mRNA Vaccines and Therapeutics Market
The market sizing and opportunity analysis has been segmented across the following parameters:
- By Application Area
- COVID-19
- Non-COVID
- By Type of Disease Indication
- RSV Infection
- Recurrent / Metastatic Head and Neck Cancer
- Influenza
- Non-Small Cell Lung Cancer
- Melanoma
- Muscle-Invasive Urothelial Carcinoma
- Norovirus Acute Gastroenteritis
- Propionic Acidemia
- Mononucleosis
- Cystic Fibrosis
- By Geographical Regions
- North America
- US
- Canada
- Europe
- UK
- Germany
- Spain
- Italy
- France
- Rest of Europe
- Asia-Pacific
- China
- Australia
- South Korea
- Japan
mRNA Vaccines and Therapeutics Market: Key Segments
The future of the mRNA vaccine and therapeutics market is expected to be dominated by non-COVID applications
The global market is segmented into COVID-19 and non-COVID based on the application area. The COVID-19 sector holds the largest market share for the current year, according to the mRNA vaccine and therapeutics research. The enormous worldwide demand, growing approvals, growing regulatory compliance requirements, and extensive use of mRNA-based COVID-19 vaccines are the primary reasons for the market expansion. Due to increased R&D expenditures, clinical developments, and regulatory approvals for a variety of applications, including cancer immunotherapies, rare diseases, influenza, RSV, and genetic disorders, the non-COVID mRNA segment is anticipated to dominate the market in the upcoming years.
The Market Is Dominated by North America
With 75% of the total market value, North America leads the mRNA vaccines and therapies industry. This is due to strong government funding, favorable regulatory approvals, significant R&D investments by top biotech companies, and sophisticated healthcare infrastructure.
Market Trends in US for mRNA Cancer Vaccines and Therapies
Due to its advanced healthcare infrastructure, significant R&D investments by top biotech companies, strong government support from NIH grants, favorable FDA regulatory approvals, and well-established bio-manufacturing capabilities, the US leads the industry.
Primary Research Overview
Discussions with multiple stakeholders in this domain influenced the opinions and insights presented in this study. The market report includes detailed transcripts of interviews conducted with the following individuals:
- Business Development Manager, Mid-sized Organization, Australia
- Senior Director Business Development, Large Organization, Belgium
- Team Leader, Large Organization, South Korea
In addition, the market report includes transcripts of the following other third-party discussions:
- Chief Executive Officer, Large Organization, US
- President, Mid-sized Organization, Switzerland
- Medical Professional, Large-sized Organization, Germany
- Chief Executive Officer, Large-sized Organization, Italy
- Director of Advanced Drug Delivery, Mid-sized Organization, UK
- Co-founder, Large-sized Organization, Germany
- Chief Executive Officer, Mid-sized Organization, US
- Chief Executive Officer, Large Organization, US
- Deputy Director, Mid-sized Organization, US
- Co-founder and Chief Executive Officer, Mid-sized Organization, Germany
Example Players in mRNA Vaccines and Therapeutics Market
- Moderna
- BioNTech
- Providence Therapeutics
- Suzhou Abogen Biosciences
- CureVac
- RNAimmune (Subsidiary of Sirnaomics)
- Turn Biotechnologies
- Arcturus Therapeutics
- Walvax
mRNA Vaccines and Therapeutics Market: Research Coverage
- Market Sizing and Opportunity Analysis: The report features an in-depth analysis of the mRNA vaccines and therapeutics market, focusing on key market segments, including [A] application area [B] target disease indication, and [C] geographical regions.
- mRNA Vaccines and Therapeutics Market Landscape: A detailed assessment of the overall mRNA vaccine and therapeutics market landscape, along with information on several relevant parameters, such as [A] as status of development, [B] type of drug candidate, [C] type of program, [D] type of delivery system, [E] type of molecule encoded, [F] route of administration, [G] therapeutic area, [H] year of establishment, [I] company size and [J] location of headquarters.
- Company Profiles: In-depth profiles of leading players engaged in mRNA vaccine and therapeutics market based on several parameters such as [A] year of establishment, [B] location of headquarters, [C] drug portfolio, [D] recent developments and [E] an informed future outlook.
- Competitiveness Analysis: An in-depth competitiveness analysis of vaccines and therapeutics offered by mRNA developers based on their [A] developer strength, [B] product competitiveness and [C] phase of development.
- Big Pharma Initiatives: A comprehensive review of the various mRNA-focused initiatives undertaken by big pharma players, highlights mRNA vaccine and therapeutics under development along with information on [A] funding amount raised, [B] partnership activity, and [C] diversity of product portfolio.
- Start-up Health Indexing: A detailed analysis of start-ups in this domain, based on several relevant parameters, such as [A] company strength, [B] pipeline maturity, [C] pipeline strength, [D] financial support, [E] investor strength and [F] partnership activity.
- Clinical Trial Analysis: An insightful clinical trial analysis of completed / ongoing clinical trials related to mRNA vaccines and therapeutics, based on various relevant parameters, such as [A] trial registration year, [B] trial status, [C] patient gender recruited, [D] target patient population, [E] study design, [F] type of sponsor, [G] most active sponsor / collaborator and [H] geography.
- Partnerships and Collaborations: A detailed analysis of recent collaborations and partnerships within the mRNA vaccine and therapeutics industry, based on several relevant parameters, such as [A] year of partnership, [B] type of partnership, [C] therapeutic area, [D] most active players (in terms of number of deals inked) and [E] regional distribution of partnership activity that have been undertaken in this domain.
- Funding and Investment Analysis: A detailed analysis of various investments made by players in this domain based on several relevant parameters, such as [A] year of funding, [B] type of funding, [C] amount invested, [D] therapeutic area, [E] most active players (in terms of number of funding instances and amount invested) and [F] key investors (in terms of number of funding instances).
- Patent Analysis: An in-depth analysis of the various patents that have been filed / granted related to mRNA vaccine and therapeutics domain, based on several relevant parameters, such as [A] type of patent (granted patents, patent applications and others), [B] publication year, [C] geographical region, [D] CPC symbols, [E] leading industry players (in terms of the number of patents filed / granted) and [F] patent valuation.
- Case Study 1 - FDA Approval Strategies: A proprietary analysis on various competitive strategies that can be implemented by vaccine developers engaged in mRNA vaccines and therapeutics market, to expedite the FDA approval process for their proprietary vaccines. The section also includes information on several relevant parameters, such as clinical evidence, awards / grants, partnerships, intellectual properties and others.
- Case Study 2 - Outsourcing: Go / No-Go Framework: An insightful go / no-go framework analysis, highlighting various factors that needs to be considered by mRNA vaccine and therapeutics while deciding whether to manufacture their respective products in-house or engage the services of a CMO. Further, the analysis highlights all the key parameters that must be considered by players based on company size, while taking the aforementioned decision
- Market Impact Analysis: An in-depth analysis of the factors that can impact the growth of the market. It also features identification and analysis of key drivers, potential restraints, emerging opportunities, and existing challenges in this domain.
Key Questions Answered in this Report
- Which are the leading companies in the mRNA vaccines and therapeutics market?
- Which region dominates the mRNA vaccines and therapeutics market?
- What are the key trends observed in the mRNA vaccines and therapeutics market?
- What factors are likely to influence the evolution of this market?
- What are the primary challenges faced by mRNA vaccines and therapeutics developers?
- What is the current and future market size?
- What is the CAGR of this market?
- How is the current and future market opportunity likely to be distributed across key market segments?
Reasons to Buy this Report
- The report provides a comprehensive market analysis, offering detailed revenue projections of the overall market and its specific sub-segments. This information is valuable to both established market leaders and emerging entrants.
- The report offers stakeholders a comprehensive overview of the market, including key drivers, barriers, opportunities, and challenges. This information empowers stakeholders to stay abreast of market trends and make data-driven decisions to capitalize on growth prospects.
- The report can aid businesses in identifying future opportunities in any sector. It also helps in understanding if those opportunities are worth pursuing.
- The report helps in identifying customer demand by understanding the needs, preferences, and behavior of the target audience in order to tailor products or services effectively.
- The report equips new entrants with requisite information regarding a particular market to help them build successful business strategies.
- The report allows for more effective communication with the audience and in building strong business relations.
Additional Benefits
- Complimentary Excel Data Packs for all Analytical Modules in the Report
- 15% Free Content Customization
- Detailed Report Walkthrough Session with Research Team
- Free Updated report if the report is 6-12 months old or older
TABLE OF CONTENTS
1. PREFACE
- 1.1. Introduction
- 1.2. Market Share Insights
- 1.3. Key Market Insights
- 1.4. Report Coverage
- 1.5. Key Questions Answered
- 1.6. Chapter Outlines
2. RESEARCH METHODOLOGY
- 2.1. Chapter Overview
- 2.2. Research Assumptions
- 2.2.1. Market Landscape and Market Trends
- 2.2.2. Market Forecast and Opportunity Analysis
- 2.2.3. Comparative Analysis
- 2.3. Database Building
- 2.3.1. Data Collection
- 2.3.2. Data Validation
- 2.3.3. Data Analysis
- 2.4. Project Methodology
- 2.4.1. Secondary Research
- 2.4.1.1. Annual Reports
- 2.4.1.2. Academic Research Papers
- 2.4.1.3. Company Websites
- 2.4.1.4. Investor Presentations
- 2.4.1.5. Regulatory Filings
- 2.4.1.6. White Papers
- 2.4.1.7. Industry Publications
- 2.4.1.8. Conferences and Seminars
- 2.4.1.9. Government Portals
- 2.4.1.10. Media and Press Releases
- 2.4.1.11. Newsletters
- 2.4.1.12. Industry Databases
- 2.4.1.13. Roots Proprietary Databases
- 2.4.1.14. Paid Databases and Sources
- 2.4.1.15. Social Media Portals
- 2.4.1.16. Other Secondary Sources
- 2.4.2. Primary Research
- 2.4.2.1. Types of Primary Research
- 2.4.2.1.1. Qualitative Research
- 2.4.2.1.2. Quantitative Research
- 2.4.2.1.3. Hybrid Approach
- 2.4.2.2. Advantages of Primary Research
- 2.4.2.3. Techniques for Primary Research
- 2.4.2.3.1. Interviews
- 2.4.2.3.2. Surveys
- 2.4.2.3.3. Focus Groups
- 2.4.2.3.4. Observational Research
- 2.4.2.3.5. Social Media Interactions
- 2.4.2.4. Key Opinion Leaders Considered in Primary Research
- 2.4.2.4.1. Company Executives (CXOs)
- 2.4.2.4.2. Board of Directors
- 2.4.2.4.3. Company Presidents and Vice Presidents
- 2.4.2.4.4. Research and Development Heads
- 2.4.2.4.5. Technical Experts
- 2.4.2.4.6. Subject Matter Experts
- 2.4.2.4.7. Scientists
- 2.4.2.4.8. Doctors and Other Healthcare Providers
- 2.4.2.5. Ethics and Integrity
- 2.4.2.5.1. Research Ethics
- 2.4.2.5.2. Data Integrity
- 2.4.2.1. Types of Primary Research
- 2.4.3. Analytical Tools and Databases
- 2.4.1. Secondary Research
- 2.5. Robust Quality Control
3. MARKET DYNAMICS
- 3.1. Chapter Overview
- 3.2. Forecast Methodology
- 3.2.1. Top-down Approach
- 3.2.2. Bottom-up Approach
- 3.2.3. Hybrid Approach
- 3.3. Market Assessment Framework
- 3.3.1. Total Addressable Market (TAM)
- 3.3.2. Serviceable Addressable Market (SAM)
- 3.3.3. Serviceable Obtainable Market (SOM)
- 3.3.4. Currently Acquired Market (CAM)
- 3.4. Forecasting Tools and Techniques
- 3.4.1. Qualitative Forecasting
- 3.4.2. Correlation
- 3.4.3. Regression
- 3.4.4. Extrapolation
- 3.4.5. Convergence
- 3.4.6. Sensitivity Analysis
- 3.4.7. Scenario Planning
- 3.4.8. Data Visualization
- 3.4.9. Time Series Analysis
- 3.4.10. Forecast Error Analysis
- 3.5. Key Considerations
- 3.5.1. Demographics
- 3.5.2. Government Regulations
- 3.5.3. Reimbursement Scenarios
- 3.5.4. Market Access
- 3.5.5. Supply Chain
- 3.5.6. Industry Consolidation
- 3.5.7. Pandemic / Unforeseen Disruptions Impact
- 3.6. Limitations
4. MACRO-ECONOMIC INDICATORS
- 4.1. Chapter Overview
- 4.2. Market Dynamics
- 4.2.1. Time Period
- 4.2.1.1. Historical Trends
- 4.2.1.2. Current and Forecasted Estimates
- 4.2.2. Currency Coverage
- 4.2.2.1. Major Currencies Affecting the Market
- 4.2.2.2. Factors Affecting Currency Fluctuations on the Industry
- 4.2.2.3. Impact of Currency Fluctuations on the Industry
- 4.2.3. Foreign Currency Exchange Rate
- 4.2.3.1. Impact of Foreign Exchange Rate Volatility on the Market
- 4.2.3.2. Strategies for Mitigating Foreign Exchange Risk
- 4.2.4. Recession
- 4.2.4.1. Assessment of Current Economic Conditions and Potential Impact on the Market
- 4.2.4.2. Historical Analysis of Past Recessions and Lessons Learnt
- 4.2.5. Inflation
- 4.2.5.1. Measurement and Analysis of Inflationary Pressures in the Economy
- 4.2.5.2. Potential Impact of Inflation on Market Evolution
- 4.2.6. Interest Rates
- 4.2.6.1. Interest Rates and Their Impact on the Market
- 4.2.6.2. Strategies for Managing Interest Rate Risk
- 4.2.7. Commodity Flow Analysis
- 4.2.7.1. Type of Commodity
- 4.2.7.2. Origins and Destinations
- 4.2.7.3. Values and Weights
- 4.2.7.4. Modes of Transportation
- 4.2.8. Global Trade Dynamics
- 4.2.8.1. Import Scenario
- 4.2.8.2. Export Scenario
- 4.2.8.3. Trade Policies
- 4.2.8.4. Strategies for Mitigating the Risks Associated with Trade Barriers
- 4.2.8.5. Impact of Trade Barriers on the Market
- 4.2.9. War Impact Analysis
- 4.2.9.1. Russian-Ukraine War
- 4.2.9.2. Israel-Hamas War
- 4.2.10. COVID Impact / Related Factors
- 4.2.10.1. Global Economic Impact
- 4.2.10.2. Industry-specific Impact
- 4.2.10.3. Government Response and Stimulus Measures
- 4.2.10.4. Future Outlook and Adaptation Strategies
- 4.2.11. Other Indicators
- 4.2.11.1. Fiscal Policy
- 4.2.11.2. Consumer Spending
- 4.2.11.3. Gross Domestic Product
- 4.2.11.4. Employment
- 4.2.11.5. Taxes
- 4.2.11.6. Stock Market Performance
- 4.2.11.7. Cross Border Dynamics
- 4.2.1. Time Period
- 4.3. Conclusion
5. EXECUTIVE SUMMARY
- 5.1. Executive Summary: Market Landscape
- 5.2. Executive Summary: Market Trends
- 5.3. Executive Summary: Market Forecast and Opportunity Analysis
6. INTRODUCTION
- 6.1. Chapter Overview
- 6.2. mRNA Therapeutics
- 6.2.1. Advantages of mRNA Therapeutics
- 6.2.2. Key Applications of mRNA Therapeutics
- 6.3. mRNA Vaccines
- 6.3.1. Advantages of mRNA Vaccines
- 6.3.2. Key Applications of mRNA Vaccines
- 6.4. mRNA Delivery Routes
- 6.5. mRNA Delivery Strategies
- 6.6. Key Challenges Associated with mRNA Vaccines and Therapeutics
- 6.7. Future Perspectives
7. MARKET LANDSCAPE
- 7.1. Chapter Overview
- 7.2. mRNA Vaccines and Therapeutics: Overall Market Landscape
- 7.2.1. Analysis by Status of Development
- 7.2.2. Analysis by Type of Drug Candidate
- 7.2.3. Analysis by Type of Program
- 7.2.4. Analysis by Type of Delivery System
- 7.2.5. Analysis by Type of Molecule Encoded
- 7.2.6. Analysis by Route of Administration
- 7.3.7. Analysis by Therapeutic Area
- 7.3. mRNA Vaccines and Therapeutics: Developer Landscape
- 7.3.1. Analysis by Year of Establishment
- 7.3.2. Analysis by Company Size
- 7.3.3. Analysis by Location of Headquarters
- 7.3.4. Most Active Developers: Analysis by Number of Drugs Developed
8. PRODUCT COMPETITIVENESS ANALYSIS
- 8.1. Chapter Overview
- 8.2. Assumptions and Key Parameters
- 8.3. Methodology
- 8.4. mRNA Vaccines and Therapeutics: Product Competitiveness Analysis
- 8.4.1. mRNA Vaccines and Therapeutics Developed by Players based in North America
- 8.4.2. mRNA Vaccines and Therapeutics Developed by Players based in Europe
- 8.4.3. mRNA Vaccines and Therapeutics Developed by Players based in Asia-Pacific and Rest of the World
9. SMALL MOLECULES ASEPTIC FILL FINISH SERVICE PROVIDERS LANDSCAPE
9. COMPANY PROFILES: mRNA VACCINES AND THERAPEUTICS DEVELOPERS BASED IN NORTH AMERICA
- 9.1. Chapter Overview
- 9.2. Leading Developers in mRNA Vaccines and Therapeutics Market based in North America
- 9.2.1. Arcturus Therapeutics
- 9.2.1.1. Company Overview
- 9.2.1.2 Financial Information
- 9.2.1.3. mRNA Vaccines and Therapeutics Portfolio
- 9.2.1.4. Recent Developments and Future Outlook
- 9.2.2. Immorna
- 9.2.2.1. Company Overview
- 9.2.2.2. mRNA Vaccines and Therapeutics Portfolio
- 9.2.2.3. Recent Developments and Future Outlook
- 9.2.3. Moderna
- 9.2.3.1. Company Overview
- 9.2.3.2 Financial Information
- 9.2.3.3. mRNA Vaccines and Therapeutics Portfolio
- 9.2.3.4. Recent Developments and Future Outlook
- 9.2.4. Providence Therapeutics
- 9.2.4.1. Company Overview
- 9.2.4.2 Financial Information
- 9.2.4.3. mRNA Vaccines and Therapeutics Portfolio
- 9.2.4.4. Recent Developments and Future Outlook
- 9.2.5. Innovac Therapeutics
- 9.2.5.1. Company Overview
- 9.2.5.2. mRNA Vaccines and Therapeutics Portfolio
- 9.2.5.3. Recent Developments and Future Outlook
- 9.2.6. Kernal Biologics
- 9.2.6.1. Company Overview
- 9.2.6.2. Financial Information
- 9.2.6.3. mRNA Vaccines and Therapeutics Portfolio
- 9.2.6.4. Recent Developments and Future Outlook
- 9.2.7. Recode Therapeutics
- 9.2.7.1. Company Overview
- 9.2.7.2. Financial Information
- 9.2.7.3. mRNA Vaccines and Therapeutics Portfolio
- 9.2.7.4. Recent Developments and Future Outlook
- 9.2.8. Rejuvenation Technologies
- 9.2.8.1. Company Overview
- 9.2.8.2. Financial Information
- 9.2.8.3. mRNA Vaccines and Therapeutics Portfolio
- 9.2.8.4. Recent Developments and Future Outlook
- 9.2.9. RNAimmune
- 9.2.9.1. Company Overview
- 9.2.9.2. Financial Information
- 9.2.9.3. mRNA Vaccines and Therapeutics Portfolio
- 9.2.9.4. Recent Developments and Future Outlook
- 9.2.10. Turn Biotechnologies
- 9.2.10.1. Company Overview
- 9.2.10.2. Financial Information
- 9.2.10.3. mRNA Vaccines and Therapeutics Portfolio
- 9.2.10.4. Recent Developments and Future Outlook
- 9.2.11. Strand Therapeutics
- 9.2.11.1. Company Overview
- 9.2.11.2. Financial Information
- 9.2.11.3. mRNA Vaccines and Therapeutics Portfolio
- 9.2.11.4. Recent Developments and Future Outlook
- 9.2.1. Arcturus Therapeutics
10. COMPANY PROFILES: mRNA VACCINES AND THERAPEUTICS DEVELOPERS BASED IN EUROPE
- 10.1. Chapter Overview
- 10.2. Leading Developers in mRNA Vaccines and Therapeutics Market based in North America
- 10.2.1. BioNTech
- 10.2.1.1. Company Overview
- 10.2.1.2. Financial Information
- 10.2.1.3. mRNA Vaccines and Therapeutics Portfolio
- 10.2.1.4. Recent Developments and Future Outlook
- 10.2.2. CureVac
- 10.2.2.1. Company Overview
- 10.2.2.2. Financial Information
- 10.2.2.3. mRNA Vaccines and Therapeutics Portfolio
- 10.2.2.4. Recent Developments and Future Outlook
- 10.2.3. Ethris
- 10.2.3.1. Company Overview
- 10.2.3.2. mRNA Vaccines and Therapeutics Portfolio
- 10.2.3.3. Recent Developments and Future Outlook
- 10.2.1. BioNTech
11. COMPANY PROFILES: mRNA VACCINES AND THERAPEUTICS DEVELOPERS BASED IN ASIA PACIFIC
- 11.1. Chapter Overview
- 11.2. Leading Developers in mRNA Vaccines and Therapeutics Market based in North America
- 11.2.1. Suzhou Abogen Biosciences
- 11.2.1.1. Company Overview
- 11.2.1.2. mRNA Vaccines and Therapeutics Portfolio
- 11.2.1.3. Recent Developments and Future Outlook
- 11.2.2. Gennova Biopharmaceuticals
- 11.2.2.1. Company Overview
- 11.2.2.2. Financial Information
- 11.2.2.3. mRNA Vaccines and Therapeutics Portfolio
- 11.2.2.4. Recent Developments and Future Outlook
- 11.2.3. RNACure
- 11.2.3.1. Company Overview
- 11.2.3.2. mRNA Vaccines and Therapeutics Portfolio
- 11.2.3.3. Recent Developments and Future Outlook
- 11.2.4. Walvax
- 11.2.4.1. Company Overview
- 11.2.4.2. Financial Information
- 11.2.4.3. mRNA Vaccines and Therapeutics Portfolio
- 11.2.4.4. Recent Developments and Future Outlook
- 11.2.1. Suzhou Abogen Biosciences
12. BIG PHARMA INITIATIVES
- 12.1. Chapter Overview
- 12.2. Scope and Methodology
- 12.3. mRNA Vaccines and Therapeutics Market: Big Player Initiatives
- 12.3.1. Analysis by Year of Initiative
- 12.3.2. Analysis by Type of Initiative
- 12.3.3. Analysis by Year and Type of Initiative
- 12.3.4. Analysis by Type of Partnership
- 12.3.5. Analysis by Type of Expansion
- 12.3.6. Analysis by Year of Initiative and Company
- 12.3.7. Big Pharma Players: Analysis by Number of Initiatives
- 12.4. Benchmarking Analysis: Big Pharma Players
- 12.4.1. Spider Web Analysis: Bayer
- 12.4.2. Spider Web Analysis: Pfizer
- 12.4.3. Spider Web Analysis: Sanofi
- 12.5. Concluding Remarks
13. START-UP HEALTH INDEXING
- 13.1. Chapter Overview
- 13.2. Start-ups focused on mRNA Vaccines and Therapeutics
- 13.3. Benchmarking of Start-ups
- 13.4. Startup-Health Indexing
- 13.4.1. Analysis by Location of Headquarters
- 13.4.2. Analysis by Company Strength
- 13.4.3. Analysis by Pipeline Maturity
- 13.4.4. Analysis by Pipeline Strength
- 13.4.5. Analysis by Financial Support
- 13.4.6. Analysis by Investor Strength
- 13.4.7. Analysis by Partnership Activity
- 13.4.8. Start-ups Health Indexing: Roots Analysis Perspective
14. CLINICAL TRIAL ANALYSIS
- 14.1. Chapter Overview
- 14.2. Scope and Methodology
- 14.3. mRNA Vaccines and Therapeutics: Clinical Trial Analysis
- 14.3.1. Analysis by Trial Registration Year
- 14.3.2. Analysis of Number of Patients Enrolled by Trial Registration Year
- 14.3.3. Analysis by Trial Phase
- 14.3.4. Analysis of Number of Patients Enrolled by Trial Phase
- 14.3.5. Analysis by Trial Status
- 14.3.6. Analysis by Trial Registration Year and Trial Status
- 14.3.7. Analysis by Patient Gender
- 14.3.8. Analysis by Study Design
- 14.3.8.1. Analysis by Type of Allocation
- 14.3.8.2. Analysis by Type of Intervention Model
- 14.3.8.3. Analysis by Type of Masking
- 14.3.8.4. Analysis by Trial Purpose
- 14.3.9. Analysis by Type of Sponsor / Collaborator
- 14.3.10. Analysis by Geography
- 14.3.10.1. Analysis of Clinical Trials by Geography
- 14.3.10.2. Analysis of Clinical Trials by Geography and Trial Status
- 14.3.10.3. Analysis of Patients Enrolled by Geography and Trial Status
15. PARTNERSHIPS AND COLLABORATIONS
- 15.1. Chapter Overview
- 15.2. Partnership Models
- 15.3. mRNA Vaccines and Therapeutics Market: Partnerships and Collaborations
- 15.3.1. Analysis by Year of Partnership
- 15.3.2. Analysis by Type of Partnership
- 15.3.3. Analysis by Year and Type of Partnership
- 15.3.4. Analysis by Therapeutic Area
- 15.3.5. Most Active Players: Analysis by Number of Partnerships
- 15.3.6. Analysis by Geography
- 15.3.6.1. Intercontinental and Intracontinental Agreements
- 15.3.6.2. Local and International Agreements
16. FUNDING AND INVESTMENTS
- 16.1. Chapter Overview
- 16.2. Funding Models
- 16.3. mRNA Vaccines and Therapeutics Market: Funding and Investment Analysis
- 16.3.1. Analysis by Year of Funding
- 16.3.1.1. Cumulative Year-wise Trend of Funding Instances
- 16.3.1.2. Cumulative Year-wise Trend of Amount Invested
- 16.3.2. Analysis by Type of Funding
- 16.3.2.1. Analysis of Funding Instances
- 16.3.2.2. Analysis of Amount Invested
- 16.3.3. Analysis by Year and Type of Funding
- 16.3.4. Analysis by Amount Raised by Year and Type of Funding
- 16.3.5. Analysis by Therapeutic Area
- 16.3.6. Most Active Players: Analysis by Number of Funding Instances
- 16.3.7. Most Active Players: Analysis by Amount Raised
- 16.3.8. Analysis by Geography
- 16.3.9. Most Active Players: Analysis by Number of Funding Instances
- 16.3.10. Most Active Players: Analysis by Amount Invested
- 16.3.1. Analysis by Year of Funding
- 16.4. Summary of Funding and Investments
17. PATENT ANALYSIS
- 17.1. Chapter Overview
- 17.2. Scope and Methodology
- 17.3. mRNA Vaccines and Therapeutics: Patent Analysis
- 17.3.1. Analysis by Type of Patent
- 17.3.2. Analysis by Patent Publication Year
- 17.3.3. Analysis by Type of Patent and Publication Year
- 17.3.4. Analysis by Patent Application Year
- 17.3.5. Analysis by Patent Jurisdiction
- 17.3.6. Analysis by CPC Symbols
- 17.3.7. Analysis by Type of Applicant
- 17.3.8. Leading Industry Players: Analysis by Number of Patents
- 17.3.9. Leading Non-Industry Players: Analysis by Number of Patents
- 17.3.10. Leading Inventors: Analysis by Number of Patents
- 17.4. Patent Benchmarking Analysis
- 17.4.1. Analysis of Patent Characteristics
- 17.5. Patent Valuation
- 17.6. Leading Patents by Number of Citations
18. FDA APPROVAL STRATEGIES
- 18.1. Chapter Overview
- 18.2. Methodology
- 18.3. Key Parameters
- 18.4. General Reasons for Failure of Trials Focused on mRNA Vaccines and Therapeutics
- 18.5. Benchmarking Analysis: Distribution of Key Strategies by mRNA Vaccines and Therapeutics
19. OUTSOURCING: GO / NO-GO FRAMEWORK
- 19.1. Chapter Overview
- 19.2. Outsourcing: Go / No-Go Framework
- 19.3. mRNA Vaccines and Therapeutics Outsourcing: Go / No-Go Framework
- 19.3.1. Key Parameters and Assumptions
- 19.3.2. Methodology
- 19.3.3. Results and Interpretations
- 19.3.3.1. Outsourcing: Go / No-Go Framework for Small Companies
- 19.3.3.2. Outsourcing: Go / No-Go Framework for Mid-Sized Companies
- 19.3.3.3. Outsourcing: Go / No-Go Framework for Large Companies
20. MARKET IMPACT ANALYSIS
- 20.1. Chapter Overview
- 20.2. Market Drivers
- 20.3. Market Restraints
- 20.4. Market Opportunities
- 20.5. Market Challenges
- 20.6. Conclusion
21. GLOBAL mRNA VACCINES AND THERAPEUTICS MARKET
- 21.1. Chapter Overview
- 21.2. Assumptions and Methodology
- 21.3. Global mRNA Vaccines and Therapeutics Market, Historical Trends (Since 2020) and Forecasted Estimates (Till 2035)
- 21.3.1. Scenario Analysis
- 21.3.1.1. Conservative Scenario
- 21.3.1.2. Optimistic Scenario
- 21.3.1. Scenario Analysis
- 21.4. Key Market Segmentations
22. mRNA VACCINES AND THERAPEUTICS MARKET, BY APPLICATION AREA
- 22.1. Chapter Overview
- 22.2. Key Assumptions and Methodology
- 22.3. mRNA Vaccines and Therapeutics Market: Distribution by Application Area
- 22.3.1. mRNA Vaccines and Therapeutics Market for COVID-19, Historical Trends (Since 2020) and Forecasted Estimates (Till 2035)
- 22.3.2. mRNA Vaccines and Therapeutics Market for Other Indications, Historical Trends (Since 2020) and Forecasted Estimates (Till 2035)
- 22.4. Data Triangulation and Validation
23. mRNA VACCINES AND THERAPEUTICS MARKET, BY TARGET DISEASE INDICATION
- 23.1. Chapter Overview
- 23.2. Key Assumptions and Methodology
- 23.3. mRNA Vaccines and Therapeutics Market: Distribution by Target Disease Indication
- 23.3.1. mRNA Vaccines and Therapeutics Market for Cystic Fibrosis, Historical Trends (Since 2020) and Forecasted Estimates (Till 2035)
- 23.3.2. mRNA Vaccines and Therapeutics Market for Influenza, Historical Trends (Since 2020) and Forecasted Estimates (Till 2035)
- 23.3.3. mRNA Vaccines and Therapeutics Market for Melanoma, Historical Trends (Since 2020) and Forecasted Estimates (Till 2035)
- 23.3.4. mRNA Vaccines and Therapeutics Market for Metastatic/ R/R Head and Neck cancer, Historical Trends (Since 2020) and Forecasted Estimates (Till 2035)
- 23.3.5. mRNA Vaccines and Therapeutics Market for Mononucleosis, Historical Trends (Since 2020) and Forecasted Estimates (Till 2035)
- 23.3.6. mRNA Vaccines and Therapeutics Market for Muscle-Invasive Urothelial Carcinoma, Historical Trends (Since 2020) and Forecasted Estimates (Till 2035)
- 23.3.7. mRNA Vaccines and Therapeutics Market for Non-Small Cell Lung Cancer, Historical Trends (Since 2020) and Forecasted Estimates (Till 2035)
- 23.3.8. mRNA Vaccines and Therapeutics Market for Norovirus Acute Gastroenteritis, Historical Trends (Since 2020) and Forecasted Estimates (Till 2035)
- 23.3.9. mRNA Vaccines and Therapeutics Market for Propionic Acidemia, Historical Trends (Since 2020) and Forecasted Estimates (Till 2035)
- 23.3.10. mRNA Vaccines and Therapeutics Market for RSV Infection, Historical Trends (Since 2020) and Forecasted Estimates (Till 2035)
- 23.4. Data Triangulation and Validation
24. mRNA VACCINES AND THERAPEUTICS MARKET, BY GEOGRAPHICAL REGIONS
- 24.1. Chapter Overview
- 24.2. Key Assumptions and Methodology
- 24.3. mRNA Vaccines and Therapeutics Market: Distribution by Geographical Regions
- 24.3.1. mRNA Vaccines and Therapeutics Market in North America, Historical Trends (Since 2020) and Forecasted Estimates (Till 2035)
- 24.3.1.1. mRNA Vaccines and Therapeutics Market in the US, Historical Trends (Since 2020) and Forecasted Estimates (Till 2035)
- 24.3.1.2. mRNA Vaccines and Therapeutics Market in Canada, Historical Trends (Since 2020) and Forecasted Estimates (Till 2035)
- 24.3.2. mRNA Vaccines and Therapeutics Market in Europe, Historical Trends (Since 2020) and Forecasted Estimates (Till 2035)
- 24.3.2.1. mRNA Vaccines and Therapeutics Market in UK, Historical Trends (Since 2020) and Forecasted Estimates (Till 2035)
- 24.3.2.2. mRNA Vaccines and Therapeutics Market in the Germany, Historical Trends (Since 2020) and Forecasted Estimates (Till 2035)
- 24.3.2.3. mRNA Vaccines and Therapeutics Market in Spain, Historical Trends (Since 2020) and Forecasted Estimates (Till 2035)
- 24.3.2.4. mRNA Vaccines and Therapeutics Market in Italy, Historical Trends (Since 2020) and Forecasted Estimates (Till 2035)
- 24.3.2.5. mRNA Vaccines and Therapeutics Market in France, Historical Trends (Since 2020) and Forecasted Estimates (Till 2035)
- 24.3.2.6. mRNA Vaccines and Therapeutics Market in Rest of Europe, Historical Trends (Since 2020) and Forecasted Estimates (Till 2035)
- 24.3.3. mRNA Vaccines and Therapeutics Market in Asia-Pacific, Historical Trends (Since 2020) and Forecasted Estimates (Till 2035)
- 24.3.3.1. mRNA Vaccines and Therapeutics Market in China, Historical Trends (Since 2020) and Forecasted Estimates (Till 2035)
- 24.3.3.2. mRNA Vaccines and Therapeutics Market in India, Historical Trends (Since 2020) and Forecasted Estimates (Till 2035)
- 24.3.3.3. mRNA Vaccines and Therapeutics Market in Japan, Historical Trends (Since 2020) and Forecasted Estimates (Till 2035)
- 24.3.3.4. mRNA Vaccines and Therapeutics Market in Australia, Historical Trends (Since 2020) and Forecasted Estimates (Till 2035)
- 24.3.6. Penetration Growth (P-G) Matrix
- 24.3.7. Market Movement Analysis
- 24.3.1. mRNA Vaccines and Therapeutics Market in North America, Historical Trends (Since 2020) and Forecasted Estimates (Till 2035)
- 24.4. Data Triangulation and Validation
25. MARKET OPPORTUNITY ANALYSIS: NORTH AMERICA
- 25.1. mRNA Vaccines and Therapeutics Market in North America: Distribution by Application Area
- 25.1.1 mRNA Vaccines and Therapeutics Market in North America for COVID-19, Historical Trends (Since 2020) and Forecasted Estimates (Till 2035)
- 25.1.2. mRNA Vaccines and Therapeutics Market in North America for Other Indications, Historical Trends (Since 2020) and Forecasted Estimates (Till 2035)
- 25.2. mRNA Vaccines and Therapeutics Market in North America: Distribution by Target Disease Indication
- 25.2.1. mRNA Vaccines and Therapeutics Market in North America for Cystic Fibrosis, Historical Trends (Since 2020) and Forecasted Estimates (Till 2035)
- 25.2.2. mRNA Vaccines and Therapeutics Market in North America for Influenza, Historical Trends (Since 2020) and Forecasted Estimates (Till 2035)
- 25.2.3. mRNA Vaccines and Therapeutics Market in North America for Melanoma, Historical Trends (Since 2020) and Forecasted Estimates (Till 2035)
- 25.2.4. mRNA Vaccines and Therapeutics Market in North America for Metastatic/ R/R Head and Neck cancer, Historical Trends (Since 2020) and Forecasted Estimates (Till 2035)
- 25.2.5. mRNA Vaccines and Therapeutics Market in North America for Mononucleosis, Historical Trends (Since 2020) and Forecasted Estimates (Till 2035)
- 25.2.6. mRNA Vaccines and Therapeutics Market in North America for Muscle-Invasive Urothelial Carcinoma, Historical Trends (Since 2020) and Forecasted Estimates (Till 2035)
- 25.2.7. mRNA Vaccines and Therapeutics Market in North America for Non-Small Cell Lung Cancer, Historical Trends (Since 2020) and Forecasted Estimates (Till 2035)
- 25.2.8. mRNA Vaccines and Therapeutics Market in North America for Norovirus Acute Gastroenteritis, Historical Trends (Since 2020) and Forecasted Estimates (Till 2035)
- 25.2.9. mRNA Vaccines and Therapeutics Market in North America for Propionic Acidemia, Historical Trends (Since 2020) and Forecasted Estimates (Till 2035)
- 25.2.10. mRNA Vaccines and Therapeutics Market in North America for RSV Infection, Historical Trends (Since 2020) and Forecasted Estimates (Till 2035)
26. MARKET OPPORTUNITY ANALYSIS: EUROPE
- 26.1. mRNA Vaccines and Therapeutics Market in Europe: Distribution by Application Area
- 26.1.1 mRNA Vaccines and Therapeutics Market in Europe for COVID-19, Historical Trends (Since 2020) and Forecasted Estimates (Till 2035)
- 26.1.2 mRNA Vaccines and Therapeutics Market in Europe for Other Indications, Historical Trends (Since 2020) and Forecasted Estimates (Till 2035)
- 26.2. mRNA Vaccines and Therapeutics Market in Europe: Distribution by Target Disease Indication
- 26.2.1. mRNA Vaccines and Therapeutics Market in Europe for Cystic Fibrosis, Historical Trends (Since 2020) and Forecasted Estimates (Till 2035)
- 26.2.2. mRNA Vaccines and Therapeutics Market in Europe for Influenza, Historical Trends (Since 2020) and Forecasted Estimates (Till 2035)
- 26.2.3. mRNA Vaccines and Therapeutics Market in Europe for Melanoma, Historical Trends (Since 2020) and Forecasted Estimates (Till 2035)
- 26.2.4. mRNA Vaccines and Therapeutics Market in Europe for Metastatic/ R/R Head and Neck cancer, Historical Trends (Since 2020) and Forecasted Estimates (Till 2035)
- 26.2.5. mRNA Vaccines and Therapeutics Market in Europe for Mononucleosis, Historical Trends (Since 2020) and Forecasted Estimates (Till 2035)
- 26.2.6. mRNA Vaccines and Therapeutics Market in Europe for Muscle-Invasive Urothelial Carcinoma, Historical Trends (Since 2020) and Forecasted Estimates (Till 2035)
- 26.2.7. mRNA Vaccines and Therapeutics Market in Europe for Non-Small Cell Lung Cancer, Historical Trends (Since 2020) and Forecasted Estimates (Till 2035)
- 26.2.8. mRNA Vaccines and Therapeutics Market in Europe for Norovirus Acute Gastroenteritis, Historical Trends (Since 2020) and Forecasted Estimates (Till 2035)
- 26.2.9. mRNA Vaccines and Therapeutics Market in Europe for Propionic Acidemia, Historical Trends (Since 2020) and Forecasted Estimates (Till 2035)
- 26.2.10. mRNA Vaccines and Therapeutics Market in Europe for RSV Infection, Historical Trends (Since 2020) and Forecasted Estimates (Till 2035)
27. MARKET OPPORTUNITY ANALYSIS: ASIA PACIFIC
- 27.1.mRNA Vaccines and Therapeutics Market in Asia Pacific: Distribution by Application Area
- 27.1.1 mRNA Vaccines and Therapeutics Market in Asia Pacific for COVID-19, Historical Trends (Since 2020) and Forecasted Estimates (Till 2035)
- 27.1.2. mRNA Vaccines and Therapeutics Market in Asia Pacific for Other Indications, Historical Trends (Since 2020) and Forecasted Estimates (Till 2035)
- 27.2. mRNA Vaccines and Therapeutics Market in Asia Pacific: Distribution by Target Disease Indication
- 27.2.1. mRNA Vaccines and Therapeutics Market in Asia Pacific for Cystic Fibrosis, Historical Trends (Since 2020) and Forecasted Estimates (Till 2035)
- 27.2.2. mRNA Vaccines and Therapeutics Market in Asia Pacific for Influenza, Historical Trends (Since 2020) and Forecasted Estimates (Till 2035)
- 27.2.3. mRNA Vaccines and Therapeutics Market in Asia Pacific for Melanoma, Historical Trends (Since 2020) and Forecasted Estimates (Till 2035)
- 27.2.4. mRNA Vaccines and Therapeutics Market in Asia Pacific for Metastatic/ R/R Head and Neck cancer, Historical Trends (Since 2020) and Forecasted Estimates (Till 2035)
- 27.2.5. mRNA Vaccines and Therapeutics Market in Asia Pacific for Mononucleosis, Historical Trends (Since 2020) and Forecasted Estimates (Till 2035)
- 27.2.6. mRNA Vaccines and Therapeutics Market in Asia Pacific for Muscle-Invasive Urothelial Carcinoma, Historical Trends (Since 2020) and Forecasted Estimates (Till 2035)
- 27.2.7. mRNA Vaccines and Therapeutics Market in Asia Pacific for Non-Small Cell Lung Cancer, Historical Trends (Since 2020) and Forecasted Estimates (Till 2035)
- 27.2.8. mRNA Vaccines and Therapeutics Market in Asia Pacific for Norovirus Acute Gastroenteritis, Historical Trends (Since 2020) and Forecasted Estimates (Till 2035)
- 27.2.9. mRNA Vaccines and Therapeutics Market in Asia Pacific for Propionic Acidemia, Historical Trends (Since 2020) and Forecasted Estimates (Till 2035)
- 27.2.10. mRNA Vaccines and Therapeutics Market in Asia Pacific for RSV Infection, Historical Trends (Since 2020) and Forecasted Estimates (Till 2035)
- CONCLUDING REMARKS
- EXECUTIVE INSIGHTS
- APPENDIX 1: TABULATED DATA
31. APPENDIX 2: LIST OF COMPANIES AND ORGANIZATIONS
List of Tables
- Table 7.1 mRNA Vaccines and Therapeutics: Overall Market Landscape
- Table 7.2 mRNA Vaccines and Therapeutics: Information on Type of Delivery System
- Table 7.3 mRNA Vaccines and Therapeutics: Information on Type of Molecule Encoded
- Table 7.4 mRNA Vaccines and Therapeutics: Information on Route of Administration
- Table 7.5 mRNA Vaccines and Therapeutics Developers: List of Companies
- Table 9.1 mRNA Vaccines and Therapeutics Developers: List of Companies Profiled
- Table 9.2 Arcturus Therapeutics: Company Overview
- Table 9.3 Arcturus Therapeutics: Pipeline Overview
- Table 9.4 Arcturus Therapeutics: Recent Developments and Future Outlook
- Table 9.5 Immorna: Company Overview
- Table 9.6 Immorna: Pipeline Overview
- Table 9.7 Immorna: Recent Developments and Future Outlook
- Table 9.8 Moderna: Company Overview
- Table 9.9 Moderna: Pipeline Overview
- Table 9.10 Moderna: Recent Developments and Future Outlook
- Table 9.11 Providence Therapeutics: Company Overview
- Table 9.12 Providence Therapeutics: Pipeline Overview
- Table 9.13 Providence Therapeutics: Recent Developments and Future Outlook
- Table 9.14 Innovac Therapeutics: Company Overview
- Table 9.15 Innovac Therapeutics: Pipeline Overview
- Table 9.16 Innovac Therapeutics: Recent Developments and Future Outlook
- Table 9.17 Kernal Biologics: Company Overview
- Table 9.18 Kernal Biologics: Pipeline Overview
- Table 9.19 Kernal Biologics: Recent Developments and Future Outlook
- Table 9.20 Recode Therapeutics: Company Overview
- Table 9.21 Recode Therapeutics: Pipeline Overview
- Table 9.22 Recode Therapeutics: Recent Developments and Future Outlook
- Table 9.23 Rejuvenation Technologies: Company Overview
- Table 9.24 Rejuvenation Technologies: Pipeline Overview
- Table 9.25 Rejuvenation Technologies: Recent Developments and Future Outlook
- Table 9.26 RNAimmune: Company Overview
- Table 9.27 RNAimmune: Pipeline Overview
- Table 9.28 RNAimmune: Recent Developments and Future Outlook
- Table 9.29 Turn Biotechnologies: Company Overview
- Table 9.30 Turn Biotechnologies: Pipeline Overview
- Table 9.31 Turn Biotechnologies: Recent Developments and Future Outlook
- Table 9.32 Strand Therapeutics: Company Overview
- Table 9.33 Strand Therapeutics: Pipeline Overview
- Table 9.34 Strand Therapeutics: Recent Developments and Future Outlook
- Table 10.1 BioNTech: Company Overview
- Table 10.2 BioNTech: Pipeline Overview
- Table 10.3 BioNTech: Recent Developments and Future Outlook
- Table 10.4 CureVac: Company Overview
- Table 10.5 CureVac: Pipeline Overview
- Table 10.6 CureVac: Recent Developments and Future Outlook
- Table 10.7 Ethris: Company Overview
- Table 10.8 Ethris: Pipeline Overview
- Table 10.9 Ethris: Recent Developments and Future Outlook
- Table 11.1 Suzhou Abogen Biosciences: Company Overview
- Table 11.2 Suzhou Abogen Biosciences: Pipeline Overview
- Table 11.3 Suzhou Abogen Biosciences: Recent Developments and Future Outlook
- Table 11.4 Gennova Biopharmaceuticals: Company Overview
- Table 11.5 Gennova Biopharmaceuticals: Pipeline Overview
- Table 11.6 Gennova Biopharmaceuticals: Recent Developments and Future Outlook
- Table 11.7 RNACure: Company Overview
- Table 11.8 RNACure: Pipeline Overview
- Table 11.9 RNACure: Recent Developments and Future Outlook
- Table 11.10 Walwax: Company Overview
- Table 11.11 Walwax: Pipeline Overview
- Table 11.12 Walwax: Recent Developments and Future Outlook
- Table 13.1 mRNA Vaccines and Therapeutics Start-ups: Information on Location of Headquarters
- Table 15.1 mRNA Vaccines and Therapeutics: List of Partnerships and Collaborations
- Table 15.2 mRNA Vaccines and Therapeutics: Information on Type of Agreement (Country and Region), since 2013
- Table 16.1 mRNA Vaccines and Therapeutics: List of Funding and Investments
- Table 17.1 Patent Analysis: Top CPC Sections
- Table 17.2 Patent Analysis: Top CPC Symbols
- Table 17.3 Patent Analysis: Top CPC
- Table 17.4 Patent Portfolio: Summary of Benchmarking Analysis
- Table 17.5 Patent Analysis: Categorization based on Weighted Valuation Scores
- Table 17.6 Patent Portfolio: List of Leading Patents (by Highest Relative Valuation)
- Table 21.1 mRNA Vaccines and Therapeutics: Expected Launch Year of Advance Stage Drug Candidates
- Table 32.1 mRNA Vaccines and Therapeutics: Distribution by Status of Development
- Table 32.2 mRNA Vaccines and Therapeutics: Distribution by Type of Drug Candidate
- Table 32.3 mRNA Vaccines and Therapeutics: Distribution by Type of Program
- Table 32.4 mRNA Vaccines and Therapeutics: Distribution by Type of Delivery System
- Table 32.5 mRNA Vaccines and Therapeutics: Distribution by Type of Molecule Encoded
- Table 32.6 mRNA Vaccines and Therapeutics: Distribution by Route of Administration
- Table 32.7 mRNA Vaccines and Therapeutics: Distribution by Therapeutic Area
- Table 32.8 mRNA Vaccines and Therapeutics Developers: Distribution by Year of Establishment
- Table 32.9 mRNA Vaccines and Therapeutics Developers: Distribution by Company Size
- Table 32.10 mRNA Vaccines and Therapeutics Developers: Distribution by Location of Headquarters
- Table 32.11 mRNA Vaccines and Therapeutics Developers: Distribution by Most Active Developers
- Table 32.12 Product Competitiveness Analysis: mRNA Vaccines and Therapeutics Developers based in North America
- Table 32.13 Product Competitiveness Analysis: mRNA Vaccines and Therapeutics Developers based in Europe
- Table 32.14 Product Competitiveness Analysis: mRNA Vaccines and Therapeutics Developers based in Asia-Pacific and Rest of the World
- Table 32.15 Arcturus Therapeutics: Annual Revenues, Since 2021 (USD Billion)
- Table 32.16 Moderna: Annual Revenues, Since 2021 (USD Billion)
- Table 32.17 Providence Therapeutics: Annual Revenues, Since 2021 (USD Billion)
- Table 32.18 Kernal Biologics: Annual Revenues, Since 2021 (USD Billion)
- Table 32.19 Recode Therapeutics: Annual Revenues, Since 2021 (USD Billion)
- Table 32.20 Rejuvenation Technologies: Annual Revenues, Since 2021 (USD Billion)
- Table 32.21 RNAimmune: Annual Revenues, Since 2021 (USD Billion)
- Table 32.22 Turn Biotechnologies: Annual Revenues, Since 2021 (USD Billion)
- Table 32.23 Strand Therapeutics: Annual Revenues, Since 2021 (USD Billion)
- Table 32.24 BioNTech: Annual Revenues, Since 2021 (USD Billion)
- Table 32.25 CureVac: Annual Revenues, Since 2021 (USD Billion)
- Table 32.26 Gennova Biopharmaceuticals: Annual Revenues, Since 2021 (USD Billion)
- Table 32.27 Walvax: Annual Revenues, Since 2021 (USD Billion)
- Table 32.28 Big Pharma Initiatives: Distribution by Year of Initiative
- Table 32.29 Big Pharma Initiatives: Distribution by Type of Initiative
- Table 32.30 Big Pharma Initiatives: Distribution by Year and Type of Initiative
- Table 32.31 Big Pharma Initiatives: Distribution by Type of Partnership
- Table 32.32 Big Pharma Initiatives: Distribution by Type of Expansion
- Table 32.33 Big Pharma Initiatives: Distribution by Year of Initiative and Company
- Table 32.34 Big Pharma Initiatives: Distribution by Number of Initiatives
- Table 32.35 Spider Web Analysis: Bayer
- Table 32.36 Spider Web Analysis: Pfizer
- Table 32.37 Spider Web Analysis: Sanofi
- Table 32.38 Startup-Health Indexing: Distribution by Location of Headquarters
- Table 32.39 Startup-Health Indexing: Distribution by Company Strength
- Table 32.40 Startup-Health Indexing: Distribution by Pipeline Maturity
- Table 32.41 Startup-Health Indexing: Distribution by Pipeline Strength
- Table 32.42 Startup-Health Indexing: Distribution by Financial Support
- Table 32.43 Startup-Health Indexing: Distribution by Investor Strength
- Table 32.44 Startup-Health Indexing: Distribution by Partnership Activity
- Table 32.45 Startup-Health Indexing: Roots Analysis Perspective
- Table 32.46 Start-up Health Indexing: Leading Companies
- Table 32.47 Clinical Trial Analysis: Distribution by Trial Status
- Table 32.48 Clinical Trial Analysis: Distribution by Trial Registration Year
- Table 32.49 Clinical Trial Analysis: Distribution by Trial Phase
- Table 32.50 Clinical Trial Analysis: Distribution by Number of Patients Enrolled by Trial Status
- Table 32.51 Clinical Trial Analysis: Distribution by Type of Sponsor / Collaborator
- Table 32.52 Clinical Trial Analysis: Distribution by Trial Registration Year and Trial Status
- Table 32.53 Clinical Trial Analysis: Distribution of Number of Patients Enrolled by Trial Registration Year
- Table 32.54 Clinical Trial Analysis: Distribution by Study Design
- Table 32.55 Clinical Trial Analysis: Distribution of Leading Industry Players: Analysis by Number of Clinical Trials
- Table 32.56 Clinical Trial Analysis: Distribution by Patient Gender
- Table 32.57 Clinical Trial Analysis: Distribution by Target Patient Population
- Table 32.58 Clinical Trial Analysis: Distribution of Clinical Trials by Geography
- Table 32.59 Clinical Trial Analysis: Distribution of Clinical Trials by Geography and Trial Status
- Table 32.60 Clinical Trial Analysis: Distribution of Patients Enrolled by Geography and Trial Status
- Table 32.61 Clinical Trial Analysis: Distribution by Number of Clinical Trials in Geography
- Table 32.62 Clinical Trial Analysis: Distribution by Number of Patients Enrolled by Geography
- Table 32.63 Partnerships and Collaborations: Distribution by Year of Partnership
- Table 32.64 Partnerships and Collaborations: Distribution by Type of Partnership
- Table 32.65 Partnerships and Collaborations: Distribution by Year and Type of Partnership
- Table 32.66 Partnerships and Collaborations: Distribution by Therapeutic Area
- Table 32.67 Partnerships and Collaborations: Most Active Players: Distribution by Number of Partnerships
- Table 32.68 Partnerships and Collaborations: Intercontinental and Intracontinental Agreements
- Table 32.69 Partnerships and Collaborations: Local and International Agreements
- Table 32.70 Funding and Investment Analysis: Cumulative Year-wise Trend, Pre-2020-2025
- Table 32.71 Funding and Investment Analysis: Cumulative Year-wise Trend of Amount Invested, Pre-2020-2025 (USD Million)
- Table 32.72 Funding and Investment Analysis: Distribution of Funding Instances by Type of Funding
- Table 32.73 Funding and Investment Analysis: Distribution by Year and Type of Funding
- Table 32.74 Funding and Investment Analysis: Distribution of Amount Raised by Year and Type of Funding
- Table 32.75 Funding and Investment Analysis: Distribution by Therapeutic Area
- Table 32.76 Funding and Investment Analysis: Most Active Players: Distribution by Number of Funding Instances
- Table 32.77 Funding and Investment Analysis: Most Active Players: Distribution by Amount Raised
- Table 32.78 Funding and Investment Analysis: Geographical Distribution by Number of Instances
- Table 32.79 Funding and Investment Analysis: Geographical Distribution by Number of Instances by Amount Raised
- Table 32.80 Patent Analysis: Distribution by Type of Patent
- Table 32.81 Patent Analysis: Distribution by Patent Publication Year
- Table 32.82 Patent Analysis: Distribution by Type of Patent and Publication Year
- Table 32.83 Patent Analysis: Distribution by Application Year
- Table 32.84 Patent Analysis: Distribution by Patent Jurisdiction
- Table 32.85 Patent Analysis: Distribution by Distribution by CPC Symbols
- Table 32.86 Patent Analysis: Distribution by Distribution by Type of Applicant
- Table 32.87 Patent Analysis: Distribution of Leading Industry Players: Analysis by Number of Patents
- Table 32.88 Patent Analysis: Distribution of Leading Non-Industry Players: Analysis by Number of Patents
- Table 32.89 Patent Analysis: Distribution of Leading Inventors: Analysis by Number of Patents
- Table 32.90 Patent Benchmarking: Distribution of Leading Industry Players by Patent Characteristics (CPC Codes)
- Table 32.91 Patent Analysis: Patent Valuation
- Table 32.92 FDA Approval Strategies: Distribution of Key Strategies by Vaccines
- Table 32.93 Outsourcing: Go / No-Go Framework
- Table 32.94 Outsourcing: Go / No-Go Framework Methodology
- Table 32.95 Outsourcing: Go / No-Go Framework for Cell and Gene Therapy Developers
- Table 32.96 Outsourcing: Go / No-Go Framework for Small Companies
- Table 32.97 Outsourcing: Go / No-Go Framework for Mid-sized Companies
- Table 32.98 Outsourcing: Go / No-Go Framework for Large Companies
- Table 32.99 mRNA Vaccines and Therapeutics: Market Drivers
- Table 32.100 mRNA Vaccines and Therapeutics: Market Restraints
- Table 32.101 mRNA Vaccines and Therapeutics: Market Opportunities
- Table 32.102 mRNA Vaccines and Therapeutics: Market Challenges.
- Table 32.103 Global mRNA Vaccines and Therapeutics Market, till 2035 (USD Million)
- Table 32.104 Global mRNA Vaccines and Therapeutics Market, till 2035: Conservative Scenario (USD Million)
- Table 32.105 Global mRNA Vaccines and Therapeutics Market, till 2035: Optimistic Scenario (USD Million)
- Table 32.106 mRNA Vaccines and Therapeutics Market: Distribution by Application Area
- Table 32.107 mRNA Vaccines and Therapeutics Market for COVID-19, till 2035 (USD Million)
- Table 32.108 mRNA Vaccines and Therapeutics Market for Other Indications, till 2035 (USD Million)
- Table 32.109 mRNA Vaccines and Therapeutics Market: Distribution by Target Disease Indication
- Table 32.110 mRNA Vaccines and Therapeutics Market for Influenza, till 2035 (USD Million)
- Table 32.111 mRNA Vaccines and Therapeutics Market for Respiratory Syncytial Virus Infection, till 2035 (USD Million)
- Table 32.112 mRNA Vaccines and Therapeutics Market for Cytomegalovirus Disease, till 2035 (USD Million)
- Table 32.113 mRNA Vaccines and Therapeutics Market: Distribution by Geographical Regions
- Table 32.114 mRNA Vaccines and Therapeutics Market in North America, till 2035 (USD Million)
- Table 32.115 mRNA Vaccines and Therapeutics Market in the US, till 2035 (USD Million)
- Table 32.116 mRNA Vaccines and Therapeutics Market in Canada, till 2035 (USD Million)
- Table 32.117 mRNA Vaccines and Therapeutics Market in Europe, till 2035 (USD Million)
- Table 32.118 mRNA Vaccines and Therapeutics Market in Germany, till 2035 (USD Million)
- Table 32.119 mRNA Vaccines and Therapeutics Market in the UK, till 2035 (USD Million)
- Table 32.120 mRNA Vaccines and Therapeutics Market in France, till 2035 (USD Million)
- Table 32.121 mRNA Vaccines and Therapeutics Market in Italy, till 2035 (USD Million)
- Table 32.122 mRNA Vaccines and Therapeutics Market in Spain, till 2035 (USD Million)
- Table 32.123 mRNA Vaccines and Therapeutics Market in Belgium, till 2035 (USD Million)
- Table 32.124 mRNA Vaccines and Therapeutics Market in Asia-Pacific, till 2035 (USD Million)
- Table 32.125 mRNA Vaccines and Therapeutics Market in China, till 2035 (USD Million)
- Table 32.126 mRNA Vaccines and Therapeutics Market in India, till 2035 (USD Million)
- Table 32.127 mRNA Vaccines and Therapeutics Market in Japan, till 2035 (USD Million)
- Table 32.128 mRNA Vaccines and Therapeutics Market in Australia, till 2035 (USD Million)
List of Figures
- Figure 2.1 Research Methodology: Project Methodology
- Figure 2.2 Research Methodology: Secondary Research: Data Sources
- Figure 3.1 Lessons Learnt from Past Recessions
- Figure 4.1 Executive Summary: Market Landscape
- Figure 4.2 Executive Summary: Clinical Trial Analysis
- Figure 4.3 Executive Summary: Partnerships and Collaborations
- Figure 4.4 Executive Summary: Funding and Investment Analysis
- Figure 4.5 Executive Summary: Patent Analysis
- Figure 4.6 Executive Summary: Market Forecast and Opportunity Analysis
- Figure 5.1 Historical Evolution of mRNA
- Figure 5.2 Key Applications of mRNA Therapeutics
- Figure 7.1 mRNA Vaccines and Therapeutics: Distribution by Status of Development
- Figure 7.2 mRNA Vaccines and Therapeutics: Distribution by Type of Drug Candidate
- Figure 7.3 mRNA Vaccines and Therapeutics: Distribution by Type of Program
- Figure 7.4 mRNA Vaccines and Therapeutics: Distribution by Type of Delivery System
- Figure 7.5 mRNA Vaccines and Therapeutics: Distribution by Type of Molecule Encoded
- Figure 7.6 mRNA Vaccines and Therapeutics: Distribution by Route of Administration
- Figure 7.7 mRNA Vaccines and Therapeutics: Distribution by Therapeutic Area
- Figure 7.8 mRNA Vaccines and Therapeutics Developers: Distribution by Year of Establishment
- Figure 7.9 mRNA Vaccines and Therapeutics Developers: Distribution by Company Size
- Figure 7.10 mRNA Vaccines and Therapeutics Developers: Distribution by Location of Headquarters
- Figure 7.11 mRNA Vaccines and Therapeutics Developers: Distribution by Most Active Developers
- Figure 8.1 Product Competitiveness Analysis: mRNA Vaccine and Therapeutics Developed by Players based in North America
- Figure 8.2 Product Competitiveness Analysis: mRNA Vaccine and Therapeutics Developed by Players based in Europe
- Figure 8.3 Product Competitiveness Analysis: mRNA Vaccine and Therapeutics Developed by Players based in Asia-Pacific and Rest of the World
- Figure 9.1 Arcturus Therapeutics: Annual Revenues, Since 2021 (USD Billion)
- Figure 9.2 Moderna: Annual Revenues, Since 2021 (USD Billion)
- Figure 9.3 Providence Therapeutics: Annual Revenues, Since 2021 (USD Billion)
- Figure 9.4 Kernal Biologics: Annual Revenues, Since 2021 (USD Billion)
- Figure 9.5 Recode Therapeutics: Annual Revenues, Since 2021 (USD Billion)
- Figure 9.6 Rejuvenation Technologies: Annual Revenues, Since 2021 (USD Billion)
- Figure 9.7 RNAimmune: Annual Revenues, Since 2021 (USD Billion)
- Figure 9.8 Turn Biotechnologies: Annual Revenues, Since 2021 (USD Billion)
- Figure 9.9 Strand Therapeutics: Annual Revenues, Since 2021(USD Billion)
- Figure 10.1 BioNTech: Annual Revenues, Since 2021 (USD Billion)
- Figure 10.2 CureVac: Annual Revenues, Since 2021 (USD Billion)
- Figure 11.1 Gennova Biopharmaceuticals: Annual Revenues, Since 2021 (USD Billion)
- Figure 11.2 Walvax: Annual Revenues, Since 2021 (USD Billion)
- Figure 12.1 Big Pharma Initiatives: Distribution by Year of Initiative
- Figure 12.2 Big Pharma Initiatives:: Distribution by Type of Initiative
- Figure 12.3 Big Pharma Initiatives:: Distribution by Year and Type of Initiative
- Figure 12.4 Big Pharma Initiatives:: Distribution by Type of Partnership
- Figure 12.5 Big Pharma Initiatives:: Distribution by Type of Expansion
- Figure 12.6 Big Pharma Initiatives:: Distribution by Year of Initiative and Company
- Figure 12.7 Big Pharma Initiatives:: Distribution by Number of Initiatives
- Figure 12.8 Spider Web Analysis: Bayer
- Figure 12.9 Spider Web Analysis: Pfizer
- Figure 12.10 Spider Web Analysis: Sanofi
- Figure 13.1 Startup-Health Indexing: Distribution by Location of Headquarters
- Figure 13.2 Startup-Health Indexing: Distribution by Company Strength
- Figure 13.3 Startup-Health Indexing: Distribution by Pipeline Maturity
- Figure 13.4 Startup-Health Indexing: Distribution by Pipeline Strength
- Figure 13.5 Startup-Health Indexing: Distribution by Financial Support
- Figure 13.6 Startup-Health Indexing: Distribution by Investor Strength
- Figure 13.7 Startup-Health Indexing: Distribution by Partnership Activity
- Figure 13.8 Startup-Health Indexing: Roots Analysis Perspective
- Figure 13.9 Start-up Health Indexing: Leading Companies
- Figure 14.1 Clinical Trial Analysis: Distribution by Trial Status
- Figure 14.2 Clinical Trial Analysis: Distribution by Trial Registration Year
- Figure 14.3 Clinical Trial Analysis: Distribution by Trial Phase
- Figure 14.4 Clinical Trial Analysis: Distribution by Analysis of Number of Patients Enrolled by Trial Status
- Figure 14.5 Clinical Trial Analysis: Distribution by Type of Sponsor / Collaborator
- Figure 14.6 Clinical Trial Analysis: Distribution by Trial Registration Year and Trial Status
- Figure 14.7 Clinical Trial Analysis: Distribution of Number of Patients Enrolled by Trial Registration Year
- Figure 14.8 Clinical Trial Analysis: Distribution by Study Design
- Figure 14.9 Clinical Trial Analysis: Distribution of Leading Industry Players: Analysis by Number of Clinical Trials
- Figure 14.10 Clinical Trial Analysis: Distribution by Patient Gender
- Figure 14.11 Clinical Trial Analysis: Distribution by Target Patient Population
- Figure 14.12 Clinical Trial Analysis: Distribution of Clinical Trials by Geography
- Figure 14.13 Clinical Trial Analysis: Distribution of Clinical Trials by Geography and Trial Status
- Figure 14.14 Clinical Trial Analysis: Distribution of Patients Enrolled by Geography and Trial Status
- Figure 14.15 Clinical Trial Analysis: Distribution by Number of Clinical Trials in Geography
- Figure 14.16 Clinical Trial Analysis: Distribution by Number of Patients Enrolled by Geography
- Figure 15.1 Partnerships and Collaborations: Distribution by Year of Partnership
- Figure 15.2 Partnerships and Collaborations: Distribution by Type of Partnership
- Figure 15.3 Partnerships and Collaborations: Distribution by Year and Type of Partnership
- Figure 15.4 Partnerships and Collaborations: Distribution by Therapeutic Area
- Figure 15.5 Partnerships and Collaborations: Most Active Players: Distribution by Number of Partnerships
- Figure 15.6 Partnerships and Collaborations: Intercontinental and Intracontinental Agreements
- Figure 15.7 Partnerships and Collaborations: Local and International Agreements
- Figure 16.1 Funding and Investment Analysis: Cumulative Year-wise Trend, Pre-2020-2025
- Figure 16.2 Funding and Investment Analysis: Cumulative Year-wise Trend of Amount Invested, Pre-2020-2025 (USD Million)
- Figure 16.3 Funding and Investment Analysis: Distribution of Funding Instances by Type of Funding
- Figure 16.4 Funding and Investment Analysis: Distribution of Amount Raised by Year and Type of Funding
- Figure 16.6 Funding and Investment Analysis: Distribution by Therapeutic Area
- Figure 16.7 Funding and Investment Analysis: Most Active Players: Distribution by Number of Funding Instances
- Figure 16.8 Funding and Investment Analysis: Most Active Players: Distribution by Amount Raised
- Figure 16.9 Funding and Investment Analysis: Geographical Distribution by Number of Instances
- Figure 16.10 Funding and Investment Analysis: Geographical Distribution by Number of Instances by Amount Raised
- Figure 17.1 Patent Analysis: Distribution by Type of Patent
- Figure 17.2 Patent Analysis: Distribution by Patent Publication Year
- Figure 17.3 Patent Analysis: Distribution by Type of Patent and Publication Year
- Figure 17.4 Patent Analysis: Distribution by Application Year
- Figure 17.5 Patent Analysis: Distribution by Patent Jurisdiction
- Figure 17.6 Patent Analysis: Distribution by CPC Symbols
- Figure 17.7 Patent Analysis: Distribution by Type of Applicant
- Figure 17.8 Patent Analysis: Distribution of Leading Industry Players: Analysis by Number of Patents
- Figure 17.9 Patent Analysis: Distribution of Leading Non-Industry Players: Analysis by Number of Patents
- Figure 17.10 Patent Analysis: Distribution of Leading Inventors: Analysis by Number of Patents
- Figure 17.11 Patent Benchmarking: Distribution of Leading Industry Players by Patent Characteristics (CPC Codes)
- Figure 17.12 Patent Analysis: Patent Valuation
- Figure 18.1 FDA Approval Strategies: Distribution of Key Strategies by Vaccines
- Figure 19.1 Outsourcing: Go / No-Go Framework
- Figure 19.2 Outsourcing: Go / No-Go Framework Methodology
- Figure 19.3 Outsourcing: Go / No-Go Framework for Cell and Gene Therapy Developers
- Figure 19.4 Outsourcing: Go / No-Go Framework for Small Companies
- Figure 19.5 Outsourcing: Go / No-Go Framework for Mid-sized Companies
- Figure 19.6 Outsourcing: Go / No-Go Framework for Large Companies
- Figure 20.1 mRNA Vaccine and Therapeutics: Market Drivers
- Figure 20.2 mRNA Vaccine and Therapeutics: Market Restraints
- Figure 20.3 mRNA Vaccine and Therapeutics: Market Opportunities
- Figure 20.4 mRNA Vaccine and Therapeutics: Market Challenges
- Figure 21.1 Global mRNA Vaccine and Therapeutics Market, till 2035 (USD Million)
- Figure 21.2 Global mRNA Vaccine and Therapeutics Market, till 2035: Conservative Scenario (USD Million)
- Figure 21.3 Global mRNA Vaccine and Therapeutics Market, till 2035: Optimistic Scenario (USD Million)
- Figure 22.1 mRNA Vaccine and Therapeutics Market: Distribution by Application Area
- Figure 22.2 mRNA Vaccine and Therapeutics Market for COVID-19, till 2035 (USD Million)
- Figure 22.3 mRNA Vaccine and Therapeutics Market for Other Indications, till 2035 (USD Million)
- Figure 23.1 mRNA Vaccine and Therapeutics Market: Distribution by Target Disease Indication
- Figure 23.2 mRNA Vaccine and Therapeutics Market for Influenza, till 2035 (USD Million)
- Figure 23.3 mRNA Vaccine and Therapeutics Market for Respiratory Syncytial Virus Infection, till 2035 (USD Million)
- Figure 23.4 mRNA Vaccine and Therapeutics Market for Cytomegalovirus Disease, till 2035 (USD Million)
- Figure 24.1 mRNA Vaccine and Therapeutics Market: Distribution by Geographical Regions
- Figure 24.2 mRNA Vaccine and Therapeutics Market in North America, till 2035 (USD Million)
- Figure 24.3 mRNA Vaccine and Therapeutics Market in the US, till 2035 (USD Million)
- Figure 24.4 mRNA Vaccine and Therapeutics Market in Canada, till 2035 (USD Million)
- Figure 24.5 mRNA Vaccine and Therapeutics Market in Europe, till 2035 (USD Million)
- Figure 24.6 mRNA Vaccine and Therapeutics Market in Germany, till 2035 (USD Million)
- Figure 24.7 mRNA Vaccine and Therapeutics Market in the UK, till 2035 (USD Million)
- Figure 24.8 mRNA Vaccine and Therapeutics Market in France, till 2035 (USD Million)
- Figure 24.9 mRNA Vaccine and Therapeutics Market in Italy, till 2035 (USD Million)
- Figure 24.10 mRNA Vaccine and Therapeutics Market in Spain, till 2035 (USD Million)
- Figure 24.11 mRNA Vaccine and Therapeutics Market in Belgium, till 2035 (USD Million)
- Figure 24.12 mRNA Vaccine and Therapeutics Market in Asia-Pacific, till 2035 (USD Million)
- Figure 24.13 mRNA Vaccine and Therapeutics Market in China, till 2035 (USD Million)
- Figure 24.14 mRNA Vaccine and Therapeutics Market in India, till 2035 (USD Million)
- Figure 24.15 mRNA Vaccine and Therapeutics Market in Japan, till 2035 (USD Million)
- Figure 24.17 mRNA Vaccine and Therapeutics Market in Australia, till 2035 (USD Million)
- Figure 30.1 Concluding Remarks: Overall Market Landscape
- Figure 30.2 Concluding Remarks: Partnerships and Collaborations
- Figure 30.3 Concluding Remarks: Funding and Investment Analysis
- Figure 30.4 Concluding Remarks: Clinical Trial Analysis
- Figure 30.5 Concluding Remarks: Patent Analysis
- Figure 30.6 Concluding Remarks: Market Forecast and Opportunity Analysis
 mRNA疫苗和治療市場規模、佔有率、趨勢和預測:按疫苗類型、治療類型、疫苗生產商、應用、最終用戶和地區分類(2026-2034年)
 自擴增RNA合成市場規模、佔有率和成長分析:按產品類型、技術、應用領域、給藥途徑、最終用戶和地區分類-2026-2033年產業預測
 下一代疫苗技術市場分析及預測(至2035年):按類型、產品類型、技術、應用、最終用戶、組件、設備、製程、部署類型和解決方案分類
 全球mRNA疫苗和治療市場規模、佔有率、趨勢和成長分析報告(2026-2034年)全球mRNA疫苗市場規模、佔有率、趨勢和成長分析報告(2026-2034年)
 mRNA疫苗和治療市場:全球產業分析、市場規模、市場佔有率及按治療方法、類型、應用、最終用戶、國家和地區分類的預測——2026-2033年全球mRNA疫苗市場:市場規模、佔有率、成長率、產業分析、依類型、應用和地區劃分的考量因素以及未來預測(2026-2034)
 動物mRNA疫苗:全球市場佔有率和排名、總收入和需求預測(2025-2031年)
 全球mRNA疫苗和療法市場:預測至2032年-按產品、結構、遞送系統、給藥途徑、應用、最終用戶和地區進行分析
 mRNA 疫苗市場-全球產業規模、佔有率、趨勢、機會和預測,按 mRNA 類型、應用、地區和競爭細分,2020-2030 年