


 |
市場調查報告書
商品編碼
2037810
抗體契約製造市場(第三版):按生產的抗體類型、產品類型、使用的表達系統類型、業務規模、治療領域、公司規模和地區分類的趨勢和預測(至2035年)Antibody Contract Manufacturing Market (3rd Edition) by Type of Antibody Manufactured, Type of Product, Type of Expression System Used, Scale of Operation, Therapeutic Area, Company Size and Geographical Regions - Trends and Forecast Till 2035 |
||||||
抗體契約製造市場概覽
全球抗體契約製造市場預計到 2035 年將以 9.7% 的年複合成長率成長,達到 491 億美元,高於目前的 212 億美元。
抗體契約製造市場—成長與趨勢
抗體,又稱免疫球蛋白,是免疫系統產生的特殊蛋白質,用於識別和中和病原體、毒素和異常細胞等外來物質。它們對適應性免疫至關重要,特異性結合抗原,並透過靶向免疫反應將其清除。
多年來,科學知識和生物製程技術的進步推動了抗體療法研發和生產的重大創新,使其日益複雜且療效顯著。然而,這些治療方法研發成本高昂,生產要求複雜,因此許多研發公司為了滿足不斷成長的產業需求,不得不將生產外包給契約製造組織(CMO)。
合約生產機構 (CMO) 透過提供先進的生產基礎設施、技術專長和可擴展的生產能力,能夠加快研發週期並最佳化營運效率。此外,CMO 強大的監管專業知識和品管系統確保符合全球標準,從而幫助企業降低生產風險並加速抗體療法的商業化進程。
成長促進因素-市場擴張的策略推動者
抗體契約製造市場正經歷強勁成長,這主要得益於技術的不斷進步和產業策略的轉變。生物製程的持續創新,包括一次性系統、高通量篩檢平台和重組DNA技術的引入,顯著提高了抗體生產的效率、擴充性和品質。這些優勢使契約製造機構(CMO)能夠滿足複雜生物製藥和生物相似藥研發管線中不斷變化的需求,並提供經濟高效且靈活的解決方案。
此外,生物製藥公司擴大將生產營運外包給合約生產商 (CMO),以最佳化成本、簡化流程並專注於核心研發活動。這種對專業合作夥伴日益成長的依賴,加上抗體生產固有的複雜性,正在提升 CMO 的戰略重要性,並為整個市場創造新的成長機會。
市場挑戰-阻礙進展的主要障礙
抗體契約製造市場面臨許多結構性和營運性挑戰,這些挑戰可能會限制其成長軌跡。其中一個主要問題是抗體生產的高度複雜性。這需要完善的基礎設施、嚴格的流程控制和專業的技術知識,往往會導致產能瓶頸和生產週期延長。
此外,各地不斷演變且日益嚴格的監管要求給合約生產商(CMO)帶來了合規負擔,迫使其持續投資於品質系統和驗證流程。供應鏈的脆弱性,尤其是在關鍵原料採購和低溫運輸物流維護方面,也為市場帶來了進一步的挑戰。價格壓力和CMO之間的激烈競爭影響利潤率,而對智慧財產權保護和技術轉移風險的擔憂可能會限制生物製藥公司的外包決策。這些因素共同構成了市場永續擴充性和營運效率提升的重大障礙。
抗體契約製造市場—關鍵洞察
本報告詳細分析了抗體契約製造市場的現狀,並指出了該行業的潛在成長機會。報告的主要發現包括:
- 隨著技術的進步,合約生產商正在利用創新的工具和技術來革新抗體生產,從而實現更快、更有效率的生產流程,並提供更高品質的產品。
- 在生物製藥行業,抗體契約製造的採用率正在不斷提高,以提高柔軟性、最大限度地降低污染風險並提高成本效益。
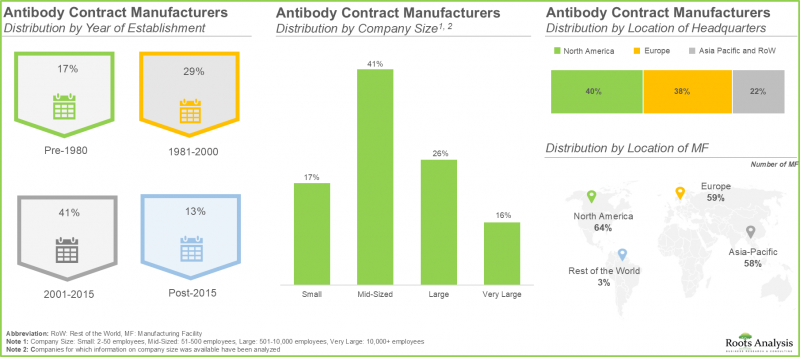
- 目前,有超過 140 家服務供應商從事為不同規模的企業生產各種抗體的工作。
- 近 95% 的製造商以臨床規模運營,其中絕大多數利用哺乳動物表達系統進行抗體生產。
- 世界各地的公司都在積極與業內和業外的公司合作,提供抗體契約製造服務。
- 在該領域達成的大多數協議都與收購無關,而且其中大部分都是近年來達成的。
- 在該地區達成的擴建協議中,大多數(31%)都集中在擴大產能方面。其中,38%的協議是在特定季度內達成的。
- 雖然 75% 的產能擴張目標是北美的製造工廠,但歐洲的大部分擴張舉措(50%) 是為了提高生產能力。
- 全球抗體契約製造運作在各個地區。其中37%的產能位於亞太地區的生產設施。
- 整體需求主要由企業內部生產的抗體所驅動。據信,目前大部分生產需求來自北美商業化的抗體。
- 預計到2035年,抗體生產市場將以9.7%的年複合成長率成長。目前,單株抗體佔了大部分市場。
抗體契約製造市場
市場規模和機會分析是根據以下參數進行細分的:
產生的抗體類型
- 單株抗體
- 雙重特異性
依產品類型
- 原料藥(API)
- FDF
按企業規模
- 臨床量表
- 商業規模
按所使用的表達系統類型
- 哺乳動物表達系統
- 微生物表現系統
按治療區域
- 腫瘤性疾病
- 心血管疾病
- 代謝性疾病
- 感染疾病
- 自體免疫疾病
- 神經系統疾病
- 遺傳性疾病
- 其他疾病
按公司規模
- 小規模企業
- 中型公司
- 大型企業和巨型企業
地區
- 北美洲
- 美國
- 加拿大
- 波多黎各
- 歐洲
- 德國
- 英國
- 法國
- 西班牙
- 義大利
- 其他歐洲國家
- 亞太地區
- 中國
- 韓國
- 日本
- 新加坡
- 亞太其他地區
- 世界其他地區
- 以色列
- 阿根廷
- 非洲
抗體契約製造市場-主要細分市場
單株抗體在全球抗體契約製造市場中佔最大佔有率。
從抗體類型來看,抗體市場可分為單株抗體和雙特異性抗體。目前,單株抗體佔據全球抗體契約製造市場的大部分佔有率。然而,企業也積極研發用於治療用途的雙特異性抗體。
就所使用的表達系統類型而言,微生物表達系統是全球抗體契約製造市場中成長最快的細分市場。
依表現系統類型分類,抗體市場可分為哺乳動物表現系統和微生物表現系統。目前,哺乳動物表達系統在全球抗體契約製造市場中佔據最大佔有率。這是因為哺乳動物表現系統能夠增強抗體的生物活性和結合親和性。
以營運規模計算,商業規模部分在全球抗體契約製造市場中佔最大佔有率。
從生產規模來看,市場可分為臨床規模與商業規模。今年,由於商業抗體生產需求增加,抗體契約製造市場的大部分佔有率由商業規模的生產運作所構成。
北美市佔率最大。
從主要區域來看,抗體合約生產市場分佈於北美、歐洲、亞洲、拉丁美洲以及中東和北非。北美在抗體契約製造市場佔據主導地位,今年的銷售額佔有率最大。此外,預計亞洲市場未來將以更高的年複合成長率成長。
抗體契約製造市場主要公司範例
- AGC Biologics
- Aldevron
- Emergent BioSolutions
- Eurofins CDMO
- FUJIFILM Diosynth Biotechnologies
- KBI Biopharma
- Lonza
- Nitto Avecia Pharma Services
- Novasep
- Pierre Fabre
- Samsung BioLogics
- Synthon
- Thermo Fisher Scientific
第一次調查總結
本研究報告中提出的觀點和見解受到了該領域多位相關人員的討論的影響。 《抗體契約製造市場報告》詳細記錄了與以下相關人員的訪談內容:
- 奧地利一家中型公司的首席執行官
- 德國一家中型公司的業務發展副總裁
- 波蘭一家中型公司的業務拓展主管
- 西班牙一家中型公司的業務拓展和行銷經理
- 曾任台灣一家中型公司業務拓展經理
- 荷蘭某中型公司前通訊經理
抗體契約製造市場:研究範圍
- 市場規模和機會分析:本報告基於關鍵市場細分,對全球抗體合約製造市場進行了全面分析,包括[A]契約製造、[B] 產品類型、[C] 使用的表達系統類型、[D] 業務規模和[E] 治療領域。
- 市場概覽:我們根據相關參數對參與抗體契約製造市場的公司進行詳細評估,例如 [A] 成立年份,[B] 公司規模,[C] 總部所在地,[D] 生產設施所在地,[E] 業務規模,[F] 生產的抗體類型,[G] 使用的表達系統類型,以及 [H] 灌裝和包裝製程。
- 企業競爭分析:這是一項針對抗體契約製造的全面競爭分析,檢驗了以下因素:[A] 企業優勢,[B] 產品組合優勢,以及 [C] 產品組合多樣性。
- 公司簡介:這些是抗體契約製造市場領先服務供應商的詳細簡介,重點關注[A]公司概況、[B]財務資訊(如有)、[C]服務組合以及[D]近期發展和有見地的未來展望。
- 案例研究:對高分子量藥物和低分子量藥物的關鍵特性進行詳細比較,並深入了解它們的生產過程以及它們面臨的挑戰。
- 基準分析:我們進行詳細的基準分析,將每家公司(從中小企業到大型和超大型企業)的現有能力與其各自集團內外的同業在重點領域的現有能力進行比較。
- 生產能力分析:我們根據[A]公司規模和[B]主要地理區域等各種參數,對抗體生產的整體設備能力進行深入分析。
- 需求分析:我們將根據各種相關參數(如[A]目標患者群體、[B]給藥頻率和[C]劑量)詳細研究抗體的年度商業性和臨床需求。
- SWOT 分析:對可能影響抗體契約製造市場發展的產業相關趨勢、機會和挑戰進行分析。
目錄
第1章:序言
第2章:調查方法
第3章 市場動態
第4章 宏觀經濟指標
第5章執行摘要
第6章:引言
- 章節概要
- 抗體的概念
- 抗體結構
- 抗體同型
- 抗體的作用機制
- 抗體類型
- 委託製造概述
- 生物製藥產業外包的需求
- 外包製造服務的優勢
第7章 市場狀況
- 章節概要
- 抗體契約製造生產商:市場現狀
第8章:企業競爭力分析
- 章節概要
- 前提條件和關鍵參數
- 調查方法
- 抗體契約製造企業:企業競爭力分析
- 總部位於北美的抗體契約製造生產商(Peer GroupI)
- 歐洲抗體契約製造生產商(Peer GroupII)
- 總部位於亞太地區及其他地區的抗體契約製造生產商(第三Peer Group)
第9章 公司簡介:主要公司
- 章節概要
- AGC Biologics
- Aldevron
- Axplora(formerly Novasep)
- Emergent Biosolutions
- Eurofins
- FUJIFILM Diosynth Biotechnologies
- KBI Biopharma
- Lonza
- Nitto Avecia Pharma Services
- Pierre Fabre
- Samsung Biologics
- Synthon
- Thermo Fisher Scientific
第10章 公司簡介:新興企業
- 章節概要
- ABL
- Absolute Antibody
- Abzena
- Allele Biotechnology &Pharmaceuticals
- Alvotech
- Antibody Production Services
- Arabio
- Bharat Serums and Vaccines
- Boehringer Ingelheim
- Glenmark Pharmaceuticals
- MilliporeSigma
- Siam Bioscience
第11章案例研究:小分子藥物與大分子藥物(生技藥品)的比較
- 章節概要
- 小分子藥物和生技藥品
第12章夥伴關係與合作
- 章節概要
- 夥伴關係模式
- 抗體契約製造:夥伴關係與合作
第13章 近期擴張
第14章 能力分析
- 章節概要
- 先決條件和調查方法
- 抗體契約製造:全球產能
- 為哺乳動物表現系統提供抗體的契約製造。
- 為微生物表現系統提供抗體的契約製造。
- 結論
第15章 需求分析
- 章節概要
- 先決條件和調查方法
- 全球對抗體契約製造的需求
第16章 市場影響分析:促進因素、阻礙因素、機會與挑戰
第17章:全球抗體契約製造市場
- 章節概要
- 關鍵假設和調查方法
- 全球抗體契約製造市場:歷史趨勢(2022年至今)與預測(至2035年)
- 主要市場區隔
第18章:抗體契約製造市場(依生產的抗體類型分類)
第19章:抗體契約製造市場(依產品類型分類)
第20章 抗體契約製造市場(依企業規模分類)
第21章:抗體契約製造市場(依表達系統類型分類)
第22章 抗體契約製造市場(依治療領域分類)
第23章 抗體契約製造市場(依企業規模分類)
第24章 抗體契約製造市場(依地區分類)
第25章 SWOT分析
第26章:抗體CMO市場的未來展望
第27章 結論
第28章:高階主管洞察
第29章附錄1:表格形式數據
第30章 附錄2:公司與組織列表
Antibody Contract Manufacturing Market: Overview
As per Roots Analysis, the global antibody contract manufacturing market is estimated to grow from USD 21.2 billion in the current year to USD 49.1 billion by 2035, at a CAGR of 9.7% during the forecast period, till 2035.
Antibody Contract Manufacturing Market: Growth and Trends
Antibodies, or immunoglobulins, are specialized proteins produced by the immune system to identify and neutralize foreign entities, including pathogens, toxins, and abnormal cells. They are integral to adaptive immunity, binding specifically to antigens and enabling their clearance through targeted immune responses.
Over time, advancements in scientific understanding and bioprocessing technologies have driven significant innovation in the development and manufacturing of increasingly complex and efficacious antibody-based therapeutics. However, these modalities are characterized by high development costs and complex manufacturing requirements, prompting many developers to outsource production to contract manufacturing organizations (CMOs) to address growing industry demand.
CMOs offer access to advanced manufacturing infrastructure, technical expertise, and scalable production capabilities, thereby accelerating development timelines and optimizing operational efficiency. Furthermore, their robust regulatory expertise and quality management systems ensure compliance with global standards, enabling companies to mitigate manufacturing risks and expedite the commercialization of antibody-based therapies.
Growth Drivers: Strategic Enablers of Market Expansion
The antibody contract manufacturing market is witnessing robust growth, driven by continuous advancements in technology and shifting industry strategies. Ongoing innovations in bioprocessing such as the adoption of single-use systems, high-throughput screening platforms, and recombinant DNA technologies have significantly enhanced the efficiency, scalability, and quality of antibody production. These capabilities enable contract manufacturing organizations (CMOs) to deliver cost-effective and flexible solutions, aligning with the evolving demands of complex biologics and biosimilars pipelines.
Further, biopharmaceutical companies are increasingly outsourcing manufacturing operations to CMOs to optimize costs, streamline timelines, and maintain focus on core research and development activities. This growing reliance on specialized partners, coupled with the inherent complexity of antibody production, is reinforcing the strategic importance of CMOs and unlocking new growth opportunities across the market.
Market Challenges: Critical Barriers Impeding Progress
The antibody contract manufacturing market faces several structural and operational challenges that may constrain its growth trajectory. A key concern is the high complexity of antibody production, which demands advanced infrastructure, stringent process control, and specialized technical expertise, often leading to capacity bottlenecks and increased production timelines.
Additionally, evolving and stringent regulatory requirements across regions create compliance burdens for CMOs, necessitating continuous investments in quality systems and validation processes. The market is further challenged by supply chain vulnerabilities, particularly in sourcing critical raw materials and maintaining cold chain logistics. Pricing pressures and intense competition among CMOs also impact profit margins, while concerns around intellectual property protection and technology transfer risks may limit outsourcing decisions by biopharmaceutical companies. Collectively, these factors present significant hurdles for sustained scalability and operational efficiency within the market.
Antibody Contract Manufacturing Market: Key Insights
The report delves into the current state of the antibody contract manufacturing market and identifies potential growth opportunities within industry. Some key findings from the report include:
- With advancements in technology, CMOs leverage innovative tools and methods to revolutionize antibody production, enabling faster and more efficient processes that deliver higher-quality products.
- The biopharma industry is increasingly adopting antibody contract manufacturing to enhance flexibility, minimize contamination risks, and improve cost efficiency.
- Presently, over 140 service providers are engaged in the manufacturing of various types of antibodies across different scales of operation.
- Close to 95% of the manufactures are operating at clinical scale; of these, majority of the manufacturers are utilizing mammalian expression systems for antibody manufacturing.
- Various companies across the globe have actively entered into partnerships with industry and non-industry players in order to provide antibody contract manufacturing services.
- Majority of the agreements inked in this domain were instances of acquisition; of these, most of the deals were inked in the last few years.
- Majority (31%) of the expansions signed in this domain were focused on capability expansions; 38% of these were signed in a particular quarter.
- 75% of the capability expansions were for manufacturing facilities located in North America; however, in Europe, majority (50%) of the expansion initiatives were undertaken for capacity expansions.
- The global installed antibody contract manufacturing capacity is spread across various regions; 37% of this capacity is available in manufacturing facilities based in Asia-Pacific.
- The overall demand is primarily driven by antibodies manufactured by in-house manufactures; majority of the current manufacturing demand is likely to be generated by the antibodies commercialized in North America.
- The antibody manufacturing market is likely to grow at a CAGR of 9.7%, till 2035; presently, majority of the market share is occupied by monoclonal antibodies.
Antibody Contract Manufacturing Market
The market sizing and opportunity analysis has been segmented across the following parameters:
Type of Antibody Manufactured
- Monoclonal
- Bispecific
By Type of Product
- APIs
- FDFs
By Scale of Operation
- Clinical Scale
- Commercial Scale
By Type of Expression System Used
- Mammalian Expression Systems
- Microbial Expression Systems
By Therapeutic Area
- Oncological Disorders
- Cardiovascular Disorders
- Metabolic Disorders
- Infectious Diseases
- Autoimmune Disorders
- Neurological Disorders
- Genetic Disorders
- Other Disorders
By Company Size
- Small Companies
- Mid-sized Companies
- Large and Very Large Companies
Geographical Regions
- North America
- US
- Canada
- Puerto Rico
- Europe
- Germany
- UK
- France
- Spain
- Italy
- Rest of Europe
- Asia-Pacific
- China
- South Korea
- Japan
- Singapore
- Rest of the Asia-Pacific
- Rest of the World
- Israel
- Argentina
- Africa
Antibody Contract Manufacturing Market: Key Segments
Monoclonal Antibodies Occupy the Largest Share of the Global Antibody Contract Manufacturing Market
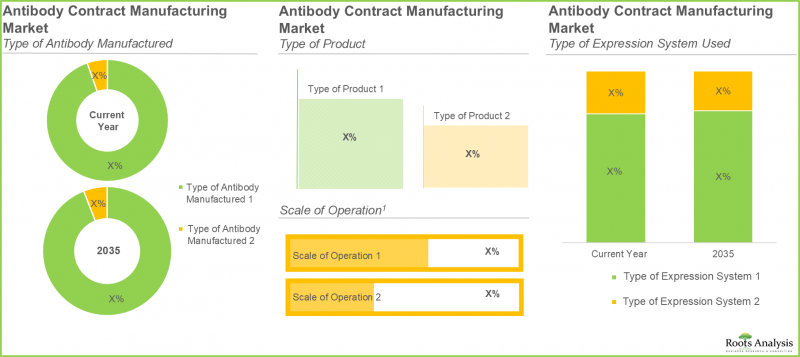
In terms of the type of antibody manufactured, the market is distributed across monoclonal and bispecific antibody. At present, the monoclonal antibody segment constitutes the majority share of the global antibody contract manufacturing market. However, players are also intensely focused on the development of bispecific antibodies for therapeutic purposes.
By Type of Expression System Used, Microbial Expression System is the Fastest Growing Segment of the Global Antibody Contract Manufacturing Market
In terms of the type of expression system used, the market is distributed across mammalian and microbial expression systems. Currently, the mammalian expression systems capture the highest share of the global antibody contract manufacturing market. This is due to the fact that mammalian expression systems enable antibodies to achieve greater biological activity and binding affinity.
By Scale of Operation, Commercial Scale Segment Occupies the Largest Share of the Global Antibody Contract Manufacturing Market
In terms of the scale of operation, the market is distributed across clinical and commercial scale. In the current year, majority of the antibody contract manufacturing market is held by commercial scale owing to the increasing demand for commercial production of antibodies.
North America Accounts for the Largest Share of the Market
In terms of key geographical regions, the market is distributed across North America, Europe, Asia, Latin America and Middle East and North Africa. North America dominates the antibody contract manufacturing market and accounts for the largest revenue share in the current year. Further, the market in Asia is likely to grow at a higher CAGR in the coming future.
Example Players in the Antibody Contract Manufacturing Market
- AGC Biologics
- Aldevron
- Emergent BioSolutions
- Eurofins CDMO
- FUJIFILM Diosynth Biotechnologies
- KBI Biopharma
- Lonza
- Nitto Avecia Pharma Services
- Novasep
- Pierre Fabre
- Samsung BioLogics
- Synthon
- Thermo Fisher Scientific
Primary Research Overview
Discussions with multiple stakeholders in this domain influenced the opinions and insights presented in this study. The antibody contract manufacturing market report includes detailed transcripts of interviews conducted with the following individuals:
- Managing Director, Mid-sized Company, Austria
- Vice President Business Development, Mid-sized Company, Germany
- Director of Business Development, Mid-sized Company, Poland
- Business Development and Marketing Manager, Mid-sized Company, Spain
- Former Business Development Manager, Mid-sized Company, Taiwan
- Former Communications Manager, Mid-sized Company, Netherlands
Antibody Contract Manufacturing Market: Research Coverage
- Market Sizing and Opportunity Analysis: The report features a thorough analysis of the global antibody contract manufacturing market, in terms of the key market segments, including [A] type of antibody manufactured, [B] type of product, [C] type of expression system used, [D] scale of operation, [E] therapeutic area,
- Market Landscape: An in-depth assessment of the companies involved in antibody contract manufacturing market, based on several relevant parameters, such as [A] year of establishment, [B] company size, [C] location of headquarters, [D] location of manufacturing facilities, [E] scale of operation, [F] type of antibody manufactured, [G] type of expression systems used, and [H] fill / finish operations.
- Company Competitiveness Analysis: A comprehensive competitive analysis of antibody contract manufacturers, examining factors, such as [A] company strength and [B] portfolio strength and [C] portfolio diversity.
- Company Profiles: Detailed profiles of key service providers engaged in the antibody contract manufacturing market, emphasizing on [A] overview of the company, [B] financial information (if available), [C] service portfolio, and [D] recent developments and an informed future outlook.
- Case Study: A detailed comparison of the key features of large and small molecule drugs, along with insights into the manufacturing steps and challenges faced during these manufacturing processes.
- Benchmark Analysis: A detailed benchmark analysis of the key focus areas of small, mid-sized, large and very large companies by comparing their existing capabilities within and outside their respective peer groups.
- Capacity Analysis: An insightful analysis of the overall, installed capacity for manufacturing antibodies, based on various parameters, such as [A] company size and [B] key geographical regions.
- Demand Analysis: An in-depth review of the annual commercial and clinical demand for antibodies, based on various relevant parameters, such as [A] target patient population, [B] dosing frequency and [C] dose strength.
- SWOT Analysis: An analysis of industry affiliated trends, opportunities and challenges, which are likely to impact the evolution of antibody contract manufacturing market.
Key Questions Answered in this Report
- Which are the leading companies in the antibody contract manufacturing market?
- Which region dominates the antibody contract manufacturing market?
- What are the key trends observed in the antibody contract manufacturing market?
- What factors are likely to influence the evolution of this market?
- What are the primary challenges faced by antibody contract manufacturers?
- What is the current and future market size?
- What is the CAGR of this market?
- How is the current and future market opportunity likely to be distributed across key market segments?
Reasons to Buy this Report
- The report provides a comprehensive market analysis, offering detailed revenue projections of the overall market and its specific sub-segments. This information is valuable to both established market leaders and emerging entrants.
- The report offers stakeholders a comprehensive overview of the market, including key drivers, barriers, opportunities, and challenges. This information empowers stakeholders to stay abreast of market trends and make data-driven decisions to capitalize on growth prospects.
- The report can aid businesses in identifying future opportunities in any sector. It also helps in understanding if those opportunities are worth pursuing.
- The report helps in identifying customer demand by understanding the needs, preferences, and behavior of the target audience in order to tailor products or services effectively.
- The report equips new entrants with requisite information regarding a particular market to help them build successful business strategies.
- The report allows for more effective communication with the audience and in building strong business relations.
Additional Benefits
- Complimentary PPT Insights Packs
- Complimentary Excel Data Packs for all Analytical Modules in the Report
- 15% Free Content Customization
- Detailed Report Walkthrough Session with Research Team
- Free Updated report if the report is 6-12 months old or older
TABLE OF CONTENTS
1. PREFACE
- 1.1. Introduction
- 1.2. Market Share Insights
- 1.3. Key Market Insights
- 1.4. Report Coverage
- 1.5. Key Questions Answered
2. RESEARCH METHODOLOGY
- 2.1. Chapter Overview
- 2.2. Research Assumptions
- 2.2.1. Market Landscape and Market Trends
- 2.2.2. Market Forecast and Opportunity Analysis
- 2.2.3. Comparative Analysis
- 2.3. Database Building
- 2.3.1. Data Collection
- 2.3.2. Data Validation
- 2.3.3. Data Analysis
- 2.4. Project Methodology
- 2.4.1. Secondary Research
- 2.4.1.1. Annual Reports
- 2.4.1.2. Academic Research Papers
- 2.4.1.3. Company Websites
- 2.4.1.4. Investor Presentations
- 2.4.1.5. Regulatory Filings
- 2.4.1.6. White Papers
- 2.4.1.7. Industry Publications
- 2.4.1.8. Conferences and Seminars
- 2.4.1.9. Government Portals
- 2.4.1.10. Media and Press Releases
- 2.4.1.11. Newsletters
- 2.4.1.12. Industry Databases
- 2.4.1.13. Roots Proprietary Databases
- 2.4.1.14. Paid Databases and Sources
- 2.4.1.15. Social Media Portals
- 2.4.1.16. Other Secondary Sources
- 2.4.2. Primary Research
- 2.4.2.1. Types of Primary Research
- 2.4.2.1.1. Qualitative Research
- 2.4.2.1.2. Quantitative Research
- 2.4.2.1.3. Hybrid Approach
- 2.4.2.2. Advantages of Primary Research
- 2.4.2.3. Techniques for Primary Research
- 2.4.2.3.1. Interviews
- 2.4.2.3.2. Surveys
- 2.4.2.3.3. Focus Groups
- 2.4.2.3.4. Observational Research
- 2.4.2.3.5. Social Media Interactions
- 2.4.2.4. Key Opinion Leaders Considered in Primary Research
- 2.4.2.4.1. Company Executives (CXOs)
- 2.4.2.4.2. Board of Directors
- 2.4.2.4.3. Company Presidents and Vice Presidents
- 2.4.2.4.4. Research and Development Heads
- 2.4.2.4.5. Technical Experts
- 2.4.2.4.6. Subject Matter Experts
- 2.4.2.4.7. Scientists
- 2.4.2.4.8. Doctors and Other Healthcare Providers
- 2.4.2.5. Ethics and Integrity
- 2.4.2.5.1. Research Ethics
- 2.4.2.5.2. Data Integrity
- 2.4.2.1. Types of Primary Research
- 2.4.3. Analytical Tools and Databases
- 2.4.1. Secondary Research
- 2.5. Robust Quality Control
3. MARKET DYNAMICS
- 3.1. Chapter Overview
- 3.2. Forecast Methodology
- 3.2.1. Top-down Approach
- 3.2.2. Bottom-up Approach
- 3.2.3. Hybrid Approach
- 3.3. Market Assessment Framework
- 3.3.1. Total Addressable Market (TAM)
- 3.3.2. Serviceable Addressable Market (SAM)
- 3.3.3. Serviceable Obtainable Market (SOM)
- 3.3.4. Currently Acquired Market (CAM)
- 3.4. Forecasting Tools and Techniques
- 3.4.1. Qualitative Forecasting
- 3.4.2. Correlation
- 3.4.3. Regression
- 3.4.4. Extrapolation
- 3.4.5. Convergence
- 3.4.6. Sensitivity Analysis
- 3.4.7. Scenario Planning
- 3.4.8. Data Visualization
- 3.4.9. Time Series Analysis
- 3.4.10. Forecast Error Analysis
- 3.5. Key Considerations
- 3.5.1. Demographics
- 3.5.2. Government Regulations
- 3.5.3. Reimbursement Scenarios
- 3.5.4. Market Access
- 3.5.5. Supply Chain
- 3.5.6. Industry Consolidation
- 3.5.7. Pandemic / Unforeseen Disruptions Impact
- 3.6. Limitations
4. MACRO-ECONOMIC INDICATORS
- 4.1. Chapter Overview
- 4.2. Market Dynamics
- 4.2.1. Time Period
- 4.2.1.1. Historical Trends
- 4.2.1.2. Current and Forecasted Estimates
- 4.2.2. Currency Coverage
- 4.2.2.1. Major Currencies Affecting the Market
- 4.2.2.2. Factors Affecting Currency Fluctuations on the Industry
- 4.2.2.3. Impact of Currency Fluctuations on the Industry
- 4.2.3. Foreign Currency Exchange Rate
- 4.2.3.1. Impact of Foreign Exchange Rate Volatility on the Market
- 4.2.3.2. Strategies for Mitigating Foreign Exchange Risk
- 4.2.4. Recession
- 4.2.4.1. Assessment of Current Economic Conditions and Potential Impact on the Market
- 4.2.4.2. Historical Analysis of Past Recessions and Lessons Learnt
- 4.2.5. Inflation
- 4.2.5.1. Measurement and Analysis of Inflationary Pressures in the Economy
- 4.2.5.2. Potential Impact of Inflation on the Market Evolution
- 4.2.6. Interest Rates
- 4.2.6.1. Interest Rates and Their Impact on the Market
- 4.2.6.2. Strategies for Managing Interest Rate Risk
- 4.2.7. Commodity Flow Analysis
- 4.2.7.1. Type of Commodity
- 4.2.7.2. Origins and Destinations
- 4.2.7.3. Values and Weights
- 4.2.7.4. Modes of Transportation
- 4.2.8. Global Trade Dynamics
- 4.2.8.1. Import Scenario
- 4.2.8.2. Export Scenario
- 4.2.8.3. Trade Policies
- 4.2.8.4. Strategies for Mitigating the Risks Associated with Trade Barriers
- 4.2.8.5. Impact of Trade Barriers on the Market
- 4.2.9. War Impact Analysis
- 4.2.9.1. Russian-Ukraine War
- 4.2.9.2. Israel-Hamas War
- 4.2.10. COVID Impact / Related Factors
- 4.2.10.1. Global Economic Impact
- 4.2.10.2. Industry-specific Impact
- 4.2.10.3. Government Response and Stimulus Measures
- 4.2.10.4. Future Outlook and Adaptation Strategies
- 4.2.11. Other Indicators
- 4.2.11.1. Fiscal Policy
- 4.2.11.2. Consumer Spending
- 4.2.11.3. Gross Domestic Product
- 4.2.11.4. Employment
- 4.2.11.5. Taxes
- 4.2.11.6. Stock Market Performance
- 4.2.11.7. Cross Border Dynamics
- 4.2.1. Time Period
- 4.3. Conclusion
5. EXECUTIVE SUMMARY
- 5.1. Executive Summary: Market Landscape
- 5.2. Executive Summary: Market Trends
- 5.3. Executive Summary: Market Forecast and Opportunity Analysis
6. INTRODUCTION
- 6.1. Chapter Overview
- 6.2. Concept of an Antibody
- 6.3. Structure of an Antibody
- 6.4. Antibody Isotypes
- 6.5. Mechanism of Action of Antibodies
- 6.6. Types of Antibodies
- 6.6.1. Monoclonal Antibodies
- 6.6.1.1. Monoclonal Antibody-based Cancer Therapies
- 6.6.1.2. Mechanism of Action of Monoclonal Antibodies
- 6.6.1.3. Applications of Monoclonal Antibodies
- 6.6.2. Bispecific Antibodies
- 6.6.2.1. Bispecific Antibody Formats
- 6.6.2.2. Mechanism of Action of Bispecific Antibodies
- 6.6.2.3. Applications of Bispecific Antibodies
- 6.6.3. Polyclonal Antibodies
- 6.6.3.1. Applications of Polyclonal Antibodies
- 6.6.1. Monoclonal Antibodies
- 6.7. Overview of Contract Manufacturing
- 6.8. Need for Outsourcing in the Biopharmaceutical Industry
- 6.9. Advantages of Outsourcing Manufacturing Services
7. MARKET LANDSCAPE
- 7.1. Chapter Overview
- 7.2. Antibody Contract Manufacturers: Overall Market Landscape
- 7.2.1. Analysis by Year of Establishment
- 7.2.2. Analysis by Company Size
- 7.2.3. Analysis by Location of Headquarters
- 7.2.4. Analysis by Location of Antibody Contract Manufacturing Facilities
- 7.2.5. Analysis by Scale of Operation
- 7.2.6. Analysis by Type of Antibody Manufactured
- 7.2.7. Analysis by Type of Expression System Used
- 7.2.8. Analysis by Fill / Finish Services Offered
8. COMPANY COMPETITIVENESS ANALYSIS
- 8.1. Chapter Overview
- 8.2. Assumptions and Key Parameters
- 8.3. Methodology
- 8.4. Antibody Contract Manufacturers: Company Competitiveness Analysis
- 8.4.1. Antibody Contract Manufacturers Based in North America (Peer Group I)
- 8.4.2. Antibody Contract Manufacturers Based in Europe (Peer Group II)
- 8.4.3. Antibody Contract Manufacturers Based in Asia-Pacific and Rest of the World (Peer Group III)
9. COMPANY PROFILES: PROMINENT PLAYERS
- 9.1. Chapter Overview
- 9.2. AGC Biologics
- 9.2.1. Company Overview
- 9.2.2. Antibody Contract Manufacturing Service Portfolio
- 9.2.3. Recent Developments and Future Outlook
- Similar details are presented for other companies mentioned below (based on information in the public domain)
- 9.3. Aldevron
- 9.4. Axplora (formerly Novasep)
- 9.5. Emergent Biosolutions
- 9.6. Eurofins
- 9.7. FUJIFILM Diosynth Biotechnologies
- 9.8. KBI Biopharma
- 9.9. Lonza
- 9.10. Nitto Avecia Pharma Services
- 9.11. Pierre Fabre
- 9.12. Samsung Biologics
- 9.13. Synthon
- 9.14. Thermo Fisher Scientific
10. COMPANY PROFILES: EMERGING PLAYERS
- 10.1. Chapter Overview
- 10.2. ABL
- 10.2.1. Company Overview
- 10.2.2. Antibody Contract Manufacturing Service Portfolio
- Similar details are presented for other companies mentioned below (based on information in the public domain)
- 10.3. Absolute Antibody
- 10.4. Abzena
- 10.5. Allele Biotechnology & Pharmaceuticals
- 10.6. Alvotech
- 10.7. Antibody Production Services
- 10.8. Arabio
- 10.9. Bharat Serums and Vaccines
- 10.10. Boehringer Ingelheim
- 10.11. Glenmark Pharmaceuticals
- 10.12. MilliporeSigma
- 10.13. Siam Bioscience
11. CASE STUDY: COMPARISON OF SMALL AND LARGE MOLECULE (BIOLOGICS) DRUGS / THERAPIES
- 11.1. Chapter Overview
- 11.2. Small Molecules and Biologics
- 11.2.1. Comparison of Strengths and Weakness of Small Molecules and Biologics
- 11.2.2. Comparison of Key Characteristics of Small Molecules and Biologics
- 11.2.3. Comparison of Manufacturing Processes of Small Molecules and Biologics
- 11.2.4. Comparison of Key Manufacturing related Challenges
12. PARTNERSHIPS AND COLLABORATIONS
- 12.1. Chapter Overview
- 12.2. Partnerships Models
- 12.3. Antibody Contract Manufacturers: Partnerships and Collaborations
- 12.3.1. Quarterly Trend of Partnerships
- 12.3.2. Analysis by Type of Partnership
- 12.3.3. Analysis by Quarterly Trend and Type of Partnership
- 12.3.4. Most Active Players: Analysis by Number of Partnerships
- 12.3.5. Analysis by Geography
- 12.3.5.1. Local and International Agreements
- 12.3.5.2. Intracontinental and Intercontinental Agreements
13. RECENT EXPANSIONS
- 13.1. Chapter Overview
- 13.2. Type of Expansions
- 13.3. Recent Expansions: Antibody Contract Manufacturing Organizations
- 13.3.1. Quarterly Trend of Expansions
- 13.3.2. Analysis by Type of Expansion
- 13.3.3. Analysis by Quarterly Trend and Type of Expansion
- 13.3.4. Analysis by Location of Facility (Region)
- 13.3.5. Analysis by Location of Facility (Country)
- 13.3.6. Analysis by Type of Expansion and Location of Facility (Region)
- 13.3.7. Analysis of Amount Invested by Quarter of Expansion
- 13.3.8. Analysis of Amount Invested by Type of Expansion
- 13.3.9. Most Active Players: Analysis by Number of Expansions
- 13.3.10. Most Active Players: Analysis by Amount Invested
14. CAPACITY ANALYSIS
- 14.1. Chapter Overview
- 14.2. Assumptions and Methodology
- 14.3. Antibody Contract Manufacturing: Global Installed Capacity
- 14.3.1. Analysis by Company Size
- 14.3.2. Analysis by Location of Manufacturing Facilities
- 14.3.3. Analysis by Type of Expression System Used
- 14.4. Antibody Contract Manufacturing Capacity for Mammalian Expression Systems
- 14.4.1. Analysis by Company Size
- 14.4.2. Analysis by Location of Manufacturing Facilities
- 14.5. Antibody Contract Manufacturing Capacity for Microbial Expression Systems
- 14.5.1. Analysis by Company Size
- 14.5.2. Analysis by Location of Manufacturing Facilities
- 14.6. Concluding Remarks
15. DEMAND ANALYSIS
- 15.1. Chapter Overview
- 15.2. Assumptions and Methodology
- 15.3. Global Demand for Antibody Contract Manufacturing
- 15.3.1. Demand for Antibody Contract Manufacturing: Distribution by Type of Antibody
- 15.3.2. Demand for Antibody Contract Manufacturing: Distribution by Scale of Operation
- 15.3.3. Demand for Antibody Contract Manufacturing: Distribution by Type of Manufacturer
- 15.3.4. Demand for Antibody Contract Manufacturing: Distribution by Geographical Regions
16. MARKET IMPACT ANALYSIS: DRIVERS, RESTRAINTS, OPPORTUNITIES AND CHALLENGES
- 16.1. Chapter Overview
- 16.2. Market Drivers
- 16.3. Market Restraints
- 16.4. Market Opportunities
- 16.5. Market Challenges
- 16.6. Conclusion
17. GLOBAL ANTIBODY CONTRACT MANUFACTURING MARKET
- 17.1. Chapter Overview
- 17.2. Key Assumptions and Methodology
- 17.3. Global Antibody Contract Manufacturing Market: Historical Trends (Since 2022) and Forecasted Estimates (Till 2035)
- 17.3.1. Roots Analysis Perspective on Market Growth
- 17.3.2 Scenario Analysis
- 17.3.2.1. Conservative Scenario
- 17.3.2.2. Optimistic Scenario
- 17.4. Key Market Segmentations
18. ANTIBODY CONTRACT MANUFACTURING MARKET, BY TYPE OF ANTIBODY MANUFCATURED
- 18.1. Chapter Overview
- 18.2. Key Assumptions and Methodology
- 18.3. Antibody Contract Manufacturing Market: Distribution by Type of Antibody Manufactured
- 18.3.1. Antibody Contract Manufacturing Market for Monoclonal Antibodies: Historical Trends (Since 2022) and Forecasted Estimates (Till 2035)
- 18.3.2. Antibody Contract Manufacturing Market for Bispecific Antibodies: Historical Trends (Since 2022) and Forecasted Estimates (Till 2035)
- 18.4. Data Triangulation and Validation
19. ANTIBODY CONTRACT MANUFACTURING MARKET, BY TYPE OF PRODUCT
- 19.1. Chapter Overview
- 19.2. Key Assumptions and Methodology
- 19.3. Antibody Contract Manufacturing Market: Distribution by Type of Product
- 19.3.1. Antibody Contract Manufacturing Market for APIs: Historical Trends (Since 2022) and Forecasted Estimates (Till 2035)
- 19.3.2. Antibody Contract Manufacturing Market for FDFs: Historical Trends (Since 2022) and Forecasted Estimates (Till 2035)
- 19.4. Data Triangulation and Validation
20. ANTIBODY CONTRACT MANUFACTURING MARKET, BY SCALE OF OPERATION
- 20.1. Chapter Overview
- 20.2. Key Assumptions and Methodology
- 20.3. Antibody Contract Manufacturing Market: Distribution by Scale of Operation
- 20.3.1. Antibody Contract Manufacturing Market at Clinical Scale: Historical Trends (Since 2022) and Forecasted Estimates (Till 2035)
- 20.3.2. Antibody Contract Manufacturing Market at Commercial Scale: Historical Trends (Since 2022) and Forecasted Estimates (Till 2035)
- 20.4. Data Triangulation and Validation
21. ANTIBODY CONTRACT MANUFACTURING MARKET, BY TYPE OF EXPRESSION SYSTEM USED
- 21.1. Chapter Overview
- 21.2. Key Assumptions and Methodology
- 21.3. Antibody Contract Manufacturing Market: Distribution by Type of Expression System Used
- 21.3.1. Antibody Contract Manufacturing Market for Mammalian Expression System: Historical Trends (Since 2022) and Forecasted Estimates (Till 2035)
- 21.3.2. Antibody Contract Manufacturing Market for Microbial Expression System: Historical Trends (Since 2022) and Forecasted Estimates (Till 2035)
- 21.4. Data Triangulation and Validation
22. ANTIBODY CONTRACT MANUFACTURING MARKET, BY THERAPEUTIC AREA
- 22.1. Chapter Overview
- 22.2. Key Assumptions and Methodology
- 22.3. Antibody Contract Manufacturing Market: Distribution by Therapeutic Area
- 22.3.1. Antibody Contract Manufacturing Market for Oncological Disorders: Historical Trends (Since 2022) and Forecasted Estimates (Till 2035)
- 22.3.2. Antibody Contract Manufacturing Market for Cardiovascular Disorders: Historical Trends (Since 2022) and Forecasted Estimates (Till 2035)
- 22.3.3. Antibody Contract Manufacturing Market for Metabolic Disorders: Historical Trends (Since 2022) and Forecasted Estimates (Till 2035)
- 22.3.4. Antibody Contract Manufacturing Market for Infectious Diseases: Historical Trends (Since 2022) and Forecasted Estimates (Till 2035)
- 22.3.5. Antibody Contract Manufacturing Market for Autoimmune Disorders: Historical Trends (Since 2022) and Forecasted Estimates (Till 2035)
- 22.3.6. Antibody Contract Manufacturing Market for Neurological Disorders: Historical Trends (Since 2022) and Forecasted Estimates (Till 2035)
- 22.3.7. Antibody Contract Manufacturing Market for Genetic Disorders: Historical Trends (Since 2022) and Forecasted Estimates (Till 2035)
- 22.3.8. Antibody Contract Manufacturing Market for Other Disorders: Historical Trends (Since 2022) and Forecasted Estimates (Till 2035)
- 22.4. Data Triangulation and Validation
23. ANTIBODY CONTRACT MANUFACTURING MARKET, BY SCALE OF OPERATION
- 23.1. Chapter Overview
- 23.2. Key Assumptions and Methodology
- 23.3. Antibody Contract Manufacturing Market: Distribution by Scale of Operation
- 23.3.1. Antibody Contract Manufacturing Market at Clinical Scale: Historical Trends (Since 2022) and Forecasted Estimates (Till 2035)
- 23.3.2. Antibody Contract Manufacturing Market at Commercial Scale: Historical Trends (Since 2022) and Forecasted Estimates (Till 2035)
- 23.4. Data Triangulation and Validation
24. ANTIBODY CONTRACT MANUFACTURING MARKET, BY GEOGRAPHICAL REGIONS
- 24.1. Chapter Overview
- 24.2. Key Assumptions and Methodology
- 24.3. Antibody Contract Manufacturing Market: Distribution by Key Geographical Regions
- 24.3.1. Antibody Contract Manufacturing Market in North America: Historical Trends (Since 2022) and Forecasted Estimates (Till 2035)
- 24.3.1.1. Antibody Contract Manufacturing Market in the US: Historical Trends (Since 2022) and Forecasted Estimates (Till 2035)
- 24.3.1.2. Antibody Contract Manufacturing Market in Canada: Historical Trends (Since 2022) and Forecasted Estimates (Till 2035)
- 24.3.1.3. Antibody Contract Manufacturing Market in Puerto Rico: Historical Trends (Since 2022) and Forecasted Estimates (Till 2035)
- 24.3.2. Antibody Contract Manufacturing Market in Europe: Historical Trends (Since 2022) and Forecasted Estimates (Till 2035)
- 24.3.2.1. Antibody Contract Manufacturing Market in Germany: Historical Trends (Since 2022) and Forecasted Estimates (Till 2035)
- 24.3.2.2. Antibody Contract Manufacturing Market in the UK: Historical Trends (Since 2022) and Forecasted Estimates (Till 2035)
- 24.3.2.3. Antibody Contract Manufacturing Market in France: Historical Trends (Since 2022) and Forecasted Estimates (Till 2035)
- 24.3.2.4. Antibody Contract Manufacturing Market in Spain: Historical Trends (Since 2022) and Forecasted Estimates (Till 2035)
- 24.3.2.5. Antibody Contract Manufacturing Market in Italy: Historical Trends (Since 2022) and Forecasted Estimates (Till 2035)
- 24.3.2.6. Antibody Contract Manufacturing Market in Rest of Europe: Historical Trends (Since 2022) and Forecasted Estimates (Till 2035)
- 24.3.3. Antibody Contract Manufacturing Market in Asia-Pacific: Historical Trends (Since 2022) and Forecasted Estimates (Till 2035)
- 24.3.3.1. Antibody Contract Manufacturing Market in China: Historical Trends (Since 2022) and Forecasted Estimates (Till 2035)
- 24.3.3.2. Antibody Contract Manufacturing Market in South Korea: Historical Trends (Since 2022) and Forecasted Estimates (Till 2035)
- 24.3.3.3. Antibody Contract Manufacturing Market in Japan: Historical Trends (Since 2022) and Forecasted Estimates (Till 2035)
- 24.3.3.4. Antibody Contract Manufacturing Market in Singapore: Historical Trends (Since 2022) and Forecasted Estimates (Till 2035)
- 24.3.3.5. Antibody Contract Manufacturing Market in Rest of Asia-Pacific: Historical Trends (Since 2022) and Forecasted Estimates (Till 2035)
- 24.3.4. Antibody Contract Manufacturing Market in Rest of the World: Historical Trends (Since 2022) and Forecasted Estimates (Till 2035)
- 24.3.4.1. Antibody Contract Manufacturing Market in Israel: Historical Trends (Since 2022) and Forecasted Estimates (Till 2035)
- 24.3.4.2. Antibody Contract Manufacturing Market in Argentina: Historical Trends (Since 2022) and Forecasted Estimates (Till 2035)
- 24.3.4.3. Antibody Contract Manufacturing Market in Africa: Historical Trends (Since 2022) and Forecasted Estimates (Till 2035)
- 24.3.1. Antibody Contract Manufacturing Market in North America: Historical Trends (Since 2022) and Forecasted Estimates (Till 2035)
- 24.4. Market Dynamics Assessment
- 24.4.1. Market Movement Analysis
- 24.4.2. Penetration-Growth (P-G) Matrix
- 24.5. Data Triangulation and Validation
25. SWOT ANALYSIS
- 25.1. Chapter Overview
- 25.2. Strengths
- 25.3. Weaknesses
- 25.4. Opportunities
- 25.5. Threats
- 25.6. Comparison of SWOT Factors
- 25.7. Concluding Remarks
26. FUTURE OF THE ANTIBODY CMO MARKET
- 26.1. Chapter Overview
- 26.2. Rise in Outsourcing Activity
- 26.3. Shift from One-time Contractual Engagements to Strategic Partnerships
- 26.4. Adoption of New and Innovative Technologies
- 26.4.1. Single-use Bioreactors
- 26.4.2. Bioprocess Automation
- 26.4.3. Other Technologies
- 26.5. Growing Biosimilars Market to Contribute to the Growth of the Contract Services Segment
- 26.6. Capability Expansions by CMOs to become One Stop Shops
- 26.7. Offshoring Outsourcing Activities to Maximize Profits and Expand Existing Capacities
- 26.8. Challenges Faced by both Sponsors and Service Providers
- 26.9. Future Outlook
27. CONCLUDING REMARKS
28. EXECUTIVE INSIGHTS
29. APPENDIX 1: TABULATED DATA
30. APPENDIX 2: LIST OF COMPANIES AND ORGANIZATIONS
List of Tables
- Table 6.1 Key Features of Antibody Isotypes
- Table 6.2 Mechanism of Action of Therapeutic Antibodies against Different Target Classes
- Table 6.3 List of Approved Monoclonal Antibodies
- Table 6.4 Difference between Polyclonal and Monoclonal Antibodies
- Table 7.1 List of Antibody Contract Manufacturers: Information on Year of Establishment, Company Size, Location of Headquarters, Number and Location of Facilities
- Table 7.2 List of Antibody Contract Manufacturers: Information on Scale of Operation
- Table 7.3 List of Antibody Contract Manufacturers: Information on Fill / Finish Services Offered, Type of Antibody Manufactured and Type of Expression System
- Table 8.1 Company Competitiveness Analysis: Antibody Contract Manufacturers based in North America
- Table 8.2 Company Competitiveness Analysis: Antibody Contract Manufacturers based in Europe
- Table 8.3 Company Competitiveness Analysis: Antibody Contract Manufacturers based in Asia-Pacific and Rest of the World
- Table 9.1 Antibody Contract Manufacturers: List of Companies Profiled
- Table 9.2 AGC Biologics: Company Overview
- Table 9.3 AGC Biologics: Service Portfolio
- Table 9.4 AGC Biologics: Recent Developments and Future Outlook
- Table 9.5 Aldevron: Company Overview
- Table 9.6 Aldevron: Service Portfolio
- Table 9.7 Axplora (Formerly Novasep): Company Overview
- Table 9.8 Axplora (Formerly Novasep): Service Portfolio
- Table 9.9 Axplora (Formerly Novasep): Recent Developments and Future Outlook
- Table 9.10 Emergent BioSolutions: Company Overview
- Table 9.11 Emergent BioSolutions: Service Portfolio
- Table 9.12 Emergent BioSolutions: Recent Developments and Future Outlook
- Table 9.13 Eurofins: Company Overview
- Table 9.14 Eurofins: Service Portfolio
- Table 9.15 FUJIFILM Biotechnologies: Company Overview
- Table 9.16 FUJIFILM Biotechnologies: Service Portfolio
- Table 9.17 FUJIFILM Biotechnologies: Recent Developments and Future Outlook
- Table 9.18 KBI Biopharma: Company Overview
- Table 9.19 KBI Biopharma: Service Portfolio
- Table 9.20 KBI Biopharma: Recent Developments and Future Outlook
- Table 9.21 Lonza: Company Overview
- Table 9.22 Lonza: Service Portfolio
- Table 9.23 Lonza: Recent Developments and Future Outlook
- Table 9.24 Nitto Avecia Pharma Services: Company Overview
- Table 9.25 Nitto Avecia Pharma Services: Service Portfolio
- Table 9.26 Nitto Avecia Pharma Services: Recent Developments and Future Outlook
- Table 9.27 Samsung Biologics: Company Overview
- Table 9.28 Samsung Biologics: Service Portfolio
- Table 9.29 Samsung Biologics: Recent Developments and Future Outlook
- Table 9.30 Thermo Fisher Scientific: Company Overview
- Table 9.31 Thermo Fisher Scientific: Service Portfolio
- Table 9.32 Thermo Fisher Scientific: Recent Developments and Future Outlook
- Table 10.1 Antibody Contract Manufacturers: List of Companies Profiled
- Table 10.2 ABL: Company Overview
- Table 10.3 ABL: Service Portfolio
- Table 10.4 Absolute Antibody: Company Overview
- Table 10.5 Absolute Antibody: Service Portfolio
- Table 10.6 Abzena: Company Overview
- Table 10.7 Abzena: Service Portfolio
- Table 10.8 Allele Biotechnology & Pharmaceuticals: Company Overview
- Table 10.9 Allele Biotechnology & Pharmaceuticals: Service Portfolio
- Table 10.10 Alvotech: Company Overview
- Table 10.11 Alvotech: Service Portfolio
- Table 10.12 Antibody Production Services: Company Overview
- Table 10.13 Antibody Production Services: Service Portfolio
- Table 10.14 Arabio: Company Overview
- Table 10.15 Arabio: Service Portfolio
- Table 10.16 Bharat Serums and Vaccines: Company Overview
- Table 10.17 Bharat Serums and Vaccines: Service Portfolio
- Table 10.18 Boehringer Ingelheim: Company Overview
- Table 10.19 Boehringer Ingelheim: Service Portfolio
- Table 10.20 Glenmark Pharmaceuticals: Company Overview
- Table 10.21 Glenmark Pharmaceuticals: Service Portfolio
- Table 10.22 MilliporeSigma: Company Overview
- Table 10.23 MilliporeSigma: Service Portfolio
- Table 10.24 Siam Bioscience: Company Overview
- Table 10.25 Siam Bioscience: Service Portfolio
- Table 11.1 Comparison of Strengths and Weaknesses of Small Molecules and Biologics
- Table 11.2 Comparison of Development Characteristics of Small Molecules and Biologics
- Table 12.1 Antibody Contract Manufacturing: List of Partnerships and Collaborations
- Table 12.2 Partnerships and Collaborations: Information on Location of Headquarters (Country and Region) and Type of Agreement (Country and Region)
- Table 13.1 Antibody Contract Manufacturing: List of Expansions
- Table 13.2 Antibody Contract Manufacturing Expansions: Information on Type of Antibodies
- Table 14.1 Capacity Analysis: Average Capacity / Facility (in liters): Sample Data Set
- Table 14.2 Antibody Contract Manufacturers: Information on Total Capacity
- Table 16.1 Growth Drivers: Market Impact and Time Period
- Table 16.2 Growth Restraints: Market Impact and Time Period
- Table 16.3 Growth Opportunities: Market Impact and Time Period
- Table 16.4 Growth Challenges: Market Impact and Time Period
- Table 25.1 Company A: Company Snapshot
- Table 25.2 Company B: Company Snapshot
- Table 25.3 Company C: Company Snapshot
- Table 25.4 Company D: Company Snapshot
- Table 25.5 Company E: Company Snapshot
- Table 25.6 Company F: Company Snapshot
- Table 29.1 Antibody Contract Manufacturers: Distribution by Year of Establishment
- Table 29.2 Antibody Contract Manufacturers: Distribution by Company Size
- Table 29.3 Antibody Contract Manufacturers: Distribution by Location of Headquarters (Region)
- Table 29.4 Antibody Contract Manufacturers: Distribution by Location of Headquarters (Country)
- Table 29.5 Antibody Contract Manufacturers: Distribution by Location of Antibody Contract Manufacturing Facilities
- Table 29.6 Antibody Contract Manufacturers: Distribution by Scale of Operation
- Table 29.7 Antibody Contract Manufacturers: Distribution by Type of Antibody Manufactured
- Table 29.8 Antibody Contract Manufacturers: Distribution by Type of Expression System Used
- Table 29.9 Antibody Contract Manufacturers: Distribution by Fill / Finish Services Offered
- Table 29.10 Partnerships and Collaborations: Quarterly Trend of Partnerships
- Table 29.11 Small Molecules and Biologics: Historical Trend of FDA Approval
- Table 29.12 Partnerships and Collaborations: Distribution by Type of Partnership
- Table 29.13 Partnerships and Collaborations: Distribution by Quarterly Trend and Type of Partnership
- Table 29.14 Most Active Players: Distribution by Number of Partnerships
- Table 29.15 Partnerships and Collaborations: Local and International Agreements
- Table 29.16 Partnerships and Collaborations: Intracontinental and Intercontinental Agreements
- Table 29.17 Recent Expansions: Quarterly Trend of Expansions
- Table 29.18 Recent Expansions: Distribution by Type of Expansion
- Table 29.19 Recent Expansions: Distribution by Quarterly Trend and Type of Expansion
- Table 29.20 Recent Expansions: Distribution by Location of Facility (Region)
- Table 29.21 Recent Expansions: Distribution by Location of Facility (Country)
- Table 29.22 Recent Expansions: Distribution by Type of Expansion and Location of Facility (Region)
- Table 29.23 Recent Expansions: Distribution of Amount Invested by Quarter of Expansion
- Table 29.24 Recent Expansions: Distribution of Amount Invested by Type of Expansion
- Table 29.25 Most Active Players: Distribution by Number of Expansions
- Table 29.26 Most Active Players: Distribution by Amount Invested (USD Million)
- Table 29.27 Capacity Analysis: Distribution by Company Size
- Table 29.28 Capacity Analysis: Distribution by Location of Manufacturing Facilities
- Table 29.29 Capacity Analysis: Distribution by Type of Expression System Used
- Table 29.30 Mammalian Capacity Analysis: Distribution by Company Size
- Table 29.31 Mammalian Capacity Analysis: Distribution by Location of Manufacturing Facilities
- Table 29.32 Microbial Capacity Analysis: Distribution by Company Size
- Table 29.33 Microbial Capacity Analysis: Distribution by Location of Manufacturing Facilities
- Table 29.34 Global Demand for Antibody Contract Manufacturing, Till 2035 (in Million Liters)
- Table 29.35 Demand for Antibody Contract Manufacturing: Distribution by Type of Antibody, Till 2035 (in Million Liters)
- Table 29.36 Demand for Antibody Contract Manufacturing: Distribution by Scale of Operation, Till 2035 (in Million Liters)
- Table 29.37 Demand for Antibody Contract Manufacturing: Distribution by Type of Manufacturer, Till 2035 (in Million Liters)
- Table 29.38 Demand for Antibody Contract Manufacturing: Distribution by Geographical Regions, Till 2035 (in Million Liters)
- Table 29.39 Global Antibody Contract Manufacturing Market, Historical Trends (Since 2022) and Forecasted Estimates (till 2035) (USD Billion)
- Table 29.40 Global Antibody Contract Manufacturing Market, Forecasted Estimates (till 2035): Conservative Scenario (USD Billion)
- Table 29.41 Global Antibody Contract Manufacturing Market, Forecasted Estimates (till 2035): Optimistic Scenario (USD Billion)
- Table 29.42 Antibody Contract Manufacturing Market: Distribution by Type of Antibody Manufactured (USD Billion)
- Table 29.43 Antibody Contract Manufacturing Market for Monoclonal Antibodies: Historical Trends (Since 2022) and Forecasted Estimates (till 2035): Conservative, Base and Optimistic Scenarios (USD Billion)
- Table 29.44 Antibody Contract Manufacturing Market for Bispecific Antibodies: Historical Trends (Since 2022) and Forecasted Estimates (till 2035): Conservative, Base and Optimistic Scenarios (USD Billion)
- Table 29.45 Antibody Contract Manufacturing Market: Distribution by Type of Product (USD Billion)
- Table 29.46 Antibody Contract Manufacturing Market for APIs: Historical Trends (Since 2022) and Forecasted Estimates (till 2035): Conservative, Base and Optimistic Scenarios (USD Billion)
- Table 29.47 Antibody Contract Manufacturing Market for FDFs: Historical Trends (Since 2022) and Forecasted Estimates (till 2035): Conservative, Base and Optimistic Scenarios (USD Billion)
- Table 29.48 Antibody Contract Manufacturing Market: Distribution by Scale of Operation (USD Billion)
- Table 29.49 Antibody Contract Manufacturing Market at Clinical Scale: Historical Trends (Since 2022) and Forecasted Estimates (till 2035): Conservative, Base and Optimistic Scenarios (USD Billion)
- Table 29.50 Antibody Contract Manufacturing Market at Commercial Scale: Historical Trends (Since 2022) and Forecasted Estimates (till 2035): Conservative, Base and Optimistic Scenarios (USD Billion)
- Table 29.51 Antibody Contract Manufacturing Market: Distribution by Type of Expression System Used (USD Billion)
- Table 29.52 Antibody Contract Manufacturing Market for Mammalian Expression Systems: Historical Trends (Since 2022) and Forecasted Estimates (till 2035): Conservative, Base and Optimistic Scenarios (USD Billion)
- Table 29.53 Antibody Contract Manufacturing Market for Microbial Expression Systems: Historical Trends (Since 2022) and Forecasted Estimates (till 2035): Conservative, Base and Optimistic Scenarios (USD Billion)
- Table 29.54 Antibody Contract Manufacturing Market: Distribution by Therapeutic Area
- Table 29.55 Antibody Contract Manufacturing Market for Oncological Disorders, Historical Trends (Since 2022) and Forecasted Estimates (till 2035): Conservative, Base and Optimistic Scenarios (USD Billion)
- Table 29.56 Antibody Contract Manufacturing Market for Cardiovascular Disorders, Historical Trends (Since 2022) and Forecasted Estimates (till 2035): Conservative, Base and Optimistic Scenarios (USD Billion)
- Table 29.57 Antibody Contract Manufacturing Market for Metabolic Disorders, Historical Trends (Since 2022) and Forecasted Estimates (till 2035): Conservative, Base and Optimistic Scenarios (USD Billion)
- Table 29.58 Antibody Contract Manufacturing Market for Infectious Diseases, Historical Trends (Since 2022) and Forecasted Estimates (till 2035): Conservative, Base and Optimistic Scenarios (USD Billion)
- Table 29.59 Antibody Contract Manufacturing Market for Autoimmune Disorders, Historical Trends (Since 2022) and Forecasted Estimates (till 2035): Conservative, Base and Optimistic Scenarios (USD Billion)
- Table 29.60 Antibody Contract Manufacturing Market for Neurological Disorders, Historical Trends (Since 2022) and Forecasted Estimates (till 2035): Conservative, Base and Optimistic Scenarios (USD Billion)
- Table 29.61 Antibody Contract Manufacturing Market for Genetic Disorders, Historical Trends (Since 2022) and Forecasted Estimates (till 2035): Conservative, Base and Optimistic Scenarios (USD Billion)
- Table 29.62 Antibody Contract Manufacturing Market for Other Disorders, Historical Trends (Since 2022) and Forecasted Estimates (till 2035): Conservative, Base and Optimistic Scenarios (USD Billion)
- Table 29.63 Antibody Contract Manufacturing Market: Distribution by Company Size
- Table 29.64 Antibody Contract Manufacturing Market for Small Companies, Historical Trends (Since 2022) and Forecasted Estimates (till 2035): Conservative, Base and Optimistic Scenarios (USD Billion)
- Table 29.65 Antibody Contract Manufacturing Market for Mid-sized Companies, Historical Trends (Since 2022) and Forecasted Estimates (till 2035): Conservative, Base and Optimistic Scenarios (USD Billion)
- Table 29.66 Antibody Contract Manufacturing Market for Large and Very Large Companies, Historical Trends (Since 2022) and Forecasted Estimates (till 2035): Conservative, Base and Optimistic Scenarios (USD Billion)
- Table 29.67 Antibody Contract Manufacturing Market: Distribution by Geographical Regions
- Table 29.68 Antibody Contract Manufacturing Market in North America, Historical Trends (Since 2022) and Forecasted Estimates (till 2035): Conservative, Base and Optimistic Scenarios (USD Billion)
- Table 29.69 Antibody Contract Manufacturing Market in the US, Historical Trends (Since 2022) and Forecasted Estimates (till 2035): Conservative, Base and Optimistic Scenarios (USD Billion)
- Table 29.70 Antibody Contract Manufacturing Market in Canada, Historical Trends (Since 2022) and Forecasted Estimates (till 2035): Conservative, Base and Optimistic Scenarios (USD Billion)
- Table 29.71 Antibody Contract Manufacturing Market in Puerto Rico, Historical Trends (Since 2022) and Forecasted Estimates (till 2035): Conservative, Base and Optimistic Scenarios (USD Billion)
- Table 29.72 Antibody Contract Manufacturing Market in Europe, Historical Trends (Since 2022) and Forecasted Estimates (till 2035): Conservative, Base and Optimistic Scenarios (USD Billion)
- Table 29.73 Antibody Contract Manufacturing Market in Germany, Historical Trends (Since 2022) and Forecasted Estimates (till 2035): Conservative, Base and Optimistic Scenarios (USD Billion)
- Table 29.74 Antibody Contract Manufacturing Market in the UK, Historical Trends (Since 2022) and Forecasted Estimates (till 2035): Conservative, Base and Optimistic Scenarios (USD Billion)
- Table 29.75 Antibody Contract Manufacturing Market in France, Historical Trends (Since 2022) and Forecasted Estimates (till 2035): Conservative, Base and Optimistic Scenarios (USD Billion)
- Table 29.76 Antibody Contract Manufacturing Market in Spain, Historical Trends (Since 2022) and Forecasted Estimates (till 2035): Conservative, Base and Optimistic Scenarios (USD Billion)
- Table 29.77 Antibody Contract Manufacturing Market in Italy, Historical Trends (Since 2022) and Forecasted Estimates (till 2035): Conservative, Base and Optimistic Scenarios (USD Billion)
- Table 29.78 Antibody Contract Manufacturing Market in Rest of Europe, Historical Trends (Since 2022) and Forecasted Estimates (till 2035): Conservative, Base and Optimistic Scenarios (USD Billion)
- Table 29.79 Antibody Contract Manufacturing Market in Asia-Pacific, Historical Trends (Since 2022) and Forecasted Estimates (till 2035): Conservative, Base and Optimistic Scenarios (USD Billion)
- Table 29.80 Antibody Contract Manufacturing Market in China, Historical Trends (Since 2022) and Forecasted Estimates (till 2035): Conservative, Base and Optimistic Scenarios (USD Billion)
- Table 29.81 Antibody Contract Manufacturing Market in South Korea, Historical Trends (Since 2022) and Forecasted Estimates (till 2035): Conservative, Base and Optimistic Scenarios (USD Billion)
- Table 29.82 Antibody Contract Manufacturing Market in Japan, Historical Trends (Since 2022) and Forecasted Estimates (till 2035): Conservative, Base and Optimistic Scenarios (USD Billion)
- Table 29.83 Antibody Contract Manufacturing Market in Singapore, Historical Trends (Since 2022) and Forecasted Estimates (till 2035): Conservative, Base and Optimistic Scenarios (USD Billion)
- Table 29.84 Antibody Contract Manufacturing Market in Rest of Asia-Pacific, Historical Trends (Since 2022) and Forecasted Estimates (till 2035): Conservative, Base and Optimistic Scenarios (USD Billion)
- Table 29.85 Antibody Contract Manufacturing Market in Rest of the World, Historical Trends (Since 2022) and Forecasted Estimates (till 2035): Conservative, Base and Optimistic Scenarios (USD Billion)
- Table 29.86 Antibody Contract Manufacturing Market in Israel, Historical Trends (Since 2022) and Forecasted Estimates (till 2035): Conservative, Base and Optimistic Scenarios (USD Billion)
- Table 29.87 Antibody Contract Manufacturing Market in Argentina, Historical Trends (Since 2022) and Forecasted Estimates (till 2035): Conservative, Base and Optimistic Scenarios (USD Billion)
- Table 29.88 Antibody Contract Manufacturing Market in Africa, Historical Trends (Since 2022) and Forecasted Estimates (till 2035): Conservative, Base and Optimistic Scenarios (USD Billion)
List of Figures
- Figure 2.1 Research Methodology: Project Methodology
- Figure 2.2 Research Methodology: Data Sources for Secondary Research
- Figure 2.3 Research Methodology: Robust Quality Control
- Figure 3.1 Market Dynamics: Forecast Methodology
- Figure 3.2 Market Dynamics: Market Assessment Framework
- Figure 4.1 Lessons Learnt from Past Recessions
- Figure 5.1 Executive Summary: Market Landscape
- Figure 5.2 Executive Summary: Market Trends
- Figure 5.3 Executive Summary: Market Forecast and Opportunity Analysis
- Figure 6.1 Evolution Roadmap of Antibodies Domain
- Figure 6.2 Structure of Antibody
- Figure 6.3 Mechanism of Action of Antibodies
- Figure 6.4 Monoclonal Antibody Production
- Figure 6.5 Symmetric and Asymmetric Bispecific Antibodies
- Figure 6.6 Mechanism of Action of Bispecific Antibodies
- Figure 6.7 Polyclonal Antibody Production
- Figure 6.8 Applications of Polyclonal Antibodies
- Figure 6.9 Types of Third-Party Service Providers
- Figure 7.1 Antibody Contract Manufacturers: Distribution by Year of Establishment
- Figure 7.2 Antibody Contract Manufacturers: Distribution by Company Size
- Figure 7.3 Antibody Contract Manufacturers: Distribution by Location of Headquarters (Region)
- Figure 7.4 Antibody Contract Manufacturers: Distribution by Location of Headquarters (Country)
- Figure 7.5 Antibody Contract Manufacturers: Distribution by Location of Antibody Contract Manufacturing Facilities
- Figure 7.6 Antibody Contract Manufacturers: Distribution by Scale of Operation
- Figure 7.7 Antibody Contract Manufacturers: Distribution by Type of Antibody Manufactured
- Figure 7.8 Antibody Contract Manufacturers: Distribution by Type of Expression System Used
- Figure 7.9 Antibody Contract Manufacturers: Distribution by Fill / Finish Services Offered
- Figure 8.1 Company Competitiveness Analysis: Antibody Contract Manufacturers based in North America
- Figure 8.2 Company Competitiveness Analysis: Antibody Contract Manufacturers based in Europe
- Figure 8.3 Company Competitiveness Analysis: Antibody Contract Manufacturers based in Asia-Pacific and Rest of the World
- Figure 11.1 Small Molecules and Biologics: Historical Trend of FDA Approval
- Figure 11.2 Comparison of Key Characteristics of Small Molecules and Biologics
- Figure 11.3 Comparison of Manufacturing Processes of Small Molecules and Biologics
- Figure 12.1 Partnerships and Collaborations: Quarterly Trend of Partnerships
- Figure 12.2 Partnerships and Collaborations: Distribution by Type of Partnership
- Figure 12.3 Partnerships and Collaborations: Distribution by Quarterly Trend and Type of Partnership
- Figure 12.4 Most Active Players: Distribution by Number of Partnerships
- Figure 12.5 Partnerships and Collaborations: Local and International Agreements
- Figure 12.6 Partnerships and Collaborations: Intracontinental and Intercontinental Agreements
- Figure 13.1 Recent Expansions: Quarterly Trend of Expansions
- Figure 13.2 Recent Expansions: Distribution by Type of Expansion
- Figure 13.3 Recent Expansions: Distribution by Quarterly Trend and Type of Expansion
- Figure 13.4 Recent Expansions: Distribution by Location of Facility (Region)
- Figure 13.5 Recent Expansions: Distribution by Location of Facility (Country)
- Figure 13.6 Recent Expansions: Distribution by Type of Expansion and Location of Facility (Region)
- Figure 13.7 Recent Expansions: Distribution of Amount Invested by Quarter of Expansion
- Figure 13.8 Recent Expansions: Distribution of Amount Invested by Type of Expansion
- Figure 13.9 Most Active Players: Distribution by Number of Expansions
- Figure 13.10 Most Active Players: Distribution by Amount Invested (USD Million)
- Figure 14.1 Capacity Analysis: Distribution by Company Size
- Figure 14.2 Capacity Analysis: Distribution by Location of Manufacturing Facilities
- Figure 14.3 Capacity Analysis: Distribution by Type of Expression System Used
- Figure 14.4 Mammalian Capacity Analysis: Distribution by Company Size
- Figure 14.5 Mammalian Capacity Analysis: Distribution by Location of Manufacturing Facilities
- Figure 14.6 Microbial Capacity Analysis: Distribution by Company Size
- Figure 14.7 Microbial Capacity Analysis: Distribution by Location of Manufacturing Facilities
- Figure 15.1 Global Demand for Antibody Contract Manufacturing, Till 2035 (in Million Liters)
- Figure 15.2 Demand for Antibody Contract Manufacturing: Distribution by Type of Antibody, Till 2035 (in Million Liters)
- Figure 15.3 Demand for Antibody Contract Manufacturing: Distribution by Scale of Operation, Till 2035 (in Million Liters)
- Figure 15.4 Demand for Antibody Contract Manufacturing: Distribution by Type of Manufacturer, Till 2035 (in Million Liters)
- Figure 15.5 Demand for Antibody Contract Manufacturing: Distribution by Geographical Regions, Till 2035 (in Million Liters)
- Figure 17.1 Global Antibody Contract Manufacturing Market, Historical Trends (Since 2022) and Forecasted Estimates (till 2035) (USD Billion)
- Figure 17.2 Global Antibody Contract Manufacturing Market, Forecasted Estimates (till 2035): Conservative Scenario (USD Billion)
- Figure 17.3 Global Antibody Contract Manufacturing Market, Forecasted Estimates (till 2035): Optimistic Scenario (USD Billion)
- Figure 18.1 Antibody Contract Manufacturing Market: Distribution by Type of Antibody Manufactured (USD Billion)
- Figure 18.2 Antibody Contract Manufacturing Market for Monoclonal Antibodies: Historical Trends (Since 2022) and Forecasted Estimates (till 2035) (USD Billion)
- Figure 18.3 Antibody Contract Manufacturing Market for Bispecific Antibodies: Historical Trends (Since 2022) and Forecasted Estimates (till 2035) (USD Billion)
- Figure 19.1 Antibody Contract Manufacturing Market: Distribution by Type of Product (USD Billion)
- Figure 19.2 Antibody Contract Manufacturing Market for APIs: Historical Trends (Since 2022) and Forecasted Estimates (till 2035) (USD Billion)
- Figure 19.3 Antibody Contract Manufacturing Market for FDFs: Historical Trends (Since 2022) and Forecasted Estimates (till 2035) (USD Billion)
- Figure 20.1 Antibody Contract Manufacturing Market: Distribution by Scale of Operation (USD Billion)
- Figure 20.2 Antibody Contract Manufacturing Market at Clinical Scale: Historical Trends (Since 2022) and Forecasted Estimates (till 2035) (USD Billion)
- Figure 20.3 Antibody Contract Manufacturing Market at Commercial Scale: Historical Trends (Since 2022) and Forecasted Estimates (till 2035) (USD Billion)
- Figure 21.1 Antibody Contract Manufacturing Market: Distribution by Type of Expression System Used (USD Billion)
- Figure 21.2 Antibody Contract Manufacturing Market for Mammalian Expression Systems: Historical Trends (Since 2022) and Forecasted Estimates (till 2035) (USD Billion)
- Figure 21.3 Antibody Contract Manufacturing Market for Microbial Expression Systems: Historical Trends (Since 2022) and Forecasted Estimates (till 2035) (USD Billion)
- Figure 22.1 Antibody Contract Manufacturing Market: Distribution by Therapeutic Area
- Figure 22.2 Antibody Contract Manufacturing Market for Oncological Disorders, Historical Trends (Since 2022) and Forecasted Estimates (till 2035) (USD Billion)
- Figure 22.3 Antibody Contract Manufacturing Market for Cardiovascular Disorders, Historical Trends (Since 2022) and Forecasted Estimates (till 2035) (USD Billion)
- Figure 22.4 Antibody Contract Manufacturing Market for Metabolic Disorders, Historical Trends (Since 2022) and Forecasted Estimates (till 2035) (USD Billion)
- Figure 22.5 Antibody Contract Manufacturing Market for Infectious Diseases, Historical Trends (Since 2022) and Forecasted Estimates (till 2035) (USD Billion)
- Figure 22.6 Antibody Contract Manufacturing Market for Autoimmune Disorders, Historical Trends (Since 2022) and Forecasted Estimates (till 2035) (USD Billion)
- Figure 22.7 Antibody Contract Manufacturing Market for Neurological Disorders, Historical Trends (Since 2022) and Forecasted Estimates (till 2035) (USD Billion)
- Figure 22.8 Antibody Contract Manufacturing Market for Genetic Disorders, Historical Trends (Since 2022) and Forecasted Estimates (till 2035) (USD Billion)
- Figure 22.9 Antibody Contract Manufacturing Market for Other Disorders, Historical Trends (Since 2022) and Forecasted Estimates (till 2035) (USD Billion)
- Figure 23.1 Antibody Contract Manufacturing Market: Distribution by Company Size
- Figure 23.2 Antibody Contract Manufacturing Market for Small Companies, Historical Trends (Since 2022) and Forecasted Estimates (till 2035) (USD Billion)
- Figure 23.3 Antibody Contract Manufacturing Market for Mid-sized Companies, Historical Trends (Since 2022) and Forecasted Estimates (till 2035) (USD Billion)
- Figure 23.4 Antibody Contract Manufacturing Market for Large and Very Large Companies, Historical Trends (Since 2022) and Forecasted Estimates (till 2035) (USD Billion)
- Figure 24.1 Antibody Contract Manufacturing Market: Distribution by Geographical Regions
- Figure 24.2 Antibody Contract Manufacturing Market in North America, Historical Trends (Since 2022) and Forecasted Estimates (till 2035) (USD Billion)
- Figure 24.3 Antibody Contract Manufacturing Market in the US, Historical Trends (Since 2022) and Forecasted Estimates (till 2035) (USD Billion)
- Figure 24.4 Antibody Contract Manufacturing Market in Canada, Historical Trends (Since 2022) and Forecasted Estimates (till 2035) (USD Billion)
- Figure 24.5 Antibody Contract Manufacturing Market in Puerto Rico, Historical Trends (Since 2022) and Forecasted Estimates (till 2035) (USD Billion)
- Figure 24.6 Antibody Contract Manufacturing Market in Europe, Historical Trends (Since 2022) and Forecasted Estimates (till 2035) (USD Billion)
- Figure 24.7 Antibody Contract Manufacturing Market in Germany, Historical Trends (Since 2022) and Forecasted Estimates (till 2035) (USD Billion)
- Figure 24.8 Antibody Contract Manufacturing Market in the UK, Historical Trends (Since 2022) and Forecasted Estimates (till 2035) (USD Billion)
- Figure 24.9 Antibody Contract Manufacturing Market in France, Historical Trends (Since 2022) and Forecasted Estimates (till 2035) (USD Billion)
- Figure 24.10 Antibody Contract Manufacturing Market in Spain, Historical Trends (Since 2022) and Forecasted Estimates (till 2035) (USD Billion)
- Figure 24.11 Antibody Contract Manufacturing Market in Italy, Historical Trends (Since 2022) and Forecasted Estimates (till 2035) (USD Billion)
- Figure 24.12 Antibody Contract Manufacturing Market in Rest of Europe, Historical Trends (Since 2022) and Forecasted Estimates (till 2035) (USD Billion)
- Figure 24.13 Antibody Contract Manufacturing Market in Asia-Pacific, Historical Trends (Since 2022) and Forecasted Estimates (till 2035) (USD Billion)
- Figure 24.14 Antibody Contract Manufacturing Market in China, Historical Trends (Since 2022) and Forecasted Estimates (till 2035) (USD Billion)
- Figure 24.15 Antibody Contract Manufacturing Market in South Korea, Historical Trends (Since 2022) and Forecasted Estimates (till 2035) (USD Billion)
- Figure 24.16 Antibody Contract Manufacturing Market in Japan, Historical Trends (Since 2022) and Forecasted Estimates (till 2035) (USD Billion)
- Figure 24.17 Antibody Contract Manufacturing Market in Singapore, Historical Trends (Since 2022) and Forecasted Estimates (till 2035) (USD Billion)
- Figure 24.18 Antibody Contract Manufacturing Market in Rest of Asia-Pacific, Historical Trends (Since 2022) and Forecasted Estimates (till 2035) (USD Billion)
- Figure 24.19 Antibody Contract Manufacturing Market in Rest of the World, Historical Trends (Since 2022) and Forecasted Estimates (till 2035) (USD Billion)
- Figure 24.20 Antibody Contract Manufacturing Market in Israel, Historical Trends (Since 2022) and Forecasted Estimates (till 2035) (USD Billion)
- Figure 24.21 Antibody Contract Manufacturing Market in Argentina, Historical Trends (Since 2022) and Forecasted Estimates (till 2035) (USD Billion)
- Figure 24.22 Antibody Contract Manufacturing Market in Africa, Historical Trends (Since 2022) and Forecasted Estimates (till 2035) (USD Billion)
- Figure 24.23 Market Movement Analysis: Geographical Regions
- Figure 24.24 Penetration-Growth (P-G) Matrix: Geographical Regions
- Figure 25.1 Antibody Contract Manufacturing: SWOT Analysis
- Figure 25.2 Comparison of SWOT Factors: Harvey Ball Analysis
- Figure 27.1 Concluding Remarks: Overall Market Landscape
- Figure 27.2 Concluding Remarks: Partnerships and Collaborations
- Figure 27.3 Concluding Remarks: Recent Expansions
- Figure 27.4 Concluding Remarks: Capacity Analysis
- Figure 27.5 Concluding Remarks: Demand Analysis
- Figure 27.6 Concluding Remarks: Market Forecast and Opportunity Analysis (I/II)
- Figure 27.7 Concluding Remarks: Market Forecast and Opportunity Analysis (II/II)
 抗體契約製造市場:2026-2032年全球市場預測(依服務類型、抗體類型、表現系統、製程階段、業務規模、抗體形式、外包模式、合約類型、治療領域、最終用途及客戶類型分類)
 抗體受託製造的全球市場,規模,佔有率,趨勢,產業分析報告:各產品,來歷,各治療領域,各終端用戶,各地區 - 市場預測,2025年~2034年
 雙特異性抗體治療合約製造市場-全球產業規模、佔有率、趨勢、機會和預測(按適應症、給藥途徑、最終用途、地區和競爭細分,2020-2030 年預測)
 抗體契約製造市場規模、佔有率、趨勢分析報告:按產品、原產地、最終用途、地區、細分市場預測,2025-2030