


 |
市場調查報告書
商品編碼
1993593
澳洲藥物輸送設備市場:產業趨勢與預測(至 2035 年)-依產品類型、應用領域和最終用戶劃分Australia Drug Delivery Devices Market: Industry Trends and Global Forecasts, till 2035 - Distribution by Type of Product, Application Area and End-user |
||||||
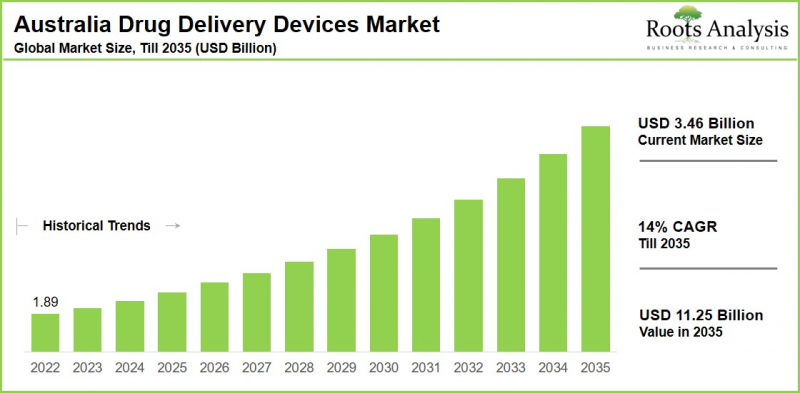
澳洲藥物輸送設備市場預計將從目前的 34.6 億美元增長至 2035 年的 112.5 億美元,預計在 2035 年之前的預測期內,複合年增長率 (CAGR) 為 14%。
澳洲藥物傳輸設備市場:成長與趨勢
藥物傳輸設備用於治療多種疾病,包括氣喘、慢性阻塞性肺病 (COPD)、糖尿病、癌症、心血管疾病和慢性疼痛。 這些設備能夠實現精準給藥。藥物傳遞技術旨在提高療效和患者依從性,同時減少副作用。近年來,藥物輸送裝置的研發重點集中在智慧連接、奈米技術和標靶釋放等方面,從而提高了患者的依從性並實現了精準給藥。 由於糖尿病等慢性疾病的盛行率不斷上升,以及人口老化導致心血管疾病和自體免疫疾病的增加,澳洲藥物輸送裝置市場呈現穩定成長的態勢。這些因素推動了對精準易用裝置的需求,例如注射器、吸入器、緩釋植入劑和自動注射器。此外,互聯智能自動注射器、可實現無痛透皮給藥的微針貼片、可生物降解的植入劑、用於實時給藥的人工智能可穿戴泵以及無針給藥系統等技術進步,在提高藥物依從性和療效的同時,也為澳大利亞的數位健康戰略和居家護理項目提供了支持,所有這些都在推動澳大利亞藥物輸送裝置市場的增長。
成長驅動因素:市場擴張的策略推動力
澳洲藥物輸送設備市場由多個相互關聯的成長驅動因素所驅動,反映了廣泛的人口結構、技術和政策變化。此外,慢性病、癌症和心血管疾病的日益普遍,推動了對高效、標靶給藥系統(例如自動注射器和緩釋植入物)的需求激增,這些系統能夠改善患者預後並降低住院率。智慧互聯吸入器、用於增強透皮吸收的微針貼片、用於最大限度減少錯誤的預充式註射器以及用於即時監測的整合人工智慧的可穿戴泵等技術進步,正在與澳洲的數位健康生態系統相協調,從而提高患者的用藥依從性和療效。政府透過各項措施、對醫療基礎設施的投資以及促進遠距醫療的政策,進一步加速了該地區藥物輸送設備的普及應用。
市場挑戰:阻礙發展的重大障礙
儘管市場條件有利,仍面臨許多阻礙擴張和市場准入的重大挑戰。澳洲藥品管理局 (TGA) 的嚴格監管導致審批流程漫長且成本高昂。對於 III 類醫療器械,審批費用通常超過 95,000 澳元,而分階段實施合規措施直至 2026 年,這給創新者設置了障礙,延緩了產品上市。開發和取得先進技術的高昂成本限制了產品的可負擔性和可近性,尤其是在農村地區。此外,諸如藥品福利計劃 (PBS) 等方案下的報銷障礙也使新醫療器材的市場滲透變得更加複雜。來自貝克頓·迪金森和諾華等主要企業的激烈競爭,以及醫護人員和患者對減少不必要的穿刺事故等益處的認知不足,都導致了市場普及率緩慢。此外,供應鏈的脆弱性,例如Ozempic等GLP-1製劑持續短缺(預計持續到2025年),以及對專業化生產流程的需求,都增加了這個資本密集產業的風險。本報告分析了澳洲藥物輸送裝置市場,提供了市場規模估算、機會分析、競爭格局和公司概況等資訊。
目錄
第一章:引言
第二章:研究方法
第三章:市場動態
第四章:宏觀經濟指標
第五章:摘要整理
第六章:引言
第七章:市場概覽
第8章 企業簡介:澳洲的藥物輸送設備市場
- 章概要
- Becton Dickinson and Company
- SiBiono GeneTech
- Bayer
- Novartis
- GlaxoSmithKline
- Teva Pharmaceutical Industries
- AbbVie
- Novo Nordisk
- Johnson & Johnson
- Sanofi
- Viatris
- Pfizer
第 9 章:合作夥伴與聯盟
第 10 章:市場影響分析
第 11 章:澳洲給藥設備市場
第 12 章:澳洲給藥裝置市場:依產品類型
第 13 章:澳洲給藥設備市場:依應用分類區域
第十四章:澳洲藥物輸送設備市場:依最終用戶劃分
第十五章:結論
第十六章 附錄一:表格資料
第十七章 附錄二:公司與組織清單
Australia Drug Delivery Devices Market: Overview
As per Roots Analysis, the Australia drug delivery devices market is estimated to grow from USD 3.46 billion in the current year to USD 11.25 billion by 2035 at a CAGR of 14% during the forecast period, till 2035.
Australia Drug Delivery Devices Market: Growth and Trends
Drug delivery devices are utilized for a variety of conditions, including asthma, chronic obstructive pulmonary disease (COPD), diabetes, cancer, cardiovascular diseases, and chronic pain. These devices facilitate accurate and focused administration of medications, enhancing effectiveness and patient adherence while reducing adverse effects. Recent advancements in drug delivery devices focus on smart connectivity, nanotechnology, and targeted release for better patient compliance and precision dosing.
The market for drug delivery devices in Australia is showing consistent growth, driven by the increasing prevalence of chronic illnesses such as diabetes along with growing cardiovascular and autoimmune disorders in an aging demographic. Such factors elevate the need for accurate, user-friendly devices like injectables, inhalers, sustained-release implants, and auto-injectors. In addition, advancements in technology, such as smart auto-injectors with connectivity, microneedle patches for painless transdermal delivery, biodegradable implants, wearable pumps that use AI for real-time dosing, and needle-free systems, are enhancing adherence and effectiveness while supporting Australia's digital health strategy and home care programs, collectively promoting the growth of the drug delivery devices market in Australia.
Growth Drivers: Strategic Enablers of Market Expansion
Australia's drug delivery devices market is propelled by several interconnected growth drivers that reflect broader demographic, technological, and policy shifts. Further, the surging prevalence of chronic diseases, cancer and cardiovascular conditions creates acute demand for efficient, targeted delivery systems like auto-injectors and sustained-release implants to improve patient outcomes and reduce hospitalization rates. Technological advancements, including smart connected inhalers, microneedle patches enhancing transdermal absorption, pre-filled syringes minimizing errors, and AI-integrated wearable pumps for real-time monitoring, boost adherence and efficacy while aligning with Australia's digital health ecosystem. Government support through initiatives, investments in healthcare infrastructure, and policies promoting telemedicine further accelerate adoption of drug delivery devices in this region.
Market Challenges: Critical Barriers Impeding Progress
Despite these tailwinds, the market grapples with significant challenges that hinder expansion and market entry. Stringent Therapeutic Goods Administration (TGA) regulations impose lengthy, costly approval processes often exceeding AUD 95,000 for Class III devices with phased compliance rollouts into 2026 creating barriers for innovators and delaying product launches. High development and acquisition costs for advanced technologies limit affordability and accessibility, especially in rural areas, while reimbursement hurdles from schemes like the Pharmaceutical Benefits Scheme (PBS) complicate market penetration for novel devices. Intense competition from major players like Becton Dickinson and Novartis, coupled with low awareness among healthcare providers and patients about benefits like reduced needless-stick injuries, slows adoption rates. Additionally, supply chain vulnerabilities, as seen in ongoing GLP-1 shortages like Ozempic into 2025, and the need for specialized manufacturing heighten risks in this capital-intensive sector.
Australia Drug Delivery Devices Market: Key Segments
Type of Product
- Inhalers
- Injection Devices
- Transdermal Patches
Application Area
- Oncology
- Infectious Diseases
- Respiratory Diseases
- Diabetes
End User
- Hospitals
- Diagnostic Centers
- Home Care Settings
- Others
Example Players in the Australia Drug Delivery Devices Market
- AbbVie
- Bayer
- Becton Dickinson and Company
- GlaxoSmithKline
- Johnson & Johnson
- Novartis
- Novo Nordisk
- Pfizer
- Sanofi
- SiBiono GeneTech
- Teva Pharmaceutical Industries
- Viatris
Key Questions Answered in this Report
- How many drug delivery device developers in Australia are currently engaged in this market?
- Which are the leading companies in this market?
- Which country dominates the Australia drug delivery devices market?
- What are the key trends observed in the Australia drug delivery devices market?
- What factors are likely to influence the evolution of this market?
- What are the primary challenges faced by Australia drug delivery devices market?
- What is the current and future Australia drug delivery devices market size?
- What is the CAGR of Australia drug delivery devices market?
- How is the current and future market opportunity likely to be distributed across key market segments?
Reasons to Buy this Report
- The report provides a comprehensive market analysis, offering detailed revenue projections of the overall market and its specific sub-segments. This information is valuable to both established market leaders and emerging entrants.
- The report offers stakeholders a comprehensive overview of the market, including key drivers, barriers, opportunities, and challenges. This information empowers stakeholders to stay abreast of market trends and make data-driven decisions to capitalize on growth prospects.
- The report can aid businesses in identifying future opportunities in any sector. It also helps in understanding if those opportunities are worth pursuing.
- The report helps in identifying customer demand by understanding the needs, preferences, and behavior of the target audience in order to tailor products or services effectively.
- The report equips new entrants with requisite information regarding a particular market to help them build successful business strategies.
- The report allows for more effective communication with the audience and in building strong business relations.
Complementary Benefits
- Complimentary Excel Data Packs for all Analytical Modules in the Report
- 15% Free Content Customization
- Detailed Report Walkthrough Session with Research Team
- Free Updated report if the report is 6-12 months old or older
TABLE OF CONTENTS
1. PREFACE
- 1.1. Introduction
- 1.2. Market Share Insights
- 1.3. Key Market Insights
- 1.4. Report Coverage
- 1.5. Key Questions Answered
- 1.6. Chapter Outlines
2. RESEARCH METHODOLOGY
- 2.1. Chapter Overview
- 2.2. Research Assumptions
- 2.2.1. Market Landscape and Market Trends
- 2.2.2. Market Forecast and Opportunity Analysis
- 2.2.3. Comparative Analysis
- 2.3. Database Building
- 2.3.1. Data Collection
- 2.3.2. Data Validation
- 2.3.3. Data Analysis
- 2.4. Project Methodology
- 2.4.1. Secondary Research
- 2.4.1.1. Annual Reports
- 2.4.1.2. Academic Research Papers
- 2.4.1.3. Company Websites
- 2.4.1.4. Investor Presentations
- 2.4.1.5. Regulatory Filings
- 2.4.1.6. White Papers
- 2.4.1.7. Industry Publications
- 2.4.1.8. Conferences and Seminars
- 2.4.1.9. Government Portals
- 2.4.1.10. Media and Press Releases
- 2.4.1.11. Newsletters
- 2.4.1.12. Industry Databases
- 2.4.1.13. Roots Proprietary Databases
- 2.4.1.14. Paid Databases and Sources
- 2.4.1.15. Social Media Portals
- 2.4.1.16. Other Secondary Sources
- 2.4.2. Primary Research
- 2.4.2.1. Types of Primary Research
- 2.4.2.1.1. Qualitative Research
- 2.4.2.1.2. Quantitative Research
- 2.4.2.1.3. Hybrid Approach
- 2.4.2.2. Advantages of Primary Research
- 2.4.2.3. Techniques for Primary Research
- 2.4.2.3.1. Interviews
- 2.4.2.3.2. Surveys
- 2.4.2.3.3. Focus Groups
- 2.4.2.3.4. Observational Research
- 2.4.2.3.5. Social Media Interactions
- 2.4.2.4. Key Opinion Leaders Considered in Primary Research
- 2.4.2.4.1. Company Executives (CXOs)
- 2.4.2.4.2. Board of Directors
- 2.4.2.4.3. Company Presidents and Vice Presidents
- 2.4.2.4.4. Research and Development Heads
- 2.4.2.4.5. Technical Experts
- 2.4.2.4.6. Subject Matter Experts
- 2.4.2.4.7. Scientists
- 2.4.2.4.8. Doctors and Other Healthcare Providers
- 2.4.2.5. Ethics and Integrity
- 2.4.2.5.1. Research Ethics
- 2.4.2.5.2. Data Integrity
- 2.4.2.1. Types of Primary Research
- 2.4.3. Analytical Tools and Databases
- 2.4.1. Secondary Research
- 2.5. Robust Quality Control
3. MARKET DYNAMICS
- 3.1. Chapter Overview
- 3.2. Forecast Methodology
- 3.2.1. Top-down Approach
- 3.2.2. Bottom-up Approach
- 3.2.3. Hybrid Approach
- 3.3. Market Assessment Framework
- 3.3.1. Total Addressable Market (TAM)
- 3.3.2. Serviceable Addressable Market (SAM)
- 3.3.3. Serviceable Obtainable Market (SOM)
- 3.3.4. Currently Acquired Market (CAM)
- 3.4. Forecasting Tools and Techniques
- 3.4.1. Qualitative Forecasting
- 3.4.2. Correlation
- 3.4.3. Regression
- 3.4.4. Extrapolation
- 3.4.5. Convergence
- 3.4.6. Sensitivity Analysis
- 3.4.7. Scenario Planning
- 3.4.8. Data Visualization
- 3.4.9. Time Series Analysis
- 3.4.10. Forecast Error Analysis
- 3.5. Key Considerations
- 3.5.1. Demographics
- 3.5.2. Government Regulations
- 3.5.3. Reimbursement Scenarios
- 3.5.4. Market Access
- 3.5.5. Supply Chain
- 3.5.6. Industry Consolidation
- 3.5.7. Pandemic / Unforeseen Disruptions Impact
- 3.6. Limitations
4. MACRO-ECONOMIC INDICATORS
- 4.1. Chapter Overview
- 4.2. Market Dynamics
- 4.2.1. Time Period
- 4.2.1.1. Historical Trends
- 4.2.1.2. Current and Forecasted Estimates
- 4.2.2. Currency Coverage
- 4.2.2.1. Major Currencies Affecting the Market
- 4.2.2.2. Factors Affecting Currency Fluctuations on the Industry
- 4.2.2.3. Impact of Currency Fluctuations on the Industry
- 4.2.3. Foreign Currency Exchange Rate
- 4.2.3.1. Impact of Foreign Exchange Rate Volatility on the Market
- 4.2.3.2. Strategies for Mitigating Foreign Exchange Risk
- 4.2.4. Recession
- 4.2.4.1. Assessment of Current Economic Conditions and Potential Impact on the Market
- 4.2.4.2. Historical Analysis of Past Recessions and Lessons Learnt
- 4.2.5. Inflation
- 4.2.5.1. Measurement and Analysis of Inflationary Pressures in the Economy
- 4.2.5.2. Potential Impact of Inflation on the Market Evolution
- 4.2.6. Interest Rates
- 4.2.6.1. Interest Rates and Their Impact on the Market
- 4.2.6.2. Strategies for Managing Interest Rate Risk
- 4.2.7. Commodity Flow Analysis
- 4.2.7.1. Type of Commodity
- 4.2.7.2. Origins and Destinations
- 4.2.7.3. Value and Weights
- 4.2.7.4. Modes of Transportation
- 4.2.8. Global Trade Dynamics
- 4.2.8.1. Import Scenario
- 4.2.8.2. Export Scenario
- 4.2.8.3. Trade Policies
- 4.2.8.4. Strategies for Mitigating the Risks Associated with Trade Barriers
- 4.2.8.5. Impact of Trade Barriers on the Market
- 4.2.9. War Impact Analysis
- 4.2.9.1. Russian-Ukraine War
- 4.2.9.2. Israel-Hamas War
- 4.2.10. COVID Impact / Related Factors
- 4.2.10.1. Global Economic Impact
- 4.2.10.2. Industry-specific Impact
- 4.2.10.3. Government Response and Stimulus Measures
- 4.2.10.4. Future Outlook and Adaptation Strategies
- 4.2.11. Other Indicators
- 4.2.11.1. Fiscal Policy
- 4.2.11.2. Consumer Spending
- 4.2.11.3. Gross Domestic Product (GDP)
- 4.2.11.4. Employment
- 4.2.11.5. Taxes
- 4.2.11.6. Stock Market Performance
- 4.2.11.7. Cross-Border Dynamics
- 4.2.1. Time Period
- 4.3. Conclusion
5. EXECUTIVE SUMMARY
6. INTRODUCTION
- 6.1. Chapter Overview
- 6.2. Overview of Drug Delivery Devices
- 6.3. Key Design Features and Development Process
- 6.4. Classification of Connected / Smart Drug Delivery Devices
- 6.5. Type of Device
- 6.6. Regulatory Guidelines for Drug Delivery Devices
- 6.7. Advantages and Limitations of Drug Delivery Devices
- 6.8. Future Perspective
7. MARKET LANDSCAPE
- 7.1. Chapter Overview
- 7.2. Australia Drug Delivery Devices Market: Overall Market Landscape
- 7.2.1. Analysis by Year of Establishment
- 7.2.2. Analysis by Company Size
- 7.2.3. Analysis by Location of Headquarters
- 7.2.4. Analysis by Stage of Development
- 7.2.5. Analysis by Type of Device
- 7.2.6. Analysis by Therapeutic Area
8. COMPANY PROFILES: AUSTRALIA DRUG DELIVERY DEVICES MARKET
- 8.1. Chapter Overview
- 8.2. Becton Dickinson and Company
- 8.2.1. Company Overview
- 8.2.2. Product Portfolio
- 8.2.3. Financial Information
- 8.2.4. Recent Developments and Future Outlook
- 8.3. SiBiono GeneTech
- 8.4. Bayer
- 8.5. Novartis
- 8.6. GlaxoSmithKline
- 8.7. Teva Pharmaceutical Industries
- 8.8. AbbVie
- 8.9. Novo Nordisk
- 8.10. Johnson & Johnson
- 8.11. Sanofi
- 8.12. Viatris
- 8.13. Pfizer
9. PARTNERSHIPS AND COLLABORATIONS
- 9.1. Chapter Overview
- 9.2. Partnership Models
- 9.3. Australia Drug Delivery Devices Market: Partnerships and Collaborations
- 9.3.1. Analysis by Year of Partnership
- 9.3.2. Analysis by Type of Partnership
- 9.3.3. Most Active Players: Analysis by Number of Partnerships
- 9.3.4. Analysis by Geography
- 9.3.4.1. Intercontinental and Intracontinental Agreements
- 9.3.4.2. Local and International Agreements
10. MARKET IMPACT ANALYSIS
- 10.1. Chapter Overview
- 10.2. Market Drivers
- 10.3. Market Restraints
- 10.4. Market Opportunities
- 10.5. Market Challenges
- 10.6. Conclusion
11. AUSTRALIA DRUG DELIVERY DEVICES MARKET
- 11.1. Chapter Overview
- 11.2. Key Assumptions and Methodology
- 11.3. Australia Drug Delivery Devices Market: Historical Trends (Since 2023) and Forecasted Estimates (Till 2035)
- 11.4. Roots Analysis Perspective on Market Growth
- 11.5 Scenario Analysis
- 11.5.1. Conservative Scenario
- 11.5.2. Optimistic Scenario
- 11.6. Key Market Segmentations
12. AUSTRALIA DRUG DELIVERY DEVICES MARKET, BY TYPE OF PRODUCT
- 12.1. Chapter Overview
- 12.2. Key Assumptions and Methodology
- 12.3. Australia Drug Delivery Devices Market: Distribution by Type of Product
- 12.3.1. Inhalers, Historical Trends (Since 2023) and Forecasted (Till 2035)
- 12.3.2. Injection Devices, Historical Trends (Since 2023) and Forecasted Estimates (Till 2035)
- 12.3.3. Transdermal Patches, Historical Trends (Since 2023) and Forecasted Estimates (Till 2035)
- 12.4. Data Triangulation and Validation
13. AUSTRALIA DRUG DELIVERY DEVICES MARKET, BY APPLICATION AREA
- 13.1. Chapter Overview
- 13.2. Assumptions and Methodology
- 13.3. Australia Drug Delivery Devices Market: Distribution by Application Area
- 13.3.1 Oncology: Historical Trends (Since 2023) and Forecasted Estimates (Till 2035)
- 13.3.2. Infectious Diseases: Historical Trends (Since 2023) and Forecasted Estimates (Till 2035)
- 13.3.3. Respiratory Diseases: Historical Trends (Since 2023) and Forecasted Estimates (Till 2035)
- 13.3.4. Diabetes: Historical Trends (Since 2023) and Forecasted Estimates (Till 2035)
- 13.4. Data Triangulation and Validation
14. AUSTRALIA DRUG DELIVERY DEVICES MARKET, BY END USER
- 14.1. Chapter Overview
- 14.2. Assumptions and Methodology
- 14.3. Australia Drug Delivery Devices Market: Distribution by End User
- 14.3.1 Hospitals: Historical Trends (Since 2023) and Forecasted Estimates (Till 2035)
- 14.3.2. Surgery Centers / Clinics: Historical Trends (Since 2023) and Forecasted Estimates (Till 2035)
- 14.3.3. Home Care Settings: Historical Trends (Since 2023) and Forecasted Estimates (Till 2035)
- 14.3.4. Others: Historical Trends (Since 2023) and Forecasted Estimates (Till 2035)
- 14.4. Data Triangulation and Validation
15. CONCLUDING REMARKS
16. APPENDIX I: TABULATED DATA
17. APPENDIX II: LIST OF COMPANIES AND ORGANIZATIONS
 藥物和基因遞送裝置市場:按技術、裝置類型、分子類型、最終用戶、應用和治療領域分類——2026-2032年全球市場預測藥物輸送裝置市場:依產品類型、治療領域、最終用戶和通路分類-2026-2032年全球市場預測
 2026年全球藥物傳輸設備市場報告2026年全球藥物與基因遞送設備市場報告
 日本藥物輸送裝置市場報告(按給藥途徑、應用、最終用戶和地區分類,2026-2034年)
 藥物輸送裝置市場規模、佔有率和成長分析(按給藥途徑、應用、最終用途和地區分類)-2026-2033年產業預測
 全球藥物輸送裝置市場:依給藥途徑、應用、最終用戶和地區劃分 - 市場規模、行業趨勢、機會分析和預測(2026-2035 年)
 藥物輸送裝置市場規模、佔有率和趨勢分析報告:按產品、應用、最終用途、地區和細分市場預測(2026-2033 年)
 藥物輸送裝置市場-全球產業規模、佔有率、趨勢、機會和預測,按應用、給藥途徑、最終用戶、地區和競爭格局分類,2020-2030年預測
 藥物輸送裝置-市場趨勢、競爭格局與市場預測(2032 年)