


 |
市場調查報告書
商品編碼
1993586
超材料市場(至 2035 年):依超材料類型、產品形式、應用、企業規模、終端用戶產業和地區劃分:產業趨勢和全球預測Metamaterials Market, till 2035: Distribution by Type of Metamaterial, Product Form, Applications, Type of Enterprise, End Use Industry, and Geographical Regions: Industry Trends and Global Forecasts |
||||||
超材料市場展望
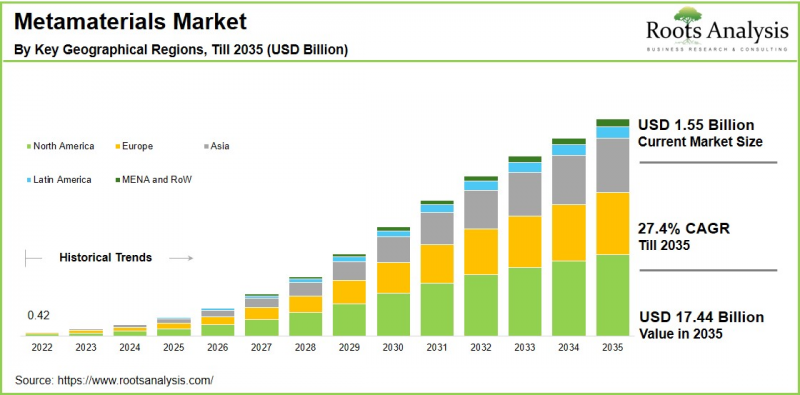
預計到 2035 年,全球超材料市場將以 27.4% 的複合年增長率增長,從目前的 15.5 億美元增長至 174.4 億美元。
自 1888 年問世以來,金屬一直是天線設計中的關鍵材料。然而,傳統金屬天線在跨多個頻段高效工作的能力有限,這通常會導致能量損失和性能受限。 為了克服這些局限性,業界已轉向開發專門用於操控電磁波(包括無線電波和可見光)的超材料。
超材料是透過週期性排列奈米級和微米級結構而製成的,這些結構具有獨特的波吸收、折射或偏轉特性。 其高精度、模組化架構和先進功能使其在汽車、航空航太和國防等領域中越來越廣泛的應用,這些領域對可控的高性能應用至關重要。此外,超材料能夠在很寬的頻段範圍內有效運作,使其特別適用於下一代無線通訊系統,包括 5G 和新興的 6G 網路。 超材料市場正在成為全球向創新和技術進步轉型以提高效率的重要驅動力。在超材料製造過程中使用各種原材料,進一步擴展了其功能,開闢了新的應用領域,並提升了其在多個高科技行業的戰略重要性。
高階主管策略洞察
推動超材料市場成長的關鍵市場驅動因素
超材料市場的成長主要受通訊、航太、國防和汽車產業對先進電磁波控制日益增長的需求所驅動。包括 5G 和新興的 6G 基礎設施在內的下一代無線網路的快速擴張,顯著加速了對能夠提高訊號強度、頻寬效率和天線小型化的高性能材料的需求。
此外,國防現代化計畫投資的增加也推動了超材料在雷達吸收和先進感測應用的應用。 在航空航太和汽車領域,輕量化、緊湊化和節能化零件的需求正進一步推動市場擴張。此外,奈米製造技術和材料科學的持續進步,以及研發活動的日益活躍,也促進了該市場的成長。
超材料市場:產業競爭格局
超材料市場是一個高度分散的市場,既有成熟的製造商,也有新興企業。老牌企業和新企業都在積極推動技術進步和市場擴張。尤其值得一提的是,超過70%的主要企業提供以超材料為基礎的產品,反映出這些先進材料的商業化進程正在不斷加速。 此外,這些公司中有 50% 為航空航天和國防工業提供產品,近 40% 的製造商為各種終端用戶行業提供基於超材料的天線和雷達。
超材料的演進:產業新趨勢
在超材料產業,材料科學、奈米製造和電磁工程的快速發展正在推動幾個新趨勢的湧現。 其中一個關鍵趨勢是將超材料越來越多地整合到下一代通訊系統中,特別是 5G 和 6G 網絡,以提高訊號效率並實現天線小型化。人們對可調諧和可編程超材料的興趣也日益濃厚,這類超材料能夠即時動態地控制電磁特性。這將有助於其在智慧感測器、自適應光學和先進成像系統等領域的擴展應用。此外,輕量化、小型和節能型組件的開發正在加速其在航空航太、國防和汽車產業的應用。
區域分析:亞太地區引領超材料市場
根據我們的分析,亞太地區今年將佔超材料市場最大的佔有率。這主要得益於該地區強大的製造業基礎、快速的技術應用以及對先進通訊和國防能力的持續投資。此外,該地區在5G部署方面處於領先地位,並積極推進下一代6G技術的研究,從而對能夠提升天線效率的高性能材料產生了顯著需求。中國、日本、韓國和印度等國家都受惠於其強大的半導體製造生態系統、政府主導的研發計畫以及不斷擴展的航空航太和國防計畫。此外,主要電子產品製造商的存在以及研究機構與產業參與者之間日益密切的合作,也進一步加速了該地區的商業化進程。
超材料市場面臨的主要挑戰
阻礙超材料應用的主要挑戰包括高昂的研發成本,以及奈米和微米尺度上複雜的設計和製造流程。此外,缺乏超材料產品的標準化測試框架和監管指南可能會減緩該市場的成長。終端用戶認知度低以及整合到現有系統中的複雜性也是限制其普及的因素。此外,先進原材料和專用製造設備的成本相對較高,尤其是在價格敏感型應用領域,這可能會限制市場成長。
超材料市場:主要市場區隔
超材料類型
- 電磁超材料
- 光學超材料
- 熱超材料
- 聲學超材料
- 其他超材料
產品形式
- 薄膜
- 塊體材料
應用
- 天線和雷達
- 超透鏡
- 時鐘元件
- 其他
公司關鍵字
- 大型企業
- 中小企業
終端用戶產業
- 消費性電子
- 航空航太與國防
- 汽車
- 能源和電力
- 醫療
- 其他行業
地區
- 北美洲
- 美國
- 加拿大
- 其他北美洲國家
- 歐洲
- 德國
- 英國
- 法國
- 西班牙
- 義大利
- 其他歐洲國家
- 亞洲
- 中國
- 日本
- 印度
- 韓國
- 其他亞洲國家
- 拉丁美洲
- 巴西
- 阿根廷
- 其他拉丁美洲國家
- 中東、非洲等地區
- 澳大利亞
- 土耳其
- 沙烏地阿拉伯
- 英國阿聯酋
- 以色列
- 埃及
- 紐西蘭
超材料市場主要公司
- ALCAN Systems
- Echodyne
- Kymeta
- Meta Materials
- MetaLenz
- MinWave
- Moxtek
- Multiwave Technologies
- Fractal Antenna Systems
- Murata Manufacturing
- Matrix (Guangzhou) Metamaterials
超材料市場:報告範圍
本超材料市場報告深入分析以下幾個面向:
- 市場規模與機會分析:對超材料市場進行詳細分析,重點在於以下關鍵市場細分:[A] 超材料類型,[B] 產品形式,[C] 應用,[D] 公司形式,[E] 最終用戶產業,以及 [F] 地區。
- 競爭格局:基於相關參數(例如 [A] 成立年份、[B] 公司規模、[C] 總部所在地和 [D] 所有權結構)對進入超材料市場的公司進行全面分析。
- 公司簡介:詳細介紹進入超材料市場的主要公司,包括 [A] 總部所在地、[B] 公司規模、[C] 企業理念、[D] 業務運營、[E] 管理團隊、[F] 聯繫方式、[G] 財務資訊、[H] 業務板塊、[I] 產品和技術組合、[J] 近期發展以及未來財務資訊。
- 專利分析:基於相關參數(例如 [A] 專利類型、[B] 專利公開年份、[C] 專利年齡和 [D] 主要公司)對超材料領域已提交和已註冊的專利進行深入分析。
目錄
第一章:專案概述
第二章:研究方法
第三章:市場動態
第四章:宏觀經濟指標
第五章:摘要整理
第六章:引言
- 超材料概述
- 超材料的類型
- 超材料的優勢
- 超材料的主要應用領域
- 超材料的未來發展趨勢
第七章:市場格局:主要超材料製造商
第八章:企業競爭力
分析- 研究方法與關鍵參數
- 評分標準
- 主要超材料製造商:2x2 矩陣
- 主要公司
第9章 企業簡介
- ALCAN Systems
- Echodyne
- Kymeta
- Meta Materials
- MetaLenz
- MinWave
- Moxtek
- Multiwave Technologies
- Fractal Antenna Systems
- Murata Manufacturing
- Matrix(廣州)Metamaterials
第 10 章:大趨勢
第11章價值鏈分析
第十二章:夥伴關係與合作
- 章節概要
- 夥伴關係模式
- 元材料:夥伴關係與合作
第十三章:專利分析
第十四章:出版品分析
第十五章:市場影響分析
第十六章:全球超材料市場
第十七章:依超材料類型劃分的市場機遇
第十八章:依材料類型劃分的市場機遇
第十九章:依產品形態劃分的市場機遇
第二十章:依應用劃分的市場機遇
第二十一章:依實體類型劃分的市場機遇
第二十二章:依最終用戶產業劃分的市場機遇
第二十三章:依主要地區劃分的市場機遇
第二十四章:附錄一:表格數據
第二十五章:附錄二:公司與組織列表
Metamaterials Market Outlook
As per Roots Analysis, the global metamaterials market size is estimated to grow from USD 1.55 billion in current year to USD 17.44 billion by 2035, at a CAGR of 27.4% during the forecast period, till 2035.
Metals have served as a crucial material for antenna design since their introduction in 1888. However, conventional metallic antennas are limited in their ability to efficiently operate across multiple frequencies, often resulting in energy losses and constrained performance. To address these limitations, the industry has advanced toward the development of metamaterials, specifically designed to manipulate electromagnetic waves, including radio waves and visible light.
Metamaterials are fabricated using periodic arrangements of nano and microscale structures that exhibit unique wave-absorbing, refracting, or redirecting properties. Their high precision, modular architecture, and advanced functional capabilities have driven adoption across sectors such as automotive, aerospace, and defense, where controlled and high-performance applications are critical. Further, the ability of metamaterials to function effectively across a broad frequency spectrum makes them particularly suitable for next-generation wireless communication systems, including 5G and emerging 6G networks.
The metamaterials market is emerging as a key driver in the global transition toward innovation and technological advancement aimed at enhancing efficiency. The use of diverse raw materials in metamaterial fabrication has further expanded their functional capabilities, unlocking new application areas and reinforcing their strategic importance across multiple high-technology industries.
Strategic Insights for Senior Leaders
Key Drivers Propelling Growth of Metamaterials Market
The growth of the metamaterials market is primarily driven by the increasing demand for advanced electromagnetic wave control across telecommunications, aerospace, defense, and automotive industries. The rapid expansion of next-generation wireless networks, including 5G and emerging 6G infrastructure, has significantly accelerated the need for high-performance materials capable of enhancing signal strength, bandwidth efficiency, and antenna miniaturization.
Additionally, rising investments in defense modernization programs are fostering the adoption of metamaterials for radar absorption and advanced sensing applications. In the aerospace and automotive sectors, the push toward lightweight, compact, and energy-efficient components is further supporting market expansion. Moreover, continuous advancements in nanofabrication techniques and material science, coupled with growing research and development initiatives, are also contributing to the growth of this market.
Metamaterials Market: Competitive Landscape of Companies in this Industry
The metamaterials market is highly fragmented, characterized by the presence of both established manufacturers and emerging entrants. Both established industry players and new entrants are actively contributing to technological advancements and market expansion. Notably, more than 70% of leading manufacturers offer metamaterial-based products, reflecting the growing commercialization of these advanced materials. Further, 50% of these companies supply products for the aerospace and defense industry and nearly 40% of manufacturers provide metamaterial-based antennas and radars for various end-use industries.
Metamaterials Evolution: Emerging Trends in the Industry
The metamaterials industry is witnessing several emerging trends driven by rapid advancements in material science, nanofabrication, and electromagnetic engineering. A key trend is the increasing integration of metamaterials into next-generation communication systems, particularly for 5G and 6G networks, to enhance signal efficiency, and antenna miniaturization. There is also growing interest in tunable and programmable metamaterials that enable dynamic control of electromagnetic properties in real time. This helps in expanding their applicability in smart sensors, adaptive optics, and advanced imaging systems. Further, the development of lightweight, compact, and energy-efficient components is accelerating adoption across aerospace, defense, and automotive sectors.
Regional Analysis: Asia-Pacific Lead the Metamaterials Market
According to our analysis, in the current year, the metamaterials market in Asia-Pacific captures the largest share. This is due to its strong manufacturing base, rapid technological adoption, and sustained investments in advanced communications and defense capabilities. Further, the region has been at the forefront of 5G deployment and is actively progressing toward next-generation 6G research, creating significant demand for high-performance materials that enhance antenna efficiency. Countries such as China, Japan, South Korea, and India benefit from robust semiconductor manufacturing ecosystems, strong government R&D initiatives, and expanding aerospace and defense programs. Additionally, the presence of leading electronics manufacturers and increasing collaborations between research institutions and industry players further accelerate commercialization in this region.
Key Challenges in Metamaterials Market
Key challenges hindering the adoption of metamaterials include high research and development costs, coupled with complex design and fabrication processes at the nano - and microscale levels. Further, the lack of standardized testing frameworks and regulatory guidelines for metamaterial-based products may slow the growth of this market. Further, limited awareness among end users, along with integration complexities in existing systems, further constrain adoption. Moreover, the relatively high cost of advanced raw materials and specialized manufacturing equipment can restrict market growth, particularly in price-sensitive applications.
Metamaterials Market: Key Market Segmentation
Type of Metamaterial
- Electromagnetic Metamaterial
- Optical Metamaterial
- Thermal Metamaterial
- Acoustic Metamaterial
- Other Metamaterials
Product Form
- Thin Films
- Bulk Materials
Application
- Antenna and Radar
- Super Lens
- Clocking Devices
- Other Applications
Type of Enterprise
- Large Enterprises
- Small and Medium Enterprises (SMEs)
End Use Industry
- Consumer Electronics
- Aerospace and Defense
- Automotive
- Energy and Power
- Medical
- Other Industries
Geographical Regions
- North America
- US
- Canada
- Mexico
- Europe
- Germany
- UK
- France
- Spain
- Italy
- Rest of Europe
- Asia
- China
- Japan
- India
- South Korea
- Rest of Asia
- Latin America
- Brazil
- Argentina
- Rest of Latin America
- Middle East and Africa, and Rest of the World
- Australia
- Turkey
- Saudi Arabia
- United Arab Emirates
- Israel
- Egypt
- New Zealand
Example Players in Metamaterials Market
- ALCAN Systems
- Echodyne
- Kymeta
- Meta Materials
- MetaLenz
- MinWave
- Moxtek
- Multiwave Technologies
- Fractal Antenna Systems
- Murata Manufacturing
- Matrix (Guangzhou) Metamaterials
Metamaterials Market: Report Coverage
The report on the metamaterials market features insights on various sections, including:
- Market Sizing and Opportunity Analysis: An in-depth analysis of the metamaterials market, focusing on key market segments, including [A] type of metamaterial, [B] product form, [C] applications, [D] type of enterprise, [E] end use industry, and [F] geographical regions.
- Competitive Landscape: A comprehensive analysis of the companies engaged in the metamaterials market, based on several relevant parameters, such as [A] year of establishment, [B] company size, [C] location of headquarters and [D] ownership structure.
- Company Profiles: Elaborate profiles of prominent players engaged in the metamaterials market, providing details on [A] location of headquarters, [B] company size, [C] company mission, [D] company footprint, [E] management team, [F] contact details, [G] financial information, [H] operating business segments, [I] product / technology portfolio, [J] recent developments, and an informed future outlook.
- Patent Analysis: An insightful analysis of patents filed / granted in the metamaterials domain, based on relevant parameters, including [A] type of patent, [B] patent publication year, [C] patent age and [D] leading players.
Key Questions Answered in this Report
- What is the current and future market size?
- Who are the leading companies in this market?
- What are the growth drivers that are likely to influence the evolution of this market?
- What are the key partnership and funding trends shaping this industry?
- Which region is likely to grow at higher CAGR till 2035?
- How is the current and future market opportunity likely to be distributed across key market segments?
Reasons to Buy this Report
- Detailed Market Analysis: The report provides a comprehensive market analysis, offering detailed revenue projections of the overall market and its specific sub-segments. This information is valuable to both established market leaders and emerging entrants.
- In-depth Analysis of Trends: Stakeholders can leverage the report to gain a deeper understanding of the competitive dynamics within the market. Each report maps ecosystem activity across partnerships, funding, and patent landscapes to reveal growth hotspots and white spaces in the industry.
- Opinion of Industry Experts: The report features extensive interviews and surveys with key opinion leaders and industry experts to validate market trends mentioned in the report.
- Decision-ready Deliverables: The report offers stakeholders with strategic frameworks (Porter's Five Forces, value chain, SWOT), and complimentary Excel / slide packs with customization support.
Additional Benefits
- Complimentary Dynamic Excel Dashboards for Analytical Modules
- Exclusive 15% Free Content Customization
- Personalized Interactive Report Walkthrough with Our Expert Research Team
- Free Report Updates for Versions Older than 6-12 Months
TABLE OF CONTENTS
1. PROJECT OVERVIEW
- 1.1. Context
- 1.2. Project Objectives
2. RESEARCH METHODOLOGY
- 2.1. Chapter Overview
- 2.2. Research Assumptions
- 2.2.1. Market Landscape and Market Trends
- 2.2.2. Market Forecast and Opportunity Analysis
- 2.2.3. Comparative Analysis
- 2.3. Database Building
- 2.3.1. Data Collection
- 2.3.2. Data Validation
- 2.3.3. Data Analysis
- 2.4. Project Methodology
- 2.4.1. Secondary Research
- 2.4.1.1. Annual Reports
- 2.4.1.2. Academic Research Papers
- 2.4.1.3. Company Websites
- 2.4.1.4. Investor Presentations
- 2.4.1.5. Regulatory Filings
- 2.4.1.6. White Papers
- 2.4.1.7. Industry Publications
- 2.4.1.8. Conferences and Seminars
- 2.4.1.9. Government Portals
- 2.4.1.10. Media and Press Releases
- 2.4.1.11. Newsletters
- 2.4.1.12. Industry Databases
- 2.4.1.13. Roots Proprietary Databases
- 2.4.1.14. Paid Databases and Sources
- 2.4.1.15. Social Media Portals
- 2.4.1.16. Other Secondary Sources
- 2.4.2. Primary Research
- 2.4.2.1. Types of Primary Research
- 2.4.2.1.1. Qualitative Research
- 2.4.2.1.2. Quantitative Research
- 2.4.2.1.3. Hybrid Approach
- 2.4.2.2. Advantages of Primary Research
- 2.4.2.3. Techniques for Primary Research
- 2.4.2.3.1. Interviews
- 2.4.2.3.2. Surveys
- 2.4.2.3.3. Focus Groups
- 2.4.2.3.4. Observational Research
- 2.4.2.3.5. Social Media Interactions
- 2.4.2.4. Key Opinion Leaders Considered in Primary Research
- 2.4.2.4.1. Company Executives (CXOs)
- 2.4.2.4.2. Board of Directors
- 2.4.2.4.3. Company Presidents and Vice Presidents
- 2.4.2.4.4. Research and Development Heads
- 2.4.2.4.5. Technical Experts
- 2.4.2.4.6. Subject Matter Experts
- 2.4.2.4.7. Scientists
- 2.4.2.4.8. Doctors and Other Healthcare Providers
- 2.4.2.5. Ethics and Integrity
- 2.4.2.5.1. Research Ethics
- 2.4.2.5.2. Data Integrity
- 2.4.2.1. Types of Primary Research
- 2.4.3. Analytical Tools and Databases
- 2.4.1. Secondary Research
- 2.5. Robust Quality Control
3. MARKET DYNAMICS
- 3.1. Chapter Overview
- 3.2. Forecast Methodology
- 3.2.1. Top-down Approach
- 3.2.2. Bottom-up Approach
- 3.2.3. Hybrid Approach
- 3.3. Market Assessment Framework
- 3.3.1. Total Addressable Market (TAM)
- 3.3.2. Serviceable Addressable Market (SAM)
- 3.3.3. Serviceable Obtainable Market (SOM)
- 3.3.4. Currently Acquired Market (CAM)
- 3.4. Forecasting Tools and Techniques
- 3.4.1. Qualitative Forecasting
- 3.4.2. Correlation
- 3.4.3. Regression
- 3.4.4. Extrapolation
- 3.4.5. Convergence
- 3.4.6. Sensitivity Analysis
- 3.4.7. Scenario Planning
- 3.4.8. Data Visualization
- 3.4.9. Time Series Analysis
- 3.4.10. Forecast Error Analysis
- 3.5. Key Considerations
- 3.5.1. Demographics
- 3.5.2. Government Regulations
- 3.5.3. Reimbursement Scenarios
- 3.5.4. Market Access
- 3.5.5. Supply Chain
- 3.5.6. Industry Consolidation
- 3.5.7. Pandemic / Unforeseen Disruptions Impact
- 3.6. Limitations
4. MACRO-ECONOMIC INDICATORS
- 4.1. Chapter Overview
- 4.2. Market Dynamics
- 4.2.1. Time Period
- 4.2.1.1. Historical Trends
- 4.2.1.2. Current and Forecasted Estimates
- 4.2.2. Currency Coverage
- 4.2.2.1. Major Currencies Affecting the Market
- 4.2.2.2. Factors Affecting Currency Fluctuations
- 4.2.2.3. Impact of Currency Fluctuations on the Industry
- 4.2.3. Foreign Currency Exchange Rate
- 4.2.3.1. Impact of Foreign Exchange Rate Volatility on the Market
- 4.2.3.2. Strategies for Mitigating Foreign Exchange Risk
- 4.2.4. Recession
- 4.2.4.1. Assessment of Current Economic Conditions and Potential Impact on the Market
- 4.2.4.2. Historical Analysis of Past Recessions and Lessons Learnt
- 4.2.5. Inflation
- 4.2.5.1. Measurement and Analysis of Inflationary Pressures in the Economy
- 4.2.5.2. Potential Impact of Inflation on the Market Evolution
- 4.2.6. Interest Rates
- 4.2.6.1. Interest Rates and Their Impact on the Market
- 4.2.6.2. Strategies for Managing Interest Rate Risk
- 4.2.7. Commodity Flow Analysis
- 4.2.7.1. Type of Commodity
- 4.2.7.2. Origins and Destinations
- 4.2.7.3. Value and Weights
- 4.2.7.4. Modes of Transportation
- 4.2.8. Global Trade Dynamics
- 4.2.8.1. Import Scenario
- 4.2.8.2. Export Scenario
- 4.2.8.3. Trade Policies
- 4.2.8.4. Strategies for Mitigating the Risks Associated with Trade Barriers
- 4.2.8.5. Impact of Trade Barriers on the Market
- 4.2.9. War Impact Analysis
- 4.2.9.1. Russian-Ukraine War
- 4.2.9.2. Israel-Hamas War
- 4.2.10. COVID Impact / Related Factors
- 4.2.10.1. Global Economic Impact
- 4.2.10.2. Industry-specific Impact
- 4.2.10.3. Government Response and Stimulus Measures
- 4.2.10.4. Future Outlook and Adaptation Strategies
- 4.2.11. Other Indicators
- 4.2.11.1. Fiscal Policy
- 4.2.11.2. Consumer Spending
- 4.2.11.3. Gross Domestic Product (GDP)
- 4.2.11.4. Employment
- 4.2.11.5. Taxes
- 4.2.11.6. Stock Market Performance
- 4.2.11.7. Cross-Border Dynamics
- 4.2.1. Time Period
- 4.3. Conclusion
5. EXECUTIVE SUMMARY
6. INTRODUCTION
- 6.1. Overview of the Metamaterials
- 6.2. Types of Metamaterials
- 6.3. Advantages of Metamaterials
- 6.4. Key Application Areas of Metamaterials
- 6.5. Future Trends in Metamaterials
7. MARKET LANDSCAPE: LEADING METAMATERIALS MANUFACTURERS
- 7.1. Methodology and Key Parameters
- 7.2. Analysis by Year of Establishment
- 7.3. Analysis by Company Size
- 7.4. Analysis by Location of Headquarters
- 7.5. Analysis by Type of Solution
- 7.6. Analysis by Type of Metamaterial
- 7.7. Analysis by Application
- 7.8. Analysis by End-use Industry
8. COMPANY COMPETITIVENESS ANALYSIS
- 8.1. Methodology and Key Parameters
- 8.2. Scoring Criteria
- 8.3. Leading Metamaterials Manufacturers: 2x2 Matrix
- 8.4. Leading Players
9. COMPANY PROFILES
- 9.1. ALCAN Systems*
- 9.1.1. Company Overview
- 9.1.2. Management Team
- 9.1.3. Metamaterials Portfolio
- 9.1.4. Recent Developments and Future Outlook
- Similar details are presented for other below mentioned companies based on information in the public domain
- 9.2. Echodyne
- 9.3. Kymeta
- 9.4. Meta Materials
- 9.5. MetaLenz
- 9.6. MinWave
- 9.7. Moxtek
- 9.8. Multiwave Technologies
- 9.9. Fractal Antenna Systems
- 9.10. Murata Manufacturing
- 9.11. Matrix (Guangzhou) Metamaterials
10. MEGA TRENDS
11. VALUE CHAIN ANALYSIS
12. PARTNERSHIPS AND COLLABORATIONS
- 12.1. Chapter Overview
- 12.2. Partnership Models
- 12.3. Metamaterials: Partnerships and Collaborations
- 12.3.1. Analysis by Year of Partnership
- 12.3.2. Analysis by Type of Partnership
- 12.3.3. Analysis by Year and Type of Partnership
- 12.3.4. Most Active Players: Analysis by Number of Partnerships
- 12.3.5. Analysis by Geography
- 12.3.5.1. Analysis by Country
- 12.3.5.2. Analysis by Continent
13. PATENT ANALYSIS
- 13.1. Methodology
- 13.2. Key Parameters
- 13.3. Metamaterials Market: Patent Analysis
- 13.3.1. Analysis by Application Year
- 13.3.2. Analysis by Type of Patent
- 13.3.3. Analysis by Patent Jurisdiction
- 13.3.4. Analysis by Publication Year
- 13.3.5. Analysis by Type of Patent and Publication Year
- 13.3.6. Leading Industry Players: Analysis by Number of Patents
- 13.3.7. Leading Individual Patent Assignees: Analysis by Number of Patents
- 13.3.8. Analysis by Type of Applicant
- 13.3.9. Analysis by Patent Age
- 13.3.10. Patent Valuation
14. PUBLICATION ANALYSIS
- 14.1. Chapter Overview
- 14.2. Analysis by Year of Publication
- 14.3. Analysis by Key Focus Areas
- 14.4. Analysis by Key Journal
15. MARKET IMPACT ANALYSIS
16. GLOBAL METAMATERIALS MARKET
- 16.1. Key Assumptions and Methodology
- 16.2. Global Metamaterials Market, Historical Trends (Since 2022) and Forecasted Estimates (Till 2035)
- 16.2.1. Scenario Analysis
- 16.2.1.1. Conservative Scenario
- 16.2.1.2. Optimistic Scenario
- 16.2.1. Scenario Analysis
- 16.3. Key Market Segmentations
17. MARKET OPPORTUNITIES BASED ON TYPE OF METAMATERIAL
- 17.1. Key Assumptions and Methodology
- 17.2. Metamaterials Market, by Type of Metamaterials
- 17.2.1. Metamaterials Market for Acoustic Metamaterials, Historical Trends (Since 2022) and Forecasted Estimates (Till 2035)
- 17.2.2. Metamaterials Market for Electromagnetic Metamaterials, Historical Trends (Since 2022) and Forecasted Estimates (Till 2035)
- 17.2.3. Metamaterials Market for Optical Metamaterials, Historical Trends (Since 2022) and Forecasted Estimates (Till 2035)
- 17.2.4. Metamaterials Market for Thermal Metamaterials, Historical Trends (Since 2022) and Forecasted Estimates (Till 2035)
- 17.2.5. Metamaterials Market for Other Metamaterials, Historical Trends (Since 2022) and Forecasted Estimates (Till 2035)
18. MARKET OPPORTUNITIES BASED ON TYPE OF MATERIAL USED
- 18.1. Key Assumptions and Methodology
- 18.2. Metamaterials Market, by Type of Material Used
- 18.2.1. Metamaterials Market for Polyurethane, Historical Trends (Since 2022) and Forecasted Estimates (Till 2035)
- 18.2.2. Metamaterials Market for Polystyrene, Historical Trends (Since 2022) and Forecasted Estimates (Till 2035)
- 18.2.3. Metamaterials Market for Silicone, Historical Trends (Since 2022) and Forecasted Estimates (Till 2035)
- 18.2.4. Metamaterials Market for Polyolefins, Historical Trends (Since 2022) and Forecasted Estimates (Till 2035)
- 18.2.5. Metamaterials Market for Other Materials, Historical Trends (Since 2022) and Forecasted Estimates (Till 2035)
19. MARKET OPPORTUNITIES BASED ON PRODUCT FORM
- 19.1. Key Assumptions and Methodology
- 19.2. Metamaterials Market, by Product Form
- 19.2.1. Metamaterials Market for Bulk Materials, Historical Trends (Since 2022) and Forecasted Estimates (Till 2035)
- 19.2.2. Metamaterials Market for Thin Films, Historical Trends (Since 2022) and Forecasted Estimates (Till 2035)
20. MARKET OPPORTUNITIES BASED ON APPLICATION
- 20.1. Key Assumptions and Methodology
- 20.2. Metamaterials Market, by Application
- 20.2.1. Metamaterials Market for Antenna and Radar, Historical Trends (Since 2022) and Forecasted Estimates (Till 2035)
- 20.2.2. Metamaterials Market for Cloaking Devices, Historical Trends (Since 2022) and Forecasted Estimates (Till 2035)
- 20.2.3. Metamaterials Market for Super Lens, Historical Trends (Since 2022) and Forecasted Estimates (Till 2035)
- 20.2.4. Metamaterials Market for Other Applications, Historical Trends (Since 2022) and Forecasted Estimates (Till 2035)
21. MARKET OPPORTUNITIES BASED ON TYPE OF ENTERPRISE
- 21.1. Key Assumptions and Methodology
- 21.2. Metamaterials Market, by Type of Enterprise
- 21.2.1. Metamaterials Market for Large Enterprises, Historical Trends (Since 2022) and Forecasted Estimates (Till 2035)
- 21.2.2. Metamaterials Market for Small and Medium Enterprises (SMEs), Historical Trends (Since 2022) and Forecasted Estimates (Till 2035)
22. MARKET OPPORTUNITIES BASED ON END USE INDUSTRY
- 22.1. Key Assumptions and Methodology
- 22.2. Metamaterials Market, by End Use Industry
- 22.2.1. Metamaterials Market for Aerospace and Defense, Historical Trends (Since 2022) and Forecasted Estimates (Till 2035)
- 22.2.2. Metamaterials Market for Automotive, Historical Trends (Since 2022) and Forecasted Estimates (Till 2035)
- 22.2.3. Metamaterials Market for Consumer Electronics, Historical Trends (Since 2022) and Forecasted Estimates (Till 2035)
- 22.2.4. Metamaterials Market for Energy and Power, Historical Trends (Since 2022) and Forecasted Estimates (Till 2035)
- 22.2.5. Metamaterials Market for Medical, Historical Trends (Since 2022) and Forecasted Estimates (Till 2035)
- 22.2.6. Metamaterials Market for Other End-use Industry, Historical Trends (Since 2022) and Forecasted Estimates (Till 2035)
23. MARKET OPPORTUNITIES BASED ON KEY GEOGRAPHICAL REGIONS
- 23.1. Key Assumptions and Methodology
- 23.2. Metamaterials Market, by Key Geographical Regions
- 23.2.1. Metamaterials Market in North America, Historical Trends (Since 2022) and Forecasted Estimates (Till 2035)
- 23.2.1.1. Metamaterials Market in the US, Historical Trends (Since 2022) and Forecasted Estimates (Till 2035)
- 23.2.1.2. Metamaterials Market in Canada, Historical Trends (Since 2022) and Forecasted Estimates (Till 2035)
- 23.2.1.3. Metamaterials Market in Mexico, Historical Trends (Since 2022) and Forecasted Estimates (Till 2035)
- 23.2.2. Metamaterials Market in Europe, Historical Trends (Since 2022) and Forecasted Estimates (Till 2035)
- 23.2.2.1. Metamaterials Market in Germany, Historical Trends (Since 2022) and Forecasted Estimates (Till 2035)
- 23.2.2.2. Metamaterials Market in the UK, Historical Trends (Since 2022) and Forecasted Estimates (Till 2035)
- 23.2.2.3. Metamaterials Market in France, Historical Trends (Since 2022) and Forecasted Estimates (Till 2035)
- 23.2.2.4. Metamaterials Market in Spain, Historical Trends (Since 2022) and Forecasted Estimates (Till 2035)
- 23.2.2.5. Metamaterials Market in Italy, Historical Trends (Since 2022) and Forecasted Estimates (Till 2035)
- 23.2.2.6. Metamaterials Market in Rest of Europe, Historical Trends (Since 2022) and Forecasted Estimates (Till 2035)
- 23.2.3. Metamaterials Market in Asia, Historical Trends (Since 2022) and Forecasted Estimates (Till 2035)
- 23.2.3.1. Metamaterials Market in China, Historical Trends (Since 2022) and Forecasted Estimates (Till 2035)
- 23.2.3.2. Metamaterials Market in Japan, Historical Trends (Since 2022) and Forecasted Estimates (Till 2035)
- 23.2.3.3. Metamaterials Market in India, Historical Trends (Since 2022) and Forecasted Estimates (Till 2035)
- 23.2.3.4. Metamaterials Market in South Korea, Historical Trends (Since 2022) and Forecasted Estimates (Till 2035)
- 23.2.3.5. Metamaterials Market in Rest of Asia, Historical Trends (Since 2022) and Forecasted Estimates (Till 2035)
- 23.2.4. Metamaterials Market in Latin America, Historical Trends (Since 2022) and Forecasted Estimates (Till 2035)
- 23.2.4.1. Metamaterials Market in Brazil, Historical Trends (Since 2022) and Forecasted Estimates (Till 2035)
- 23.2.4.2. Metamaterials Market in Argentina, Historical Trends (Since 2022) and Forecasted Estimates (Till 2035)
- 23.2.4.3. Metamaterials Market in Rest of Latin America, Historical Trends (Since 2022) and Forecasted Estimates (Till 2035)
- 23.2.5. Metamaterials Market in Middle East and North Africa and Rest oof the World, Historical Trends (Since 2022) and Forecasted Estimates (Till 2035)
- 23.2.5.1. Metamaterials Market in Australia, Historical Trends (Since 2022) and Forecasted Estimates (Till 2035)
- 23.2.5.2. Metamaterials Market in Turkey, Historical Trends (Since 2022) and Forecasted Estimates (Till 2035)
- 23.2.5.3. Metamaterials Market in Saudi Arabia, Historical Trends (Since 2022) and Forecasted Estimates (Till 2035)
- 23.2.5.4. Metamaterials Market in United Arab Emirates, Historical Trends (Since 2022) and Forecasted Estimates (Till 2035)
- 23.2.5.5. Metamaterials Market in Israel, Historical Trends (Since 2022) and Forecasted Estimates (Till 2035)
- 23.2.5.6. Metamaterials Market in Egypt, Historical Trends (Since 2022) and Forecasted Estimates (Till 2035)
- 23.2.5.7. Metamaterials Market in New Zealand, Historical Trends (Since 2022) and Forecasted Estimates (Till 2035)
- 23.2.1. Metamaterials Market in North America, Historical Trends (Since 2022) and Forecasted Estimates (Till 2035)
24. APPENDIX 1: TABULATED DATA
25. APPENDIX 2: LIST OF COMPANIES AND ORGANIZATIONS
 超材料市場機會、成長要素、產業趨勢分析及2026-2035年預測
 超材料市場:按類型、整合方法、頻段、應用、最終用戶和分銷管道分類-2026-2032年全球市場預測聲波超材料市場:按應用、類型、材料和頻率範圍分類,全球預測(2026-2032年)
 超材料市場:依類型、產品、波控制、應用和最終用戶劃分-全球預測至2036年
 2034年全球電磁超材料市場機會與策略
 全球超材料市場規模、佔有率、趨勢和成長分析報告(2026-2034)
 全球超材料市場按應用、最終用戶、產品、類型和地區分類-預測至2032年2026年全球超材料市場報告
 超材料市場規模、佔有率和趨勢分析報告:按產品、應用、最終用途、地區和細分市場預測(2026-2033 年)平面超透鏡市場按類型、材質、波長和應用分類 - 全球預測 2026-2032