


 |
市場調查報告書
商品編碼
1958587
穿戴式注射器市場(第8版):依裝置類型、自動化程度、用途、治療領域和地區劃分 - 趨勢及至2035年的預測Wearable Injectors Market (8th Edition): Distribution by Type of Device, Degree of Automation, Usability, Therapeutic Area, and Geographical Regions - Trends and Forecast Till 2035 |
||||||
穿戴式注射器市場 - 概述
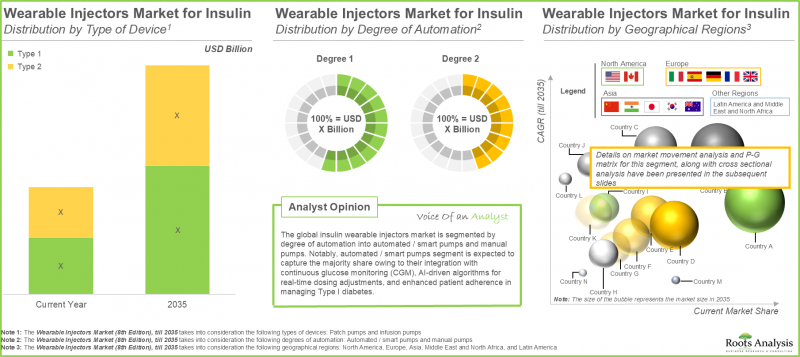
全球穿戴式注射器市場預計將從目前的68億美元成長到2035年的130億美元,預測期內(~2035年)的年複合成長率(CAGR)為 7.4%。
穿戴式注射器市場 - 成長與趨勢
自體免疫疾病、心臟病和癌症的盛行率不斷上升,加上人口老化加劇,持續給醫療保健系統帶來壓力。為了應對這項挑戰,製藥公司開發以患者為中心的解決方案,透過先進的藥物輸送技術來提高治療依從性和療效。穿戴式注射器,例如佩戴在身上的貼片泵,可以透過持續基礎輸注、推注或持續輸注的方式輸送大劑量生物製劑,簡化給藥流程並提高患者依從性。整合式安全功能可最大限度地減少針刺傷,同時確保居家使用的舒適性和可靠性。為了說明這一趨勢,BD 近期宣布啟動首個由製藥公司贊助的臨床試驗,該試驗使用 BD Libertas 可穿戴式注射器進行複雜生物製劑的皮下注射,凸顯了人們對這些高容量、便捷易用的居家護理系統的信心日益增強。 這些進步使得穿戴式裝置成為居家醫療保健環境中皮下給藥的首選方案。此外,穿戴式注射器的廣泛應用促使製藥和醫療器材製造商在其產品線中融入先進功能,包括人工智慧演算法、具備智慧健康監測、提醒和用藥確認視覺或聽覺通知功能的行動應用程式。該領域的持續進步預計將顯著提高這些穿戴式注射器的使用率,並在不久的將來進一步推動市場擴張。
成長驅動因素:市場擴張的策略驅動因素
穿戴式注射器市場的驅動因素包括糖尿病、腫瘤和自體免疫疾病等慢性病盛行率的上升。這些因素推動了對便利的生物製劑皮下注射和高劑量療法的需求。此外,家庭醫療保健的興起使得患者能夠自我用藥,減少了就醫次數,提高了患者的自主性和依從性,進一步推動了市場成長。小型化、用於即時監測的無線連接以及與數位健康平台的整合等技術進步進一步加速市場普及。
市場挑戰:發展的主要障礙
阻礙穿戴式注射器廣泛應用的主要挑戰包括不斷上漲的研發和生產成本,尤其是在償付體系薄弱的新興市場。此外,嚴格的監管要求會延緩這些設備的審批,並增加製造商的合規負擔。病患相關的障礙,例如缺乏裝置使用訓練以及對安全性和舒適性的擔憂,加上現有給藥方式的競爭,也阻礙了穿戴式注射器的廣泛應用。
穿戴式注射器市場 - 主要洞察
本報告深入分析了穿戴式注射器市場的現狀,並指出了該行業的潛在成長機會。主要發現包括:
- 在目前的市場格局中,有超過 50 種不同類型的可穿戴胰島素注射器。開發這些注射器的公司中,中型企業比例相對較高(約 40%)。
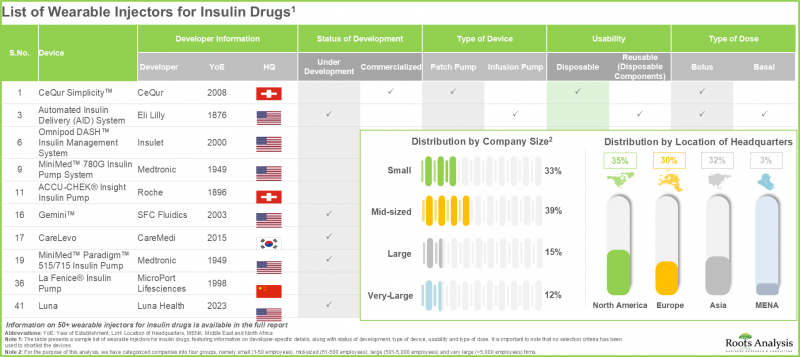
- 目前,約 65%的可穿戴胰島素注射器已實現商業化,其中大部分針對第1 型糖尿病患者,可為需要頻繁給藥的患者提供強化基礎胰島素和餐前胰島素治療。
- 在目前的市場環境下,全球有多家公司開發用於非胰島素藥物給藥的可穿戴注射器,其中大多數(64%)總部位於歐洲。
- 使用儲存非胰島素藥物的藥筒的可穿戴注射器約佔市場佔有率的70%。此外,約 85%的裝置具備藍牙連接功能,可實現進階監測和資料整合。
- 目前全球已有近20種藥物-器械組合可用於輸送非胰島素類藥物。其中超過55%的器械由大型公司利用其先進的製造能力開發。
- 用於輸送非胰島素類藥物的藥物-器械組合中,60%已商業化。這些器械組合在神經系統疾病和腫瘤的治療中應用尤為廣泛。
- 在穿戴式注射器領域,已發表的專利中約有70%為專利申請,其中大部分專利(約75%)在北美公佈。
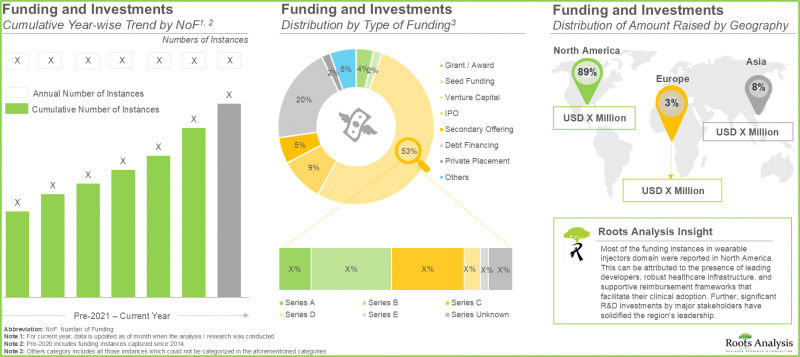
- 穿戴式注射器具有諸多優勢,例如能夠實現藥物的自我給藥和降低醫療成本,因此受到眾多投資者的支持,自2020年以來已累計投資超過 165億美元。
- 目前已註冊多項臨床試驗,目的是評估各種穿戴式注射器的安全性和有效性。其中大部分研究已在美國各地的醫療機構進行。
- 由於慢性病盛行率的上升以及以家庭為基礎、以患者為中心的護理模式的轉變,預計未來幾年可穿戴注射器市場將實現強勁成長。
- 由於貼片式胰島素幫浦設計隱蔽纖薄、患者舒適度高且易於自我注射,預計將佔據最大的市場佔有率。
- 目前,北美地區穿戴式胰島素注射器市場佔據主導地位,這得益於其先進的醫療基礎設施和整合式 CGM 相容幫浦技術的廣泛應用。
- 受慢性病患病率上升和該地區有利的醫保償付環境的推動,預計今年北美可穿戴式注射器市場將佔據最大的市場佔有率。
- 受以患者為中心的大容量注射器需求不斷成長的推動,預計美國可穿戴注射器市場在預測期內將以更高的年複合成長率成長。
- 鑑於強大的藥物研發管線和對家庭醫療保健日益成長的關注,預計未來幾年可穿戴注射器市場將實現顯著成長。
穿戴式注射器市場
市場規模和機會分析基於以下參數進行細分:
依設備劃分的市場
- 貼片泵
- 輸液泵
依自動化程度劃分的市場
- 自動/智慧型泵
- 手動泵
依用途劃分的市場
- 拋棄式
- 可重複使用(拋棄式零件)
依治療領域劃分的市場
- 腫瘤學
- 心血管疾病
- 自體免疫疾病
- 神經系統疾病
- 其他
依地區劃分的市場
- 北美
- 美國
- 加拿大
- 墨西哥
- 歐洲
- 法國
- 德國
- 英國
- 義大利
- 西班牙
- 其他歐洲國家
- 亞洲
- 中國
- 印度
- 日本
- 巴基斯坦
- 其他亞洲國家
- 中東和北非
- 埃及
- 以色列
- 沙烏地阿拉伯
- 拉丁美洲
- 阿根廷
- 巴西
穿戴式注射器市場 - 主要細分市場
輸液幫浦細分市場佔據最大的市場佔有率
穿戴式胰島素注射器市場整體分為各種設備類型,例如貼片幫浦和輸液幫浦。根據預測,輸液幫浦類別約佔穿戴式注射器現有市場佔有率的95%。這主要歸功於其在藥物給藥方面無與倫比的精準性和適應性等優勢。此外,由於居家使用和自我給藥的便利性不斷提高,貼片幫浦細分市場未來預計將實現更高的年複合成長率。其隱藏的設計使其成為糖尿病和癌症等疾病持續治療的理想選擇,隨著疾病發生率的上升,預計其應用將迅速普及。
北美:佔據市場主導地位,市場佔有率最大
北美在穿戴式注射器市場佔據最大的市場佔有率(約佔 70%)。先進的醫療保健體系、慢性病高發生率以及醫療保健支出不斷增加等因素是推動該地區市場成長的關鍵因素。
腫瘤領域引領非胰島素穿戴式注射器市場。
整個市場根據治療領域細分為多個子領域,包括癌症相關疾病、心臟病、神經系統疾病、自體免疫疾病以及其他各種疾病。根據對非胰島素藥物穿戴式注射器的市場分析,腫瘤領域是推動市場成長的主要因素,這主要歸因於癌症的高發生率以及對複雜生物製劑和化療藥物精準給藥的需求。預計神經科領域在整個預測期內將以更高的年複合成長率成長。
穿戴式注射器市場的主要參與者
- Becton Dickinson(BD)
- Enable Injections
- Insulet
- Medtronic
- Tandem Diabetes Care
- West Pharmaceutical Services
- Ypsomed
穿戴式注射器市場 - 研究範圍
- 市場規模和機會分析:本報告對穿戴式注射器市場進行了詳細分析,重點關注以下關鍵市場細分:[A] 設備類型,[B] 自動化程度,[C] 用途,[D] 治療領域,以及 [E] 地理區域。
- 非胰島素藥物穿戴式注射器市場概況:非胰島素藥物穿戴式注射器穿戴式注射器市場概況包括以下資訊:[A] 設備類型,[B] 研發狀態,[C] 給藥方式,[D] 易用性,[E] 藥物儲庫容量,[F] 藥物分子類型,[G] 給藥方式,[H] 注射方式,[I] 治療領域,[J] 藥物容器,[K]年份藥物灌裝公司規模,[K] 總部所在地,以及 [L] 主要廠商。
- 非胰島素藥物-器械組合市場概況:除了對非胰島素藥物-器械組合市場中可穿戴注射器的整體市場概況進行詳細概述外,此市場概況還包括以下資訊:[A] 器械類型,[B] 研發狀態,[C] 給藥方式,[D] 用途,[E] 藥物儲庫容量,[F] 藥物分子類型,[G] 藥物類型,[E] 藥物庫容量,[F] 藥物分子類型,[G] [I] 領域,[F],藥物容器類型,[K] 藥物填充方式,[H] 主要參與者,[I] 成立年份,[J] 公司規模,[K] 總部所在地,以及 [L] 主要參與者。
- 穿戴式胰島素注射器市場概覽:本報告詳細概述了可穿戴胰島素注射器市場的整體市場格局,包括以下資訊:[A] 設備類型,[B] 研發現狀,[C] 給藥方式,[D] 用途,[E] 藥物儲庫容量,藥物分子類型,[F] 劑量類型,[G] 藥物劑量,[HI] 容器類型,[HI] 治療領域,[KJ] 藥物劑量,[HI] 治療容器藥物填充方法,[H] 主要參與者,[I] 成立年份,[J] 公司規模,[K] 總部所在地,以及 [L] 主要參與者。
- 公司簡介:本報告詳細介紹了北美、歐洲和亞太地區主要可穿戴注射器製造商的概況,包括:[A] 成立年份,[B] 總部所在地,[C] 產品組合,[D] 近期發展,以及 [E] 未來展望。
- 專利分析:基於多個相關參數,對過去十年中與可穿戴注射器相關的已提交和已授權專利進行詳細分析,這些參數包括:[A] 專利類型,[B] 專利公開年份,[C] 管轄地,[D] CPC 分類號,[E] 組織類型,[F] 新興關注領域,[G] 最活躍的參與者,[F] 專利分析
- 有前景的候選藥物:概述已上市藥物/療法和在研藥物,這些藥物/療法和在研藥物可能在不久的將來與可穿戴注射器聯合開發。基於詳細分析,識別出潛在的候選藥物(已上市藥物和臨床階段藥物),並考慮了以下多個參數:[A] 藥物分子類型,[B] 研發階段,[C] 適應症,[D] 給藥頻率,[E] 療法類型,[F] 給藥方法,以及 [G] 給藥途徑。
- 臨床試驗分析:基於以下相關參數,對已完成、進行和計劃中的可穿戴注射器相關臨床試驗進行詳細分析:[A] 研究招募狀態,[B] 研究註冊年份,[C] 研究階段,[D] 研究設計,[E] 申辦方/合作方類型,[F] 主要參與者(基於註冊試驗數量),[G] 申辦領域/合作方類型,[F] 主要參與者(基於註冊試驗數量),[G] 領域治療領域,[I] 地理範圍,[I] 地理範圍,[F] 領域,[I] 地理範圍,[I] 領域。 [G] 重點領域,[H] 治療領域,[I] 地區。
- 資金與投資分析:基於以下相關參數,對該領域的資金和投資交易進行詳細分析:[A] 資金年份,[B] 資金類型,[C] 投資金額,[D] 地區,[E] 主要參與者。
- SWOT 分析:對連網/智慧型藥物輸送設備開發過程中包括的各個階段(研發、產品製造/組裝、產品分銷、行銷/銷售、上市後監測)進行詳細的價值鏈分析,並提供各階段的成本資訊。
- 監管環境和償付政策:考慮北美(美國、加拿大、墨西哥)、歐洲(英國、法國、德國、義大利、西班牙及其他歐洲國家)、亞太地區以及世界其他地區(澳洲、巴西、中國、印度、以色列、日本、紐西蘭、新加坡、南非、韓國、台灣和泰國)的醫療器材審批監管指南。
- 市場影響分析:詳細分析可能影響穿戴式注射器市場成長的因素。這也包括識別和分析關鍵驅動因素、潛在限制因素、新興機會和現有挑戰。
目錄
第1章 引言
第2章 研究方法
第3章 市場動態
第4章 宏觀經濟指標
第5章 執行摘要
第6章 引言
- 章節概要
- 藥物輸送裝置簡介
- 傳統腸外給藥裝置
- 自給藥裝置的出現
- 現有自動注射器
- 監管考量
- 未來展望
第7章 非胰島素藥物穿戴注射器:市場
- 章節概述
- 非胰島素藥物穿戴式注射器:市場概況
- 非胰島素藥物穿戴式注射器:研究發現狀
第8章 非胰島素藥物-器材組合:市場概況
第9章 胰島素藥物穿戴式注射器:市場概況
第10章 產品競爭分析
第11章 穿戴式注射器開發商:公司簡介
- 章節概述
- 非胰島素藥物穿戴式注射器開發商
- CCBio
- E3D Elcam Drug Delivery Devices
- Enable Injections
- Gerresheime注射
- Sonceboz
- Weibel CDS(Acquired by SHL Medical)
- West Pharmaceuticals
- 用於胰島素藥物的可穿戴注射器開發商
- CeQu注射
- Debiotech
- Eli Lilly
- Insulet
- Medtronic
- Medtrum Technologies
- PharmaSens
- Roche
- SOOIL Development
第12章 藥物-器械組合:器械簡介
- 章節概述
- Neulasta®(pegfilgrastim)OnPro™Kit
- D-mine®泵
- Lasix®ONYU
- The LUTREPULSE®系統
- ND0612L新一代貼片泵
- Unnamed(Phillips Medisize開發)
- FUROSCIX®
- SMT-201 泵
- SMT-301 泵
- ULTOMRIS®智慧劑量注射器(ravulizumab-cwvz)
- EMPAVELI®Injector
- SKYRIZI®On Body Injector(risankizumab)
- VYALEV™泵(foscarbidopa and foslevodopa)
- UDENYCA®體外注射器
- ONAPGO™
- Remunity®泵
- G-Lasta®BodyPod
- Sarclisa(isatuximab)體外注射器
第13章 合作與夥伴關係
第14章 重點收購目標
第15章 專利分析
第16章 穿戴式注射器:有前景的候選藥物
- 章節概述
- 已上市藥物
- 臨床階段藥物
第17章 臨床試驗分析
- 章節概述
- 研究範圍與方法
- 穿戴式注射器:臨床試驗分析
第18章 資金與投資分析
- 章節概述
- 融資類型
- 穿戴式注射器:融資與投資分析
第19章 SWOT分析
第20章 案例研究:合約製造組織在醫療器材開發供應鏈中的作用
第21章 醫療器材監管與償付現況
- 章節概述
- 醫療器材監管和償付通用指南
- 北美監理與償付現狀
- 歐洲監管和償付現狀
- 亞太及其他地區監管及償付現狀
第22章 市場影響分析:驅動因素、限制因素、機會與挑戰
- 章節概述
- 市場驅動因素
- 市場限制因素
- 市場機會
- 市場挑戰
- 結論
第23章 非胰島素藥物穿戴式注射器
第24章 非胰島素藥物穿戴式注射器(依裝置類型劃分)
第25章 非胰島素藥物穿戴式注射器市場(依用途劃分)
第26章 非胰島素藥物穿戴式注射器市場(依治療領域劃分)
第27章 非胰島素藥物穿戴式注射器市場(依地區劃分)
第28章 胰島素藥物穿戴式注射器市場
第29章 胰島素藥物穿戴式注射器市場(依裝置類型劃分)
第30章 胰島素藥物穿戴式注射器市場(依自動化程度劃分)
第31章 胰島素藥物穿戴式注射器市場(依地區劃分)
第32章 結論
第33章 高層洞察
第34章 附錄1:表格資料
第35章 附錄2:公司與組織列表
Wearable Injectors Market: Overview
As per Roots Analysis, the global wearable injectors market is estimated to grow from USD 6.8 billion in the current year to USD 13.0 billion by 2035, at a CAGR of 7.4% during the forecast period, till 2035.
Wearable Injectors Market: Growth and Trends
The rise in autoimmune diseases, heart conditions, and cancer continues to put pressure on healthcare systems as the population grows and ages. In response, pharmaceutical companies are developing patient-focused solutions to enhance treatment adherence and outcomes through advanced drug delivery technologies. Wearable injectors, such as on-body patch pumps, provide sustained basal, bolus, or continuous doses of large-volume biologics, making administration easier and improving adherence. Their integrated safety features minimize needlestick injuries, while ensuring comfort and confidence when used at home. Illustrating this trend, BD recently announced the launch of the first clinical trial sponsored by a pharmaceutical company for a combination product using the BD Libertas wearable injector for the subcutaneous delivery of complex biologics. This highlights the increasing trust in these large-volume, patient-friendly systems for at-home care.
Due to this development, wearable devices have emerged as the favored option for administering drugs subcutaneously in home-care environments. In addition, the rise in popularity of on-body injectors has led pharmaceutical companies and medical device manufacturers to incorporate advanced features into their product lines. These features include artificial intelligence algorithms, mobile applications with intelligent health monitoring, reminders, and visual or audible notifications confirming drug delivery. With constant advancements occurring in this sector, it is anticipated that the usage of such on-body injectors will rise substantially, fueling market expansion in the foreseeable future.
Growth Drivers: Strategic Enablers of Market Expansion
The market drivers in the wearable injector's domain include rising prevalence of chronic diseases like diabetes, oncology, and autoimmune disorders, which fuels the demand for convenient subcutaneous delivery of biologics and high-volume therapies. In addition, the market is fueled by the growing preference for home healthcare enables self-administration, reducing clinic visits and enhancing patient autonomy and adherence. Technological advancements, including miniaturization, wireless connectivity for real-time monitoring, and integration with digital health platforms, further accelerate the market adoption.
Market Challenges: Critical Barriers Impeding Progress
Key challenges hindering the adoption of wearable injectors include rising development and production costs especially in emerging markets with weak reimbursement infrastructure. Further, stringent regulatory requirements delay approvals of these devices and raise compliance burdens for manufacturers. Patient-related barriers, such as lack of training on device use and concerns over safety or comfort, hinder widespread adoption alongside competition from established delivery methods.
Wearable Injectors Market: Key Insights
The report delves into the current state of the wearable injectors market and identifies potential growth opportunities within industry. Some key findings from the report include:
- The current market landscape features more than 50 wearable injectors for insulin drugs; a relatively higher proportion (~40%) of the companies developing such injectors are mid-sized players.
- About 65% of wearable injectors for insulin drugs are commercialized; of these, majority of devices are targeting Type I diabetes to enable intensive basal-bolus insulin regimens for patients requiring frequent dosing.
- The current market landscape features the presence of several companies developing wearable injectors for the delivery of non-insulin drugs worldwide; majority (64%) of these firms are headquartered in Europe.
- Around 70% of the wearable injectors utilize cartridges for storing non-insulin drugs; further, about 85% of the devices offer Bluetooth connectivity, enabling enhanced monitoring and data integration capabilities.
- Close to 20 drug-device combinations are available for delivering non-insulin drugs globally; over 55% of these devices have been developed by relatively larger players utilizing their advanced manufacturing capabilities.
- 60% of drug-device combinations for delivering non-insulin drugs are commercialized; notably, such device combinations are more popular for neurological and oncological disorders.
- Around 70% of the patents published in the wearable injectors domain are patent applications; notably, majority (~75%) of the patents have been published in North America.
- Given various benefits of wearable injectors in enabling self-administration of drugs and reducing healthcare costs, several investors have extended financial support; over USD 16.5 billion has been invested since 2020.
- Several clinical trials have been registered till date to evaluate the safety and efficacy of various wearable injectors; majority of these studies have been conducted across various sites in the US.
- Driven by the rising prevalence of chronic diseases and the shift towards home-based, patient-centric care models, the wearable injectors market is anticipated to witness robust growth over the coming years.
- Patch pumps are expected to capture the largest market share due to their discreet low-profile design, superior patient comfort, and simpler self-administration.
- Currently, the majority share in the wearable injectors market for insulin is captured by North America owing to its advanced healthcare infrastructure and widespread adoption of integrated CGM-enabled pump technologies.
- The wearable injectors market in North America is expected to capture maximum share in current year, owing to the rising prevalence of chronic diseases and a favorable reimbursement landscape in this region.
- The wearable injectors market in the US is poised to grow at a higher CAGR over the forecast period, driven by the rising demand for patient-centric large-volume injectors.
- Given the robust drug development pipeline and rising focus on home-based care, the wearable injectors market is poised for substantial growth in the coming years.
Wearable Injectors Market
The market sizing and opportunity analysis has been segmented across the following parameters:
Market by Type of Device
- Patch Pumps
- Infusion Pumps
Market by Degree of Automation
- Automated / Smart Pump
- Manual Pumps
Market by Usability
- Disposable
- Reusable (Disposable Components)
Market by Therapeutic Area
- Oncological Disorders
- Cardiovascular Disorders
- Autoimmune Disorders
- Neurological Disorders
- Other Disorders
Market by Geographical Regions
- North America
- US
- Canada
- Mexico
- Europe
- France
- Germany
- UK
- Italy
- Spain
- Rest of Europe
- Asia
- China
- India
- Japan
- Pakistan
- Rest of Asia
- Middle East and North Africa
- Egypt
- Israel
- Saudi Arabia
- Latin America
- Argentina
- Brazil
Wearable Injectors Market: Key Segments
Infusion Pumps Segment Account for the Largest Market Share
The overall market for wearable insulin injectors is divided into various device types, including patch pumps and infusion pumps. According to our projections, the infusion pumps category represents around 95% of the existing market share for wearable injectors. This is due to its advantages, including their unparalleled accuracy and adaptability in administering drugs. Further, the patch pumps segment is expected to experience a higher CAGR in the future, due to the fact that they provide enhanced convenience for home use and self-administration. Their discreet design is ideal for ongoing treatments (such as diabetes and cancer), facilitating swift adoption as disease rates increase.
North America: Dominating the Market by Securing Highest Share
North America accounts for largest wearable injectors market size (with nearly 70% of the market share). Several factors, such as advanced healthcare system, high prevalence of chronic diseases and increased investment in healthcare spending are some of the prominent factors driving the market growth in this region.
Oncological Disorders Segment Dominates the Non-Insulin Wearable Injectors Market
The overall market is divided into sub-segments according to therapeutic areas, which include cancer-related disorders, heart disorders, neurological issues, autoimmune conditions, and various other disorders. Based on our analysis of the non-insulin wearable injector market, the oncological disorders segment leads the market, owing to the significant incidence of cancer and the accuracy of these devices for administering complex biologics and chemotherapy. The segment for neurological disorders is expected to grow at a greater CAGR throughout the forecast period.
Primary Research Overview
Discussions with multiple stakeholders in this domain influenced the opinions and insights presented in this study. The market report includes transcripts of the following other third-party discussions:
- Chief Executive Officer, Small Company, US
- Chief Executive Officer, Mid Sized Company, US
- Chief Executive Officer, Small Company, Denmark
- Former President and Chief Executive Officer, Mid Sized Company, US
- Vice President and Chief Scientist, Large Company, Israel
- Former Vice President and General Manager, Biologics, Very Large Company, US
- Anonymous, Large Company, Switzerland
- Engineering Project Manager / Senior System Engineer, Small Company, Switzerland
- Vice President, Marketing and Alliance Management, Mid Sized Company, US
Example Players in Wearable Injectors Market
- Becton Dickinson (BD)
- Enable Injections
- Insulet
- Medtronic
- Tandem Diabetes Care
- West Pharmaceutical Services
- Ypsomed
Wearable Injectors Market: Research Coverage
- Market Sizing and Opportunity Analysis: The report features an in-depth analysis of the wearable injectors market, focusing on key market segments, including [A] type of device [B] degree of automation, [C] usability, [D] therapeutic area, and [E] geographical regions.
- Wearable Injectors for Non-Insulin Drugs Market Landscape: A detailed overview of the overall market landscape of wearable injectors for non-insulin drugs market landscape, along with information on several relevant parameters, such as [A] type of device, [B] status of development, [C] type of drug delivery, [D] usability, [E] drug reservoir volume, type of drug molecule, [F] type of dose, [G] dose of drug, [H] mode of injection, [I] therapeutic area, [J] type of drug container, [K] mode of drug filling, [H] most active players, [I] year of establishment, [J] company size, [K] location of headquarters and [L] leading players.
- Drug Device Combinations for Non-Insulin Drugs Market Landscape: A detailed overview of the overall market landscape of wearable injectors for drug device combinations for non-insulin drugs market landscape, along with information on several relevant parameters, such as [A] type of device, [B] status of development, [C] type of drug delivery, [D] usability, [E] drug reservoir volume, type of drug molecule, [F] type of dose, [G] dose of drug, [H] mode of injection, [I] therapeutic area, [J] type of drug container, [K] mode of drug filling, [H] most active players, [I] year of establishment, [J] company size, [K] location of headquarters and [L] leading players.
- Wearable Injectors for Insulin Market Landscape: A detailed overview of the overall market landscape of wearable injectors for insulin drugs market landscape, along with information on several relevant parameters, such as [A] type of device, [B] status of development, [C] type of drug delivery, [D] usability, [E] drug reservoir volume, type of drug molecule, [F] type of dose, [G] dose of drug, [H] mode of injection, [I] therapeutic area, [J] type of drug container, [K] mode of drug filling, [H] most active players, [I] year of establishment, [J] company size, [K] location of headquarters and [L] leading players.
- Company Profiles: In-depth profiles of leading players manufacturing wearable injectors in North America, Europe and Asia-Pacific based on [A] year of establishment, [B] location of headquarters, [C] product portfolio, [D] recent developments and [E] an informed future outlook.
- Patent Analysis: An in-depth analysis of patents that have been filed / granted related to wearable injectors over the last decade across several relevant parameters, such as [A] type of patent, [B] patent publication year, [C] jurisdiction, [D] CPC symbol, [E] type of organization, [F] emerging focus area, [G] most active players, [H] patent benchmarking analysis and [I] insightful patent valuation analysis.
- Likely Drug Candidates: An overview of marketed drugs / therapies and pipeline candidates that are likely to be developed in combination with wearable injectors in the near future, identified on the basis of an in-depth analysis of potential candidates (marketed drugs and clinical-stage drugs), taking into consideration multiple parameters, such as [A] type of drug molecule, [B] phase of development, [C] indication, [D] dosing frequency, [E] type of therapy, [F] method of administration and [G] route of administration.
- Clinical Trial Analysis: A detailed analysis of completed, ongoing and planned clinical trials related to wearable injectors based on several relevant parameters, such as [A] trial recruitment status, [B] trial registration year, [C] trial phase, [D] study design, [E] type of sponsor / collaborator, [F] leading players (based on the number of registered trials), [G] key focus area, [H] therapeutic area, and [I] geography.
- Funding and Investment Analysis: An analysis of funding and investment signed in the domain based on several relevant parameters, such as [A] year of funding, [B] type of funding, [C] amount invested, [D] geography, [E] and most active players.
- SWOT Analysis: An in-depth value chain analysis featuring a discussion on various steps involved in the development of connected / smart drug delivery devices, including research and development (R&D), product manufacturing and assembly, product distribution, marketing and sales, and post-market surveillance, along with the information on cost requirements across each of the aforementioned stages.
- Regulatory and Reimbursement Landscape: A discussion on the various guidelines established by regulatory bodies for medical device approvals across North America (US, Canada and Mexico), Europe (UK, France, Germany, Italy, Spain and rest of Europe), Asia-Pacific and rest of the world (Australia, Brazil, China, India, Israel, Japan, New Zealand, Singapore, South Africa, South Korea, Taiwan, and Thailand).
- Market Impact Analysis: An in-depth analysis of the factors that can impact the growth of wearable injectors market. It also features identification and analysis of key drivers, potential restraints, emerging opportunities, and existing challenges.
Key Questions Answered in this Report
- Which are the leading companies in wearable injectors market?
- Which region dominates the wearable injectors market?
- What are the key trends observed in the wearable injectors market?
- What factors are likely to influence the evolution of this market?
- What are the primary challenges faced by wearable injectors developers?
- What is the current and future market size?
- What is the CAGR of this market?
- How is the current and future market opportunity likely to be distributed across key market segments?
Reasons to Buy this Report
- The report provides a comprehensive market analysis, offering detailed revenue projections of the overall market and its specific sub-segments. This information is valuable to both established market leaders and emerging entrants.
- The report offers stakeholders a comprehensive overview of the market, including key drivers, barriers, opportunities, and challenges. This information empowers stakeholders to stay abreast of market trends and make data-driven decisions to capitalize on growth prospects.
- The report can aid businesses in identifying future opportunities in any sector. It also helps in understanding if those opportunities are worth pursuing.
- The report helps in identifying customer demand by understanding the needs, preferences, and behavior of the target audience in order to tailor products or services effectively.
- The report equips new entrants with requisite information regarding a particular market to help them build successful business strategies.
- The report allows for more effective communication with the audience and in building strong business relations.
Additional Benefits
- Complementary PPT Insights Pack
- Complimentary Excel Data Packs for all Analytical Modules in the Report
- 15% Free Content Customization
- Detailed Report Walkthrough Session with Research Team
- Free Updated report if the report is 6-12 months old or older
TABLE OF CONTENTS
1. PREFACE
- 1.1. Introduction
- 1.2. Market Share Insights
- 1.3. Key Market Insights
- 1.4. Report Coverage
- 1.5. Key Questions Answered
- 1.6. Chapter Outlines
2. RESEARCH METHODOLOGY
- 2.1. Chapter Overview
- 2.2. Research Assumptions
- 2.2.1. Market Landscape and Market Trends
- 2.2.2. Market Forecast and Opportunity Analysis
- 2.2.3. Comparative Analysis
- 2.3. Database Building
- 2.3.1. Data Collection
- 2.3.2. Data Validation
- 2.3.3. Data Analysis
- 2.4. Project Methodology
- 2.4.1. Secondary Research
- 2.4.1.1. Annual Reports
- 2.4.1.2. Academic Research Papers
- 2.4.1.3. Company Websites
- 2.4.1.4. Investor Presentations
- 2.4.1.5. Regulatory Filings
- 2.4.1.6. White Papers
- 2.4.1.7. Industry Publications
- 2.4.1.8. Conferences and Seminars
- 2.4.1.9. Government Portals
- 2.4.1.10. Media and Press Releases
- 2.4.1.11. Newsletters
- 2.4.1.12. Industry Databases
- 2.4.1.13. Roots Proprietary Databases
- 2.4.1.14. Paid Databases and Sources
- 2.4.1.15. Social Media Portals
- 2.4.1.16. Other Secondary Sources
- 2.4.2. Primary Research
- 2.4.2.1. Types of Primary Research
- 2.4.2.1.1. Qualitative Research
- 2.4.2.1.2. Quantitative Research
- 2.4.2.1.3. Hybrid Approach
- 2.4.2.2. Advantages of Primary Research
- 2.4.2.3. Techniques for Primary Research
- 2.4.2.3.1. Interviews
- 2.4.2.3.2. Surveys
- 2.4.2.3.3. Focus Groups
- 2.4.2.3.4. Observational Research
- 2.4.2.3.5. Social Media Interactions
- 2.4.2.4. Key Opinion Leaders Considered in Primary Research
- 2.4.2.4.1. Company Executives (CXOs)
- 2.4.2.4.2. Board of Directors
- 2.4.2.4.3. Company Presidents and Vice Presidents
- 2.4.2.4.4. Research and Development Heads
- 2.4.2.4.5. Technical Experts
- 2.4.2.4.6. Subject Matter Experts
- 2.4.2.4.7. Scientists
- 2.4.2.4.8. Doctors and Other Healthcare Providers
- 2.4.2.5. Ethics and Integrity
- 2.4.2.5.1. Research Ethics
- 2.4.2.5.2. Data Integrity
- 2.4.2.1. Types of Primary Research
- 2.4.3. Analytical Tools and Databases
- 2.4.1. Secondary Research
- 2.5. Robust Quality Control
3. MARKET DYNAMICS
- 3.1. Chapter Overview
- 3.2. Forecast Methodology
- 3.2.1. Top-down Approach
- 3.2.2. Bottom-up Approach
- 3.2.3. Hybrid Approach
- 3.3. Market Assessment Framework
- 3.3.1. Total Addressable Market (TAM)
- 3.3.2. Serviceable Addressable Market (SAM)
- 3.3.3. Serviceable Obtainable Market (SOM)
- 3.3.4. Currently Acquired Market (CAM)
- 3.4. Forecasting Tools and Techniques
- 3.4.1. Qualitative Forecasting
- 3.4.2. Correlation
- 3.4.3. Regression
- 3.4.4. Extrapolation
- 3.4.5. Convergence
- 3.4.6. Sensitivity Analysis
- 3.4.7. Scenario Planning
- 3.4.8. Data Visualization
- 3.4.9. Time Series Analysis
- 3.4.10. Forecast Error Analysis
- 3.5. Key Considerations
- 3.5.1. Demographics
- 3.5.2. Government Regulations
- 3.5.3. Reimbursement Scenarios
- 3.5.4. Market Access
- 3.5.5. Supply Chain
- 3.5.6. Industry Consolidation
- 3.5.7. Pandemic / Unforeseen Disruptions Impact
- 3.6. Limitations
4. MACRO-ECONOMIC INDICATORS
- 4.1. Chapter Overview
- 4.2. Market Dynamics
- 4.2.1. Time Period
- 4.2.1.1. Historical Trends
- 4.2.1.2. Current and Forecasted Estimates
- 4.2.2. Currency Coverage
- 4.2.2.1. Major Currencies Affecting the Market
- 4.2.2.2. Factors Affecting Currency Fluctuations
- 4.2.2.3. Impact of Currency Fluctuations on the Industry
- 4.2.3. Foreign Currency Exchange Rate
- 4.2.3.1. Impact of Foreign Exchange Rate Volatility on the Market
- 4.2.3.2. Strategies for Mitigating Foreign Exchange Risk
- 4.2.4. Recession
- 4.2.4.1. Assessment of Current Economic Conditions and Potential Impact on the Market
- 4.2.4.2. Historical Analysis of Past Recessions and Lessons Learnt
- 4.2.5. Inflation
- 4.2.5.1. Measurement and Analysis of Inflationary Pressures in the Economy
- 4.2.5.2. Potential Impact of Inflation on the Market Evolution
- 4.2.6. Interest Rates
- 4.2.6.1. Interest Rates and Their Impact on the Market
- 4.2.6.2. Strategies for Managing Interest Rate Risk
- 4.2.7. Commodity Flow Analysis
- 4.2.7.1. Type of Commodity
- 4.2.7.2. Origins and Destinations
- 4.2.7.3. Values and Weights
- 4.2.7.4. Modes of Transportation
- 4.2.8. Global Trade Dynamics
- 4.2.8.1. Import Scenario
- 4.2.8.2. Export Scenario
- 4.2.8.3. Trade Policies
- 4.2.8.4. Strategies for Mitigating the Risks Associated with Trade Barriers
- 4.2.8.5. Impact of Trade Barriers on the Market
- 4.2.9. War Impact Analysis
- 4.2.9.1. Russian-Ukraine War
- 4.2.9.2. Israel-Hamas War
- 4.2.10. COVID Impact / Related Factors
- 4.2.10.1. Global Economic Impact
- 4.2.10.2. Industry-specific Impact
- 4.2.10.3. Government Response and Stimulus Measures
- 4.2.10.4. Future Outlook and Adaptation Strategies
- 4.2.11. Other Indicators
- 4.2.11.1. Fiscal Policy
- 4.2.11.2. Consumer Spending
- 4.2.11.3. Gross Domestic Product
- 4.2.11.4. Employment
- 4.2.11.5. Taxes
- 4.2.11.6. Stock Market Performance
- 4.2.11.7. Cross Border Dynamics
- 4.2.1. Time Period
- 4.3. Conclusion
5. EXECUTIVE SUMMARY
6. INTRODUCTION
- 6.1. Chapter Overview
- 6.2. Introduction to Drug Delivery Devices
- 6.3. Conventional Parenteral Drug Delivery Devices
- 6.3.1. Needlestick Injuries
- 6.3.2. Incidence and Cost Burden
- 6.3.3. Prevention of Needlestick Injuries
- 6.3.4. Government Legislations for the Prevention of Needlestick Injuries
- 6.4. Emergence of Self-Administration Devices
- 6.4.1. Key Driving Factors
- 6.4.1.1. Rising Burden of Chronic Diseases
- 6.4.1.2. Healthcare Cost Savings
- 6.4.1.3. Need for Immediate Treatment in Emergency Situations
- 6.4.1.4. Growing Injectable Drugs Market
- 6.4.1.5. Need for Improving Medication Adherence
- 6.4.1. Key Driving Factors
- 6.5. Available Self-Injection Devices
- 6.5.1. Prefilled Syringes
- 6.5.2. Pen-Injectors
- 6.5.3. Needle-Free Injectors
- 6.5.4. Autoinjectors
- 6.5.5. Wearable Injectors
- 6.6. Regulatory Considerations
- 6.6.1. Medical Devices
- 6.6.2. Drug Device Combination Products
- 6.7. Future Perspectives
7. WEARABLE INJECTORS FOR NON-INSULIN DRUGS: MARKET LANDSCAPE
- 7.1. Chapter Overview
- 7.2. Wearable Injectors for Non-Insulin Drugs: Overall Market Landscape
- 7.2.1. Analysis by Type of Device
- 7.2.2. Analysis by Status of Development
- 7.2.3. Analysis by Type of Drug Delivery
- 7.2.4. Analysis by Usability
- 7.2.5. Analysis by Drug Reservoir Volume
- 7.2.6. Analysis by Type of Drug Molecule
- 7.2.7. Analysis by Type of Dose
- 7.2.8. Analysis by Dose of Drug
- 7.2.9. Analysis by Mode of Injection
- 7.2.10. Analysis by Therapeutic Area
- 7.2.11. Analysis by Type of Drug Container
- 7.2.12. Analysis by Mode of Drug Filling
- 7.3. Wearable Injectors for Non-Insulin Drugs: Developer Landscape
- 7.3.1. Analysis by Year of Establishment
- 7.3.2. Analysis by Company Size
- 7.3.3. Analysis by Location of Headquarters
- 7.3.4. Leading Players: Analysis by Number of Wearable Injectors Developed for Non-Insulin
8. DRUG DEVICE COMBINATIONS FOR NON-INSULIN DRUGS: MARKET LANDSCAPE
- 8.1. Chapter Overview
- 8.2. Drug Device Combinations for Non-Insulin Drugs: Overall Market Landscape
- 8.2.1. Analysis by Type of Device
- 8.2.2. Analysis by Status of Development
- 8.2.3. Analysis by Type of Drug Delivery
- 8.2.4. Analysis by Usability
- 8.2.5. Analysis by Drug Reservoir Volume
- 8.2.6. Analysis by Type of Drug Molecule
- 8.2.7. Analysis by Type of Dose
- 8.2.8. Analysis by Dose of Drug
- 8.2.9. Analysis by Mode of Injection
- 8.2.10. Analysis by Therapeutic Area
- 8.2.11. Analysis by Type of Drug Container
- 8.2.12. Analysis by Mode of Drug Filling
- 8.3 Drug Device Combinations for Non-Insulin Drugs: Developer Landscape
- 8.3.1. Analysis by Year of Establishment
- 8.3.2. Analysis by Company Size
- 8.3.3. Analysis by Location of Headquarters
- 8.3.4. Device Developers: Distribution by Number of Drug Device Combination Developed
9. WEARABLE INJECTORS FOR INSULIN: MARKET LANDSCAPE
- 9.1. Chapter Overview
- 9.2. Wearable Injectors for Insulin: Overall Market Landscape
- 9.2.1. Analysis by Type of Device
- 9.2.2. Analysis by Status of Development
- 9.2.3. Analysis by Type of Insulin Delivery
- 9.2.4. Analysis by Type of Automated Insulin Delivery
- 9.2.5. Analysis by Type of Connectivity Feature
- 9.2.6. Analysis by Type of Feedback Mechanism
- 9.2.7. Analysis by Waterproofing Capability
- 9.2.8. Analysis by Usability
- 9.2.9. Analysis by Period of Use
- 9.2.10. Analysis by Type of Advanced Feature
- 9.2.11. Analysis by Type of Drug Container
- 9.2.12. Analysis by Mode of Drug Filling
- 9.2.13. Analysis by Type of Dose
- 9.2.14. Analysis by Type of Diabetes
- 9.2.15. Analysis by Availability of Connectivity Feature
- 9.3. Wearable Injectors for Insulin: Developer Landscape
- 9.3.1. Analysis by Year of Establishment
- 9.3.2. Analysis by Company Size
- 9.3.3. Analysis by Location of Headquarters
- 9.3.4. Leading Players: Analysis by Number of Wearable Injectors Developed for Insulin
10. PRODUCT COMPETITIVENESS ANALYSIS
- 10.1. Chapter Overview
- 10.2. Assumptions / Key Parameters
- 10.3. Methodology
- 10.4. Product Competitiveness Analysis
- 10.4.1. Product Competitiveness Analysis: Wearable Injectors for Non-Insulin Drugs
- 10.4.2. Product Competitiveness Analysis: Drug Device Combinations for Non-Insulin Drugs
- 10.4.3. Product Competitiveness Analysis: Wearable Injectors for Insulin
11. WEARABLE INJECTOR DEVELOPERS: COMPANY PROFILES
- 11.1. Chapter Overview
- 11.2. Key Players Developing Wearable Injectors for Non-Insulin
- 11.2.1. CCBio
- 11.2.1.1. Company Overview
- 11.2.1.2. Product Portfolio
- 11.2.1.3. Recent Developments and Future Outlook
- 11.2.2. E3D Elcam Drug Delivery Devices
- 11.2.3. Enable Injections
- 11.2.4. Gerresheimer
- 11.2.5. Sonceboz
- 11.2.6. Weibel CDS (Acquired by SHL Medical)
- 11.2.7. West Pharmaceuticals
- 11.2.1. CCBio
- 11.3. Key Players Developing Wearable Injectors for Insulin
- 11.3.1. CeQur
- 11.3.2. Debiotech
- 11.3.3. Eli Lilly
- 11.3.4. Insulet
- 11.3.5. Medtronic
- 11.3.6. Medtrum Technologies
- 11.3.7. PharmaSens
- 11.3.8. Roche
- 11.3.9. SOOIL Development
12. DRUG-DEVICE COMBINATIONS: DEVICE PROFILES
- 12.1. Chapter Overview
- 12.2. Neulasta(R) (pegfilgrastim) OnPro(TM) Kit
- 12.3. D-mine(R) Pump
- 12.4. Lasix(R) ONYU
- 12.5. The LUTREPULSE(R) System
- 12.6. ND0612L Next generation patch pump
- 12.7. Unnamed (Developed by Phillips Medisize)
- 12.8. FUROSCIX(R)
- 12.9. SMT-201 Pump
- 12.10. SMT-301 Pump
- 12.11. ULTOMRIS(R) Smartdose Injector (ravulizumab-cwvz)
- 12.12. EMPAVELI(R) Injector
- 12.13. SKYRIZI(R) On Body Injector (risankizumab)
- 12.14. VYALEV(TM) Pump (foscarbidopa and foslevodopa)
- 12.15. UDENYCA(R) on-body injector
- 12.16. ONAPGO(TM)
- 12.17. Remunity(R) Pump
- 12.18. G-Lasta(R) BodyPod
- 12.19. Sarclisa (isatuximab) On-Body Injector
13. PARTNERSHIPS AND COLLABORATIONS
- 13.1. Chapter Overview
- 13.2. Partnership Models
- 13.3. Wearable Injectors: Partnerships and Collaborations
- 13.3.1. Analysis by Year of Partnership
- 13.3.2. Analysis by Type of Partnership
- 13.3.3. Analysis by Year and Type of Partnership
- 13.3.4. Analysis by Type of Partner
- 13.3.5. Analysis by Type of Device
- 13.3.6. Most Active Players: Analysis by Number of Partnerships
- 13.3.7. Analysis by Geography
- 13.3.7.1. Local and International Agreements
- 13.3.7.2. Intercontinental and Intracontinental Agreements
14. KEY ACQUISITION TARGETS
- 14.1. Chapter Overview
- 14.2. Scope and Methodology
- 14.3. Scoring Criteria and Key Assumptions
- 14.4. Potential Acquisition Targets: Non-Insulin Drug Delivery Device Developers
- 14.5. Potential Acquisition Targets: Insulin Drug Delivery Device Developers
- 14.6. Concluding Remarks
15. PATENT ANALYSIS
- 15.1. Chapter Overview
- 15.2. Scope and Methodology
- 15.3. Wearable Injectors: Patent Analysis
- 15.3.1. Analysis by Type of Patent
- 15.3.2. Analysis by Patent Publication Year
- 15.3.3. Analysis by Patent Application Year
- 15.3.4. Analysis of Granted Patents and Patent Applications by Publication Year
- 15.3.5. Analysis by Jurisdiction
- 15.3.6. Analysis by Type of Applicant
- 15.3.7. Analysis by Patent Age
- 15.3.8. Analysis by CPC Symbol
- 15.3.9. Most Active Players: Analysis by Number of Patents
- 15.4. Wearable Injectors: Patent Benchmarking Analysis
- 15.4.1. Analysis by Patent Characteristics
- 15.5. Patent Valuation
- 15.6. Leading Patents by Number of Citations
16. WEARABLE INJECTORS: LIKELY DRUG CANDIDATES
- 16.1. Chapter Overview
- 16.2. Marketed Drugs
- 16.2.1. Most Likely Candidates for Delivery via Wearable Injectors
- 16.2.2. Likely Candidates for Delivery via Wearable Injectors
- 16.2.3. Less Likely Candidates for Delivery via Wearable Injectors
- 16.2.4. Least Likely Candidates for Delivery via Wearable Injectors
- 16.3. Clinical Stage Drugs
- 16.3.1. Most Likely Candidates for Delivery via Wearable Injectors
- 16.3.2. Likely Candidates for Delivery via Wearable Injectors
- 16.3.3. Less Likely Candidates for Delivery via Wearable Injectors
- 16.3.4. Least Likely Candidates for Delivery via Wearable Injectors
17. CLINICAL TRIAL ANALYSIS
- 17.1. Chapter Overview
- 17.2. Scope and Methodology
- 17.3. Wearable Injectors: Clinical Trial Analysis
- 17.3.1. Analysis by Trial Recruitment Status
- 17.3.2. Analysis by Trial Registration Year
- 17.3.3. Analysis of Enrolled Patient Population by Trial Registration Year
- 17.3.4. Analysis by Trial Phase
- 17.3.5. Analysis of Enrolled Patient Population by Trial Phase
- 17.3.6. Analysis by Trial Registration Year and Trial Recruitment Status
- 17.3.7. Analysis by Study Design
- 17.3.8. Analysis by Type of Sponsor / Collaborator
- 17.3.9. Analysis by Therapeutic Area
- 17.3.10. Most Active Players: Analysis by Number of Registered Trials
- 17.3.11. Most Popular Wearable Injectors: Analysis by Number of Registered Trials
- 17.3.12. Analysis by Geography
- 17.3.12.1. Analysis by Trial Recruitment Status and Geography
- 17.3.12.2. Analysis of Enrolled Patient Population by Trial Recruitment Status and Geography
18. FUNDING AND INVESTMENT ANALYSIS
- 18.1. Chapter Overview
- 18.2. Types of Funding
- 18.3. Wearable Injectors: Funding and Investment Analysis
- 18.3.1. Analysis by Year of Funding
- 18.3.2. Analysis of Amount Invested by Year
- 18.3.3. Analysis by Type of Funding
- 18.3.4. Analysis by Type of Device
- 18.3.5. Analysis of Amount Invested by Year and Type of Funding
- 18.3.6. Analysis of Amount Invested by Type of Device
- 18.3.7. Analysis by Target Disease Indication
- 18.3.8. Most Active Players: Analysis by Number of Funding Instances
- 18.3.9. Most Active Players: Analysis by Amount Invested
- 18.3.10. Leading Investors: Analysis by Number of Funding Instances
- 18.3.11. Analysis by Geography
19. SWOT ANALYSIS
- 19.1. Chapter Overview
- 19.2. SWOT Analysis
- 19.2.1. Strengths
- 19.2.2. Weaknesses
- 19.2.3. Opportunities
- 19.2.4. Threats
- 19.3. Wearable Injectors: Future Growth Opportunities
- 19.3.1. Rising Focus on Self-Administration of Drugs
- 19.3.2. Possibility of Integration with Mobile Applications
- 19.3.3. Potential Life Cycle Management Tool
- 19.3.4. Potential Usability for Multiple Therapeutic Areas
20. CASE STUDY: ROLE OF CONTRACT MANUFACTURING ORGANIZATIONS IN DEVICE DEVELOPMENT SUPPLY CHAIN
- 20.1. Chapter Overview
- 20.2. Device Development Supply Chain
- 20.3. Role of Contract Manufacturing Organizations (CMOs) in Device Development
- 20.4. List of CMOs
- 20.4.1. Geographical Distribution of CMOs
- 20.5. Medical Devices Design and Development Service Providers
21. REGULATORY AND REIMBURSEMENT LANDSCAPE FOR MEDICAL DEVICES
- 21.1. Chapter Overview
- 21.2. General Regulatory and Reimbursement Guidelines for Medical Devices
- 21.3. Regulatory and Reimbursement Landscape in North America
- 21.3.1. The US Scenario
- 21.3.1.1. Regulatory Authority
- 21.3.1.2. Review / Approval Process
- 21.3.1.3. Reimbursement Landscape
- 21.3.1.3.1. Payer Mix
- 21.3.1.3.2. Reimbursement Process
- 21.3.2. The Canadian Scenario
- 21.3.2.1. Regulatory Authority
- 21.3.2.2. Review / Approval Process
- 21.3.2.3. Reimbursement Landscape
- 21.3.2.3.1. Payer Mix
- 21.3.2.3.2. Reimbursement Process
- 21.3.3. The Mexican Scenario
- 21.3.3.1. Regulatory Authority
- 21.3.3.2. Review / Approval Process
- 21.3.3.3. Reimbursement Landscape
- 21.3.3.3.1. Payer Mix
- 21.3.1. The US Scenario
- 21.4. Regulatory and Reimbursement Landscape in Europe
- 21.4.1. Overall Scenario
- 21.4.1.1. Overall Regulatory Authority
- 21.4.1.2. Overall Review / Approval Process
- 21.4.2. The UK Scenario
- 21.4.2.1. Regulatory Authority
- 21.4.2.2. Review / Approval Process
- 21.4.2.3. Reimbursement Landscape
- 21.4.2.3.1. Payer Mix
- 21.4.2.3.2. Reimbursement Process
- 21.4.3. The French Scenario
- 21.4.3.1. Regulatory Authority
- 21.4.3.2. Review / Approval Process
- 21.4.3.3. Reimbursement Landscape
- 21.4.3.3.1. Payer Mix
- 21.4.3.3.2. Reimbursement Process
- 21.4.4. The German Scenario
- 21.4.4.1. Regulatory Authority
- 21.4.4.2. Review / Approval Process
- 21.4.4.3. Reimbursement Landscape
- 21.4.4.3.1. Payer Mix
- 21.4.4.3.2. Reimbursement Process
- 21.4.5. The Italian Scenario
- 21.4.5.1. Regulatory Authority
- 21.4.5.2. Review / Approval Process
- 21.4.5.3. Reimbursement Landscape
- 21.4.5.3.1. Payer Mix
- 21.4.5.3.2. Reimbursement Process
- 21.4.6. The Spanish Scenario
- 21.4.6.1. Regulatory Authority
- 21.4.6.2. Review / Approval Process
- 21.4.6.3. Reimbursement Landscape
- 21.4.6.3.1. Payer Mix
- 21.4.6.3.2. Reimbursement Process
- 21.4.1. Overall Scenario
- 21.5. Regulatory and Reimbursement Landscape in Asia-Pacific and Rest of the World
- 21.5.1. The Australian Scenario
- 21.5.1.1. Regulatory Authority
- 21.5.1.2. Review / Approval Process
- 21.5.1.3. Reimbursement Landscape
- 21.5.1.3.1. Payer Mix
- 21.5.1.3.2. Reimbursement Process
- 21.5.2. The Brazilian Scenario
- 21.5.2.1. Regulatory Authority
- 21.5.2.2. Review / Approval Process
- 21.5.2.3. Reimbursement Landscape
- 21.5.2.3.1. Payer Mix
- 21.5.2.3.2. Reimbursement Process
- 21.5.3. The Chinese Scenario
- 21.5.3.1. Regulatory Authority
- 21.5.3.2. Review / Approval Process
- 21.5.3.3. Reimbursement Landscape
- 21.5.3.3.1. Payer Mix
- 21.5.3.3.2. Reimbursement Process
- 21.5.1. The Australian Scenario
22. MARKET IMPACT ANALYSIS: DRIVERS, RESTRAINTS, OPPORTUNITIES AND CHALLENGES
- 22.1. Chapter Overview
- 22.2. Market Drivers
- 22.3. Market Restraints
- 22.4. Market Opportunities
- 22.5. Market Challenges
- 22.6. Conclusion
23. WEARABLE INJECTORS MARKET FOR NON-INSULIN DRUGS
- 23.1. Chapter Overview
- 23.2. Key Assumptions and Methodology
- 23.3. Global Wearable Injectors Market for Non-Insulin Drugs, Historical Trends (Since 2022) and Forecasted Estimates (Till 2035) (By Value)
- 23.3.1. Scenario Analysis
- 23.3.1.1. Conservative Scenario
- 23.3.1.2. Optimistic Scenario
- 23.3.1. Scenario Analysis
- 23.4. Global Wearable Injectors Market for Non-Insulin Drugs, Historical Trends (Since 2022) and Forecasted Estimates (Till 2035) (By Volume)
- 23.4.1. Scenario Analysis
- 23.4.1.1. Conservative Scenario
- 23.4.1.2. Optimistic Scenario
- 23.4.1. Scenario Analysis
- 23.5. Key Market Segmentations
24. WEARABLE INJECTORS MARKET FOR NON-INSULIN DRUGS, BY TYPE OF DEVICE
- 24.1. Chapter Overview
- 24.2. Key Assumptions and Methodology
- 24.3. Wearable Injectors Market for Non-Insulin Drugs: Distribution by Type of Device (By Value)
- 24.3.1. Wearable Patch Pump Market for Non-Insulin Drugs, Historical Trends (Since 2022) and Forecasted Estimates (Till 2035) (By Value)
- 24.3.2. Wearable Infusion Pump Market for Non-Insulin Drugs, Historical Trends (Since 2022) and Forecasted Estimates (Till 2035) (By Value)
- 24.4. Wearable Injectors Market for Non-Insulin Drugs: Distribution by Type of Device (By Volume)
- 24.4.1. Wearable Patch Pump Market for Non-Insulin Drugs, Historical Trends (Since 2022) and Forecasted Estimates (Till 2035) (By Volume)
- 24.4.2. Wearable Infusion Pump Market for Non-Insulin Drugs, Historical Trends (Since 2022) and Forecasted Estimates (Till 2035) (By Volume)
- 24.5. Data Triangulation and Validation
25. WEARABLE INJECTORS MARKET FOR NON-INSULIN DRUGS, BY USABILITY
- 25.1. Chapter Overview
- 25.2. Key Assumptions and Methodology
- 25.3. Wearable Injectors Market for Non-Insulin Drugs: Distribution by Usability (By Value)
- 25.3.1. Disposable Wearable Injectors Market for Non-Insulin Drugs, Historical Trends (Since 2022) and Forecasted Estimates (Till 2035) (By Value)
- 25.3.2. Reusable / Disposable Components Wearable Injectors Market for Non-Insulin Drugs, Historical Trends (Since 2022) and Forecasted Estimates (Till 2035) (By Value)
- 25.4. Wearable Injectors Market for Non-Insulin Drugs: Distribution by Usability (By Volume)
- 25.4.1. Disposable Wearable Injectors Market for Non-Insulin Drugs, Historical Trends (Since 2022) and Forecasted Estimates (Till 2035) (By Volume)
- 25.4.2. Reusable / Disposable Components Wearable Injectors Market for Non-Insulin Drugs, Historical Trends (Since 2022) and Forecasted Estimates (Till 2035) (By Volume)
- 25.5. Data Triangulation and Validation
26. WEARABLE INJECTORS MARKET FOR NON-INSULIN DRUGS, BY THERAPEUTIC AREA
- 26.1. Chapter Overview
- 26.2. Key Assumptions and Methodology
- 26.3. Wearable Injectors Market for Non-Insulin Drugs: Distribution by Therapeutic Area (By Value)
- 26.3.1. Wearable Injectors Market for Non-Insulin Drugs Targeting Oncological Disorders, Historical Trends (Since 2022) and Forecasted Estimates (Till 2035) (By Value)
- 26.3.2. Wearable Injectors Market for Non-Insulin Drugs Targeting Cardiovascular Disorders, Historical Trends (Since 2022) and Forecasted Estimates (Till 2035) (By Value)
- 26.3.3. Wearable Injectors Market for Non-Insulin Drugs Targeting Autoimmune Disorders, Historical Trends (Since 2022) and Forecasted Estimates (Till 2035) (By Value)
- 26.3.4. Wearable Injectors Market for Non-Insulin Drugs Targeting Neurological Disorders, Historical Trends (Since 2022) and Forecasted Estimates (Till 2035) (By Value)
- 26.3.5. Wearable Injectors Market for Non-Insulin Drugs Targeting Other Disorders, Historical Trends (Since 2022) and Forecasted Estimates (Till 2035) (By Value)
- 26.4. Wearable Injectors Market for Non-Insulin Drugs: Distribution by Therapeutic Area (By Volume)
- 26.4.1. Wearable Injectors Market for Non-Insulin Drugs Targeting Oncological Disorders, Historical Trends (Since 2022) and Forecasted Estimates (Till 2035) (By Volume)
- 26.4.2. Wearable Injectors Market for Non-Insulin Drugs Targeting Cardiovascular Disorders, Historical Trends (Since 2022) and Forecasted Estimates (Till 2035) (By Volume)
- 26.4.3. Wearable Injectors Market for Non-Insulin Drugs Targeting Autoimmune Disorders, Historical Trends (Since 2022) and Forecasted Estimates (Till 2035) (By Volume)
- 26.4.4. Wearable Injectors Market for Non-Insulin Drugs Targeting Neurological Disorders, Historical Trends (Since 2022) and Forecasted Estimates (Till 2035) (By Volume)
- 26.4.5. Wearable Injectors Market for Non-Insulin Drugs Targeting Other Disorders, Historical Trends (Since 2022) and Forecasted Estimates (Till 2035) (By Volume)
- 26.5. Data Triangulation and Validation
27. WEARABLE INJECTORS MARKET FOR NON-INSULIN DRUGS, BY GEOGRAPHICAL REGIONS
- 27.1. Chapter Overview
- 27.2. Key Assumptions and Methodology
- 27.3. Wearable Injectors Market for Non-Insulin Drugs: Distribution by Geographical Regions (By Value)
- 27.3.1. Wearable Injectors Market for Non-Insulin Drugs in North America, Historical Trends (Since 2022) and Forecasted Estimates (Till 2035) (By Value)
- 27.3.2. Wearable Injectors Market for Non-Insulin Drugs in Europe, Historical Trends (Since 2022) and Forecasted Estimates (Till 2035) (By Value)
- 27.3.3. Wearable Injectors Market for Non-Insulin Drugs in Asia, Historical Trends (Since 2022) and Forecasted Estimates (Till 2035) (By Value)
- 27.3.4. Wearable Injectors Market for Non-Insulin Drugs in Latin America, Historical Trends (Since 2022) and Forecasted Estimates (Till 2035) (By Value)
- 27.3.5. Wearable Injectors Market for Non-Insulin Drugs in Middle East and North Africa, Historical Trends (Since 2022) and Forecasted Estimates (Till 2035) (By Value)
- 27.4. Wearable Injectors Market for Non-Insulin Drugs: Distribution by Geographical Regions (By Volume)
- 27.4.1. Wearable Injectors Market for Non-Insulin Drugs in North America, Historical Trends (Since 2022) and Forecasted Estimates (Till 2035) (By Volume)
- 27.4.2. Wearable Injectors Market for Non-Insulin Drugs in Europe, Historical Trends (Since 2022) and Forecasted Estimates (Till 2035) (By Volume)
- 27.4.3. Wearable Injectors Market for Non-Insulin Drugs in Asia, Historical Trends (Since 2022) and Forecasted Estimates (Till 2035) (By Volume)
- 27.4.4. Wearable Injectors Market for Non-Insulin Drugs in Latin America, Historical Trends (Since 2022) and Forecasted Estimates (Till 2035) (By Volume)
- 27.4.5. Wearable Injectors Market for Non-Insulin Drugs in Middle East and North Africa, Historical Trends (Since 2022) and Forecasted Estimates (Till 2035) (By Volume)
- 27.5. Market Dynamics Assessment
- 27.5.1. Penetration Growth (P-G) Matrix
- 27.5.2. Market Movement Analysis
- 27.6. Data Triangulation and Validation
28. WEARABLE INJECTORS MARKET FOR INSULIN
- 28.1. Chapter Overview
- 28.2. Key Assumptions and Methodology
- 28.3. Global Wearable Injectors Market for Insulin, Historical Trends (Since 2022) and Forecasted Estimates (Till 2035) (By Value)
- 28.3.1. Scenario Analysis
- 28.3.1.1. Conservative Scenario
- 28.3.1.2. Optimistic Scenario
- 28.3.1. Scenario Analysis
- 28.4. Global Wearable Injectors Market for Insulin, Historical Trends (Since 2022) and Forecasted Estimates (Till 2035) (By Volume)
- 28.4.1. Scenario Analysis
- 28.4.1.1. Conservative Scenario
- 28.4.1.2. Optimistic Scenario
- 28.4.1. Scenario Analysis
- 28.5. Key Market Segmentations
29. WEARABLE INJECTORS MARKET FOR INSULIN, BY TYPE OF DEVICE
- 29.1. Chapter Overview
- 29.2. Key Assumptions and Methodology
- 29.3. Wearable Injectors Market for Insulin: Distribution by Type of Device (By Value)
- 29.3.1. Wearable Patch Pump Market for Insulin, Historical Trends (Since 2022) and Forecasted Estimates (Till 2035) (By Value)
- 29.3.2. Wearable Infusion Pump Market for Insulin, Historical Trends (Since 2022) and Forecasted Estimates (Till 2035) (By Value)
- 29.4. Wearable Injectors Market for Insulin: Distribution by Type of Device (By Volume)
- 29.4.1. Wearable Patch Pump Market for Insulin, Historical Trends (Since 2022) and Forecasted Estimates (Till 2035) (By Volume)
- 29.4.2. Wearable Infusion Pump Market for Insulin, Historical Trends (Since 2022) and Forecasted Estimates (Till 2035) (By Volume)
- 29.5. Data Triangulation and Validation
30. WEARABLE INJECTORS MARKET FOR INSULIN, BY DEGREE OF AUTOMATION
- 30.1. Chapter Overview
- 30.2. Key Assumptions and Methodology
- 30.3. Wearable Injectors Market for Insulin: Distribution by Degree of Automation (By Value)
- 30.3.1. Automated / Smart Wearable Injectors Market for Insulin, Historical Trends (Since 2022) and Forecasted Estimates (Till 2035) (By Value)
- 30.3.2. Manual Wearable Injectors Market for Insulin, Historical Trends (Since 2022) and Forecasted Estimates (Till 2035) (By Value)
- 30.4. Wearable Injectors Market for Insulin: Distribution by Degree of Automation (By Volume)
- 30.4.1. Automated / Smart Wearable Injectors Market for Insulin, Historical Trends (Since 2022) and Forecasted Estimates (Till 2035) (By Volume)
- 30.4.2. Manual Wearable Injectors Market for Insulin, Historical Trends (Since 2022) and Forecasted Estimates (Till 2035) (By Volume)
- 30.5. Data Triangulation and Validation
31. WEARABLE INJECTORS MARKET FOR INSULIN, BY GEOGRAPHICAL REGIONS
- 31.1. Chapter Overview
- 31.2. Key Assumptions and Methodology
- 31.3. Wearable Injectors Market for Insulin: Distribution by Geographical Regions (By Value)
- 31.3.1. Wearable Injectors Market for Insulin in North America, Historical Trends (Since 2022) and Forecasted Estimates (Till 2035) (By Value)
- 31.3.1.1. Wearable Injectors Market for Insulin in the US, Historical Trends (Since 2022) and Forecasted Estimates (Till 2035) (By Value)
- 31.3.1.2. Wearable Injectors Market for Insulin in Canada, Historical Trends (Since 2022) and Forecasted Estimates (Till 2035) (By Value)
- 31.3.2. Wearable Injectors Market for Insulin in Europe, Historical Trends (Since 2022) and Forecasted Estimates (Till 2035) (By Value)
- 31.3.2.1. Wearable Injectors Market for Insulin in Germany, Historical Trends (Since 2022) and Forecasted Estimates (Till 2035) (By Value)
- 31.3.2.2. Wearable Injectors Market for Insulin in the UK, Historical Trends (Since 2022) and Forecasted Estimates (Till 2035) (By Value)
- 31.3.2.3. Wearable Injectors Market for Insulin in Spain, Historical Trends (Since 2022) and Forecasted Estimates (Till 2035) (By Value)
- 31.3.2.4. Wearable Injectors Market for Insulin in France, Historical Trends (Since 2022) and Forecasted Estimates (Till 2035) (By Value)
- 31.3.2.5. Wearable Injectors Market for Insulin in Italy, Historical Trends (Since 2022) and Forecasted Estimates (Till 2035) (By Value)
- 31.3.2.6. Wearable Injectors Market for Insulin in Rest of Europe, Historical Trends (Since 2022) and Forecasted Estimates (Till 2035) (By Value)
- 31.3.3. Wearable Injectors Market for Insulin in Asia, Historical Trends (Since 2022) and Forecasted Estimates (Till 2035) (By Value)
- 31.3.3.1. Wearable Injectors Market for Insulin in China, Historical Trends (Since 2022) and Forecasted Estimates (Till 2035) (By Value)
- 31.3.3.2. Wearable Injectors Market for Insulin in India, Historical Trends (Since 2022) and Forecasted Estimates (Till 2035) (By Value)
- 31.3.3.3. Wearable Injectors Market for Insulin in Japan, Historical Trends (Since 2022) and Forecasted Estimates (Till 2035) (By Value)
- 31.3.3.4. Wearable Injectors Market for Insulin in Pakistan, Historical Trends (Since 2022) and Forecasted Estimates (Till 2035) (By Value)
- 31.3.3.5. Wearable Injectors Market for Insulin in Rest of Asia, Historical Trends (Since 2022) and Forecasted Estimates (Till 2035) (By Value)
- 31.3.4. Wearable Injectors Market for Insulin in Latin America, Historical Trends (Since 2022) and Forecasted Estimates (Till 2035) (By Value)
- 31.3.4.1. Wearable Injectors Market for Insulin in Brazil, Historical Trends (Since 2022) and Forecasted Estimates (Till 2035) (By Value)
- 31.3.4.2. Wearable Injectors Market for Insulin in Mexico, Historical Trends (Since 2022) and Forecasted Estimates (Till 2035) (By Value)
- 31.3.4.3. Wearable Injectors Market for Insulin in Argentina, Historical Trends (Since 2022) and Forecasted Estimates (Till 2035) (By Value)
- 31.3.5. Wearable Injectors Market for Insulin in Middle East and North Africa, Historical Trends (Since 2022) and Forecasted Estimates (Till 2035) (By Value)
- 31.3.5.1. Wearable Injectors Market for Insulin in Saudi Arabia, Historical Trends (Since 2022) and Forecasted Estimates (Till 2035) (By Value)
- 31.3.5.2. Wearable Injectors Market for Insulin in Israel, Historical Trends (Since 2022) and Forecasted Estimates (Till 2035) (By Value)
- 31.3.5.3. Wearable Injectors Market for Insulin in Egypt, Historical Trends (Since 2022) and Forecasted Estimates (Till 2035) (By Value)
- 31.3.1. Wearable Injectors Market for Insulin in North America, Historical Trends (Since 2022) and Forecasted Estimates (Till 2035) (By Value)
- 31.4. Wearable Injectors Market for Insulin: Distribution by Geographical Regions (By Volume)
- 31.4.1. Wearable Injectors Market for Insulin in North America, Historical Trends (Since 2022) and Forecasted Estimates (Till 2035) (By Volume)
- 31.4.1.1. Wearable Injectors Market for Insulin in the US, Historical Trends (Since 2022) and Forecasted Estimates (Till 2035) (By Volume)
- 31.4.1.2. Wearable Injectors Market for Insulin in Canada, Historical Trends (Since 2022) and Forecasted Estimates (Till 2035) (By Volume)
- 31.4.2. Wearable Injectors Market for Insulin in Europe, Historical Trends (Since 2022) and Forecasted Estimates (Till 2035) (By Volume)
- 31.4.2.1. Wearable Injectors Market for Insulin in Germany, Historical Trends (Since 2022) and Forecasted Estimates (Till 2035) (By Volume)
- 31.4.2.2. Wearable Injectors Market for Insulin in the UK, Historical Trends (Since 2022) and Forecasted Estimates (Till 2035) (By Volume)
- 31.4.2.3. Wearable Injectors Market for Insulin in Spain, Historical Trends (Since 2022) and Forecasted Estimates (Till 2035) (By Volume)
- 31.4.2.4. Wearable Injectors Market for Insulin in France, Historical Trends (Since 2022) and Forecasted Estimates (Till 2035) (By Volume)
- 31.4.2.5. Wearable Injectors Market for Insulin in Italy, Historical Trends (Since 2022) and Forecasted Estimates (Till 2035) (By Volume)
- 31.4.2.6. Wearable Injectors Market for Insulin in Rest of Europe, Historical Trends (Since 2022) and Forecasted Estimates (Till 2035) (By Volume)
- 31.4.3. Wearable Injectors Market for Insulin in Asia, Historical Trends (Since 2022) and Forecasted Estimates (Till 2035) (By Volume)
- 31.4.3.1. Wearable Injectors Market for Insulin in China, Historical Trends (Since 2022) and Forecasted Estimates (Till 2035) (By Volume)
- 31.4.3.2. Wearable Injectors Market for Insulin in India, Historical Trends (Since 2022) and Forecasted Estimates (Till 2035) (By Volume)
- 31.4.3.3. Wearable Injectors Market for Insulin in Japan, Historical Trends (Since 2022) and Forecasted Estimates (Till 2035) (By Volume)
- 31.4.3.4. Wearable Injectors Market for Insulin in Pakistan, Historical Trends (Since 2022) and Forecasted Estimates (Till 2035) (By Volume)
- 31.4.3.5. Wearable Injectors Market for Insulin in Rest of Asia, Historical Trends (Since 2022) and Forecasted Estimates (Till 2035) (By Volume)
- 31.4.4. Wearable Injectors Market for Insulin in Latin America, Historical Trends (Since 2022) and Forecasted Estimates (Till 2035) (By Volume)
- 31.4.4.1. Wearable Injectors Market for Insulin in Brazil, Historical Trends (Since 2022) and Forecasted Estimates (Till 2035) (By Volume)
- 31.4.4.2. Wearable Injectors Market for Insulin in Mexico, Historical Trends (Since 2022) and Forecasted Estimates (Till 2035) (By Volume)
- 31.4.4.3. Wearable Injectors Market for Insulin in Argentina, Historical Trends (Since 2022) and Forecasted Estimates (Till 2035) (By Volume)
- 31.4.5. Wearable Injectors Market for Insulin in Middle East and North Africa, Historical Trends (Since 2022) and Forecasted Estimates (Till 2035) (By Volume)
- 31.4.5.1. Wearable Injectors Market for Insulin in Saudi Arabia, Historical Trends (Since 2022) and Forecasted Estimates (Till 2035) (By Volume)
- 31.4.5.2. Wearable Injectors Market for Insulin in Israel, Historical Trends (Since 2022) and Forecasted Estimates (Till 2035) (By Volume)
- 31.4.5.3. Wearable Injectors Market for Insulin in Egypt, Historical Trends (Since 2022) and Forecasted Estimates (Till 2035) (By Volume)
- 31.4.1. Wearable Injectors Market for Insulin in North America, Historical Trends (Since 2022) and Forecasted Estimates (Till 2035) (By Volume)
- 31.5. Market Dynamics Assessment
- 31.5.1. Penetration Growth (P-G) Matrix
- 31.5.2. Market Movement Analysis
- 31.6. Data Triangulation and Validation
32. CONCLUDING INSIGHTS
33. EXECUTIVE INSIGHTS
34. APPENDIX I: TABULATED DATA
35. APPENDIX II: LIST OF COMPANIES AND ORGANIZATIONS
List of Tables
- Table 7.1 Wearable Injectors for Non-Insulin Drugs: Information on Status of Development, Type of Device and Usability
- Table 7.2 Wearable Injectors for Non-Insulin Drugs: Information on Type of Dose, Type of Drug Container and Mode of Drug Filling
- Table 7.3 Wearable Injectors for Non-Insulin Drugs: Information on Container Volume, Route of Administration and Mode of Injection
- Table 7.4 Wearable Injectors for Non-Insulin Drugs: Information on Mechanism of Action / Driving Force and Type of Technology
- Table 7.5 Wearable Injectors for Non-Insulin Drugs: Information on Availability of Connectivity Feature and Type of Compatible Drug
- Table 7.6 Wearable Injectors for Non-Insulin Drugs: Information on Compatibility with High Viscosity Drugs and Therapeutic Area
- Table 7.7 Wearable Injectors for Non-Insulin Drugs: Information on Device Developer, Year of Establishment, Company Size, and Location of Headquarters
- Table 8.1 Drug Device Combinations for Non-Insulin Drugs: Information on Status of Development, Type of Device and Usability
- Table 8.2 Drug Device Combinations for Non-Insulin Drugs: Information on Type of Dose, Mode of Drug Filling, Type of Drug Container and Container Volume
- Table 8.3 Drug Device Combinations for Non-Insulin Drugs: Information on Route of Administration, Mode of Injection and Type of Compatible Drug
- Table 8.4 Drug Device Combinations for Non-Insulin Drugs: Information on Drug Delivery Technology, Mechanism of Action / Driving Force and Therapeutic Area
- Table 8.5 Drug Device Combinations for Non-Insulin Drugs: Information on Device Developer, Year of Establishment, Company Size, and Location of Headquarters
- Table 9.1 Wearable Injectors for Insulin: Information on Status of Development, Type of Device and Type of Insulin Delivery
- Table 9.2 Wearable Injectors for Insulin: Information on Type of Automated Insulin Delivery, Type of Connectivity Feature and Type of Feedback Mechanism
- Table 9.3 Wearable Injectors for Insulin: Information on Waterproofing Capability, Usability and Period of Use
- Table 9.4 Wearable Injectors for Insulin: Information on Type of Advanced Feature, Type of Drug Container and Mode of Drug Filling
- Table 9.5 Wearable Injectors for Insulin: Information on Type of Dose, Type of Diabetes and Availability of Connectivity Feature
- Table 9.6 Wearable Injectors for Insulin: Information on Device Developer, Year of Establishment, Company Size, and Location of Headquarters
- Table 11.1 Wearable Injector Developers: List of Companies Profiled
- Table 11.2 CCBio: Company Overview
- Table 11.3 CCBio: Device Portfolio
- Table 11.4 CCBio: Recent Developments and Future Outlook
- Table 11.5 E3D Elcam Drug Delivery Device: Company Overview
- Table 11.6 E3D Elcam Drug Delivery Device: Device Portfolio
- Table 11.7 E3D Elcam Drug Delivery Devices: Recent Developments and Future Outlook
- Table 11.8 Enable Injections: Company Overview
- Table 11.9 Enable Injections: Device Portfolio
- Table 11.10 Enable Injections: Recent Developments and Future Outlook
- Table 11.11 Gerresheimer: Company Overview
- Table 11.12 Gerresheimer: Device Portfolio
- Table 11.13 Gerresheimer: Recent Developments and Future Outlook
- Table 11.14 Sonceboz: Company Overview
- Table 11.15 Sonceboz: Device Portfolio
- Table 11.16 Sonceboz: Recent Developments and Future Outlook
- Table 11.17 Weibel CDS: Company Overview
- Table 11.18 Weibel CDS: Device Portfolio
- Table 11.19 Weibel CDS: Developments and Future Outlook
- Table 11.20 West Pharmaceuticals: Company Overview
- Table 11.21 West Pharmaceuticals: Device Portfolio
- Table 11.22 West Pharmaceuticals: Developments and Future Outlook
- Table 11.23 CeQur: Company Overview
- Table 11.24 CeQur: Device Portfolio
- Table 11.25 CeQur: Developments and Future Outlook
- Table 11.26 Eli Lilly: Company Overview
- Table 11.27 Eli Lilly: Device Portfolio
- Table 11.28 Eli Lilly: Developments and Future Outlook
- Table 11.29 Insulet: Company Overview
- Table 11.30 Insulet: Device Portfolio
- Table 11.31 Insulet: Developments and Future Outlook
- Table 11.32 Medtronic: Company Overview
- Table 11.33 Medtronic: Device Portfolio
- Table 11.34 Medtronic: Developments and Future Outlook
- Table 11.35 Medtrum Technologies: Company Overview
- Table 11.36 Medtrum Technologies: Device Portfolio
- Table 11.37 Medtrum Technologies: Developments and Future Outlook
- Table 11.38 Roche: Company Overview
- Table 11.39 Roche: Device Portfolio
- Table 11.40 Roche: Developments and Future Outlook
- Table 11.41 SOOIL Development: Company Overview
- Table 11.42 SOOIL Development: Device Portfolio
- Table 11.43 SOOIL Development: Developments and Future Outlook
- Table 12.1 Drug Device Combination: 3 mL Micropump (Furosemide)
- Table 12.2 Drug Device Combination: 3M hMTS (Adalimumab)
- Table 12.3 Drug Device Combination: D-mine Pump (Apomorphine)
- Table 12.4 Drug Device Combination: On-body Infusor (Furosemide)
- Table 12.5 Drug Device Combination: Herceptin SC Injector (Herceptin)
- Table 12.6 Drug Device Combination: ND0712H Belt Pump (Levodopa / Carbidopa)
- Table 12.7 Drug Device Combination: ND0712L belt pump (Levodopa / Carbidopa)
- Table 12.8 Drug Device Combination: ND0712L next generation patch pump (Levodopa / Carbidopa)
- Table 12.9 Drug Device Combination: ND0801 (Apomorphine)
- Table 12.10 Drug Device Combination: ND0901 (Levodopa / Carbidopa)
- Table 12.11 Drug Device Combination: Neulasta Onpro On-Body Injector (Neulasta)
- Table 12.12 Drug Device Combination: Pushtronex System (Repatha)
- Table 12.13 Drug Device Combination: SMT-201 (Ketorolac)
- Table 12.14 Drug Device Combination: SMT-301 (Bupivacaine)
- Table 12.15 Drug Device Combination: The LUTREPULSE System (Lutrepulse)
- Table 12.16 Drug Device Combination: Trevyent (Treprostinil)
- Table 12.17 Drug Device Combination: Ultomris (Ravulizumab)
- Table 13.1 Wearable Injectors: List of Partnerships and Collaborations, 2018-2021
- Table 14.1 Wearable Injectors: List of Key Acquisitions, 2000-2023
- Table 14.2 Non-Insulin Drug Delivery Devices: Likelihood of Players for Acquisition
- Table 14.3 Insulin Delivery Devices: Likelihood of Players for Acquisition
- Table 15.1 Patent Analysis: Prominent CPC Symbols
- Table 15.2 Patent Analysis: List of Top CPC Symbols
- Table 15.3 Patent Analysis: Most Popular CPC Symbols
- Table 15.4 Patent Analysis: Summary of Benchmarking Analysis
- Table 15.5 Patent Analysis: Categorization based on Weighted Valuation Scores
- Table 15.6 Patent Analysis: List of Leading Patents (by Highest Relative Valuation)
- Table 16.1 Marketed Drugs: Most Likely Candidates for Delivery via Wearable Injectors
- Table 16.2 Marketed Drugs: Likely Candidates for Delivery via Wearable Injectors
- Table 16.3 Marketed Drugs: Less Likely Candidates for Delivery via Wearable Injectors
- Table 16.4 Marketed Drugs: Least Likely Candidates for Delivery via Wearable Injectors
- Table 16.5 Clinical Stage Drugs: Most Likely Candidates for Delivery via Wearable Injectors
- Table 16.6 Clinical Stage Drugs: Likely Candidates for Delivery via Wearable Injectors
- Table 16.7 Clinical Stage Drugs: Less Likely Candidates for Delivery via Wearable Injectors
- Table 16.8 Clinical Stage Drugs: Least Likely Candidates for Delivery via Wearable Injectors
- Table 18.1 List of Funding Instances: Information on Company, Year of Funding, Type, Amount Invested and Investors
- Table 20.1 List of Contract Manufacturing Organizations
- Table 20.2 List of Medical Device Product Design and Development Companies
- Table 21.1 General Guidelines for Market Authorization and Reimbursement for Medical Devices
- Table 21.2 Device Classification: US
- Table 21.3 Device Classification: Canada
- Table 21.4 Data Requirements and Characteristics of Province-wide HTA Processes in Canada
- Table 21.5 Device Classification: Mexico
- Table 21.6 Device Classification: Europe
- Table 21.7 List of CE Directives in Europe
- Table 21.8 Conformity Assessment Modules in Europe
- Table 21.9 Device Classification: Australia
- Table 21.10 Medical Devices Reimbursement and Pricing Approval Process: Australia
- Table 21.11 Device Classification: Brazil
- Table 21.12 Device Classification: China
- Table 21.13 Device Classification: India
- Table 21.14 Device Classification: Japan
- Table 21.15 Medical Devices Reimbursement Categories
- Table 21.16 Device Classification: Medsafe
- Table 21.17 Device Classification: Singapore
- Table 21.18 Device Classification: South Korea
- Table 21.19 Device Classification: South Africa
- Table 21.20 Device Classification: Thailand
- Table 21.21 Medical Devices Regulatory Landscape Summary
- Table 21.22 Medical Devices Reimbursement Landscape Summary
- Table 25.1 Company Snapshot: Company A
- Table 25.2 Company Snapshot: Company B
- Table 25.3 Company Snapshot: Company C
- Table 25.4 Company Snapshot: Company D
- Table 25.5 Company Snapshot: Company E
- Table 25.6 Company Snapshot: Company F
- Table 25.7 Company Snapshot: Company G
- Table 25.8 Company Snapshot: Company H
- Table 25.9 Company Snapshot: Company I
- Table 25.10 Company Snapshot: Company J
- Table 34.1 Wearable Injectors for Non-Insulin Drugs: Distribution by Type of Device
- Table 34.2 Wearable Injectors for Non-Insulin Drugs: Distribution by Status of Development
- Table 34.3 Wearable Injectors for Non-Insulin Drugs: Distribution by Mode of Drug Filling
- Table 34.4 Wearable Injectors for Non-Insulin Drugs: Distribution by Type of Drug Delivery
- Table 34.5 Wearable Injectors for Non-Insulin Drugs: Distribution by Usability
- Table 34.6 Wearable Injectors for Non-Insulin Drugs: Distribution by Drug Reservoir Volume
- Table 34.7 Wearable Injectors for Non-Insulin Drugs: Distribution by Type of Drug Molecule
- Table 34.8 Wearable Injectors for Non-Insulin Drugs: Distribution by Type of Dose
- Table 34.9 Wearable Injectors for Non-Insulin Drugs: Distribution by Dose of Drug
- Table 34.10 Wearable Injectors for Non-Insulin Drugs: Distribution by Mode of Injection
- Table 34.11 Wearable Injectors for Non-Insulin Drugs: Distribution by Therapeutic Area
- Table 34.12 Wearable Injectors for Non-Insulin Drugs: Distribution by Type of Drug Container
- Table 34.13 Wearable Injectors for Non-Insulin Drugs: Distribution by Mode of Drug Filling
- Table 34.14 Wearable Injectors for Non-Insulin Drug Developers: Distribution by Year of Establishment
- Table 34.15 Wearable Injectors for Non-Insulin Drug Developers: Distribution by Company Size
- Table 34.16 Wearable Injectors for Non-Insulin Drug Developers: Distribution by Location of Headquarters
- Table 34.17 Leading Players: Distribution by Number of Wearable Injectors Developed for Non-Insulin
- Table 34.18 Drug Device Combinations for Non-Insulin Drugs: Distribution by Type of Device
- Table 34.19 Drug Device Combinations for Non-Insulin Drugs: Distribution by Status of Development
- Table 34.20 Drug Device Combinations for Non-Insulin Drugs: Distribution by Type of Drug Delivery
- Table 34.21 Drug Device Combinations for Non-Insulin Drugs: Distribution by Usability
- Table 34.22 Drug Device Combinations for Non-Insulin Drugs: Distribution by Drug Reservoir Volume
- Table 34.23 Drug Device Combinations for Non-Insulin Drugs: Distribution by Type of Drug Molecule
- Table 34.24 Drug Device Combinations for Non-Insulin Drugs: Distribution by Type of Dose
- Table 34.25 Drug Device Combinations for Non-Insulin Drugs: Distribution by Dose of Drug
- Table 34.26 Drug Device Combinations for Non-Insulin Drugs: Distribution by Mode of Injection
- Table 34.27 Drug Device Combinations for Non-Insulin Drugs: Distribution by Therapeutic Area
- Table 34.28 Drug Device Combinations for Non-Insulin Drugs: Distribution by Type of Drug Container
- Table 34.29 Drug Device Combinations for Non-Insulin Drugs: Distribution by Mode of Drug Filling
- Table 34.30 Drug Device Combinations for Non-Insulin Drug Developers: Distribution by Year of Establishment
- Table 34.31 Drug Device Combinations for Non-Insulin Drug Developers: Distribution by Company Size
- Table 34.32 Drug Device Combinations for Non-Insulin Drug Developers: Distribution by Location of Headquarters
- Table 34.33 Device Developers: Distribution by Number of Drug Device Combination Developed
- Table 34.34 Wearable Injectors for Insulin: Distribution by Type of Device
- Table 34.35 Wearable Injectors for Insulin: Distribution by Status of Development
- Table 34.36 Wearable Injectors for Insulin: Distribution by Type of Insulin Delivery
- Table 34.37 Wearable Injectors for Insulin: Distribution by Type of Automated Insulin Delivery
- Table 34.38 Wearable Injectors for Insulin: Distribution by Type of Connectivity Feature
- Table 34.39 Wearable Injectors for Insulin: Distribution by Waterproof Capability
- Table 34.40 Wearable Injectors for Insulin: Distribution by Usability
- Table 34.41 Wearable Injectors for Insulin: Distribution by Period of Use
- Table 34.42 Wearable Injectors for Insulin: Distribution by Type of Advanced Feature
- Table 34.43 Wearable Injectors for Insulin: Distribution by Type of Drug Container
- Table 34.44 Wearable Injectors for Insulin: Distribution by Mode of Drug Filling
- Table 34.45 Wearable Injectors for Insulin: Distribution by Type of Dose
- Table 34.46 Wearable Injectors for Insulin: Distribution by Type of Diabetes
- Table 34.47 Wearable Injectors for Insulin: Distribution by Availability of Connectivity Feature
- Table 34.48 Wearable Injectors for Insulin Drug Developers: Distribution by Year of Establishment
- Table 34.49 Wearable Injectors for Insulin Drug Developers: Distribution by Company Size
- Table 34.50 Wearable Injectors for Insulin Drug Developers: Distribution by Location of Headquarters
- Table 34.51 Leading Players: Distribution by Number of Wearable Injectors for Insulin
- Table 34.52 Product Competitiveness Analysis: Wearable Injectors for Non-Insulin Drugs
- Table 34.53 Product Competitiveness Analysis: Drug Device Combinations for Non-Insulin Drugs
- Table 34.54 Product Competitiveness Analysis: Wearable Injectors for Insulin
- Table 34.55 Gerresheimer: Annual Revenues, FY 2022 Onwards (EUR Million)
- Table 34.56 West Pharmaceuticals: Annual Revenues, FY 2022 Onwards (USD Billion)
- Table 34.57 Eli Lilly: Annual Revenues, FY 2022 Onwards (USD Billion)
- Table 34.58 Insulet: Annual Revenues, FY 2022 Onwards (USD Million)
- Table 34.59 Medtronic: Annual Revenues, FY 2022 Onwards (USD Billion)
- Table 34.60 Roche: Annual Revenues, FY 2022 Onwards (CHF Billion)
- Table 34.61 Partnerships and Collaborations: Cumulative Year-wise Trend, Since 2015
- Table 34.62 Partnerships and Collaborations: Distribution by Type of Partnership
- Table 34.63 Partnerships and Collaborations: Distribution by Year and Type of Partnership, Since 2015
- Table 34.64 Partnerships and Collaborations: Distribution by Partner
- Table 34.65 Partnerships and Collaborations: Distribution by Year of Partnership and Type of Partner
- Table 34.66 Partnerships and Collaborations: Distribution by Type of Device
- Table 34.67 Most Active Players: Distribution by Number of Partnerships
- Table 34.68 Most Active Players: Distribution by Type of Partnership
- Table 34.69 Partnerships and Collaborations: Local and International Agreements
- Table 34.70 Partnerships and Collaborations: Intercontinental and Intracontinental Agreements
- Table 34.71 Patent Analysis: Distribution by Type of Patent
- Table 34.72 Patent Analysis: Distribution by Patent Publication Year
- Table 34.73 Patent Analysis: Distribution by Patent Application Year
- Table 34.74 Patent Analysis: Distribution by Granted Patents and Patent Applications by Publication Year
- Table 34.75 Patent Analysis: Distribution by Jurisdiction
- Table 34.76 Patent Analysis: Distribution by Type of Applicant
- Table 34.77 Leading Industry Players: Distribution by Number of Patents
- Table 34.78 Leading Non-Industry Players: Distribution by Number of Patents
- Table 34.79 Leading Individual Assignees: Distribution by Number of Patents
- Table 34.80 Patent Analysis: Distribution by Patent Age
- Table 34.81 Wearable Injectors: Patent Valuation
- Table 34.82 Clinical Trial Analysis: Distribution by Trial Recruitment Status
- Table 34.83 Clinical Trial Analysis: Cumulative Distribution by Trial Registration Year
- Table 34.84 Clinical Trial Analysis: Distribution of Enrolled Patient Population by Trial Registration Year
- Table 34.85 Clinical Trial Analysis: Distribution by Trial Phase
- Table 34.86 Clinical Trial Analysis: Distribution of Enrolled Patient Population by Trial Phase
- Table 34.87 Clinical Trial Analysis: Cumulative Distribution by Trial Registration Year and Trial Recruitment Status
- Table 34.88 Clinical Trial Analysis: Distribution by Study Design
- Table 34.89 Clinical Trial Analysis: Distribution by Type of Sponsor / Collaborator
- Table 34.90 Clinical Trial Analysis: Distribution by Therapeutic Area
- Table 34.91 Most Active Players: Distribution by Number of Registered Trials
- Table 34.92 Most Popular Wearable Injectors: Distribution by Number of Registered Trials
- Table 34.93 Clinical Trial Analysis: Geographical Distribution by Number of Clinical Trials
- Table 34.94 Clinical Trial Analysis: Distribution of Enrolled Patient Population by Trial Recruitment Status and Geography
- Table 34.95 Funding and Investment Analysis: Distribution of Year of Funding, Since 2014
- Table 34.96 Funding and Investment Analysis: Distribution of Amount Invested by Year, Since 2014 (USD Million)
- Table 34.97 Funding and Investment Analysis: Distribution by Type of Funding
- Table 34.98 Funding and Investment Analysis: Distribution by Type of Device
- Table 34.99 Funding and Investment Analysis: Year-wise Distribution by Type of Funding and Amount Raised (USD Million)
- Table 34.100 Funding and Investment Analysis: Distribution by Target Disease Indication
- Table 34.101 Most Active Players: Distribution by Number of Funding Instances
- Table 34.102 Most Active Players: Distribution by Amount Invested
- Table 34.103 Leading Investors: Distribution by Number of Funding Instances
- Table 34.104 Funding and Investments: Distribution by Geography
- Table 34.105 Global Wearable Injectors Market for Non-Insulin Drugs, Historical Trends (Since 2022) and Forecasted Estimates (Till 2035) (By Value)
- Table 34.106 Global Wearable Injectors Market for Non-Insulin Drugs, Historical Trends (Since 2022) and Forecasted Estimates (Till 2035) (By Volume)
- Table 34.107 Wearable Injectors Market for Non-Insulin Drugs: Distribution by Type of Device (By Value)
- Table 34.108 Wearable Patch Pump Market for Non-Insulin Drugs, Historical Trends (Since 2022) and Forecasted Estimates (Till 2035) (By Value)
- Table 34.109 Wearable Infusion Pump Market for Non-Insulin Drugs, Historical Trends (Since 2022) and Forecasted Estimates (Till 2035) (By Value)
- Table 34.110 Wearable Injectors Market for Non-Insulin Drugs: Distribution by Type of Device (By Volume)
- Table 34.111 Wearable Patch Pump Market for Non-Insulin Drugs, Historical Trends (Since 2022) and Forecasted Estimates (Till 2035) (By Volume)
- Table 34.112 Wearable Infusion Pump Market for Non-Insulin Drugs, Historical Trends (Since 2022) and Forecasted Estimates (Till 2035) (By Volume)
- Table 34.113 Wearable Injectors Market for Non-Insulin Drugs: Distribution by Usability (By Value)
- Table 34.114 Disposable Wearable Injectors Market for Non-Insulin Drugs, Historical Trends (Since 2022) and Forecasted Estimates (Till 2035) (By Value)
- Table 34.115 Reusable / Disposable Components Wearable Injectors Market for Non-Insulin Drugs, Historical Trends (Since 2022) and Forecasted Estimates (Till 2035) (By Value)
- Table 34.116 Wearable Injectors Market for Non-Insulin Drugs: Distribution by Usability (By Volume)
- Table 34.117 Disposable Wearable Injectors Market for Non-Insulin Drugs, Historical Trends (Since 2022) and Forecasted Estimates (Till 2035) (By Volume)
- Table 34.118 Reusable / Disposable Components Wearable Injectors Market for Non-Insulin Drugs, Historical Trends (Since 2022) and Forecasted Estimates (Till 2035) (By Volume)
- Table 34.119 Wearable Injectors Market for Non-Insulin Drugs: Distribution by Therapeutic Area (By Value)
- Table 34.120 Wearable Injectors Market for Non-Insulin Drugs Targeting Oncological Disorders, Historical Trends (Since 2022) and Forecasted Estimates (Till 2035) (By Value)
- Table 34.121 Wearable Injectors Market for Non-Insulin Drugs Targeting Cardiovascular Disorders, Historical Trends (Since 2022) and Forecasted Estimates (Till 2035) (By Value)
- Table 34.122 Wearable Injectors Market for Non-Insulin Drugs Targeting Autoimmune Disorders, Historical Trends (Since 2022) and Forecasted Estimates (Till 2035) (By Value)
- Table 34.123 Wearable Injectors Market for Non-Insulin Drugs Targeting Neurological Disorders, Historical Trends (Since 2022) and Forecasted Estimates (Till 2035) (By Value)
- Table 34.124 Wearable Injectors Market for Non-Insulin Drugs Targeting Other Disorders, Historical Trends (Since 2022) and Forecasted Estimates (Till 2035) (By Value)
- Table 34.125 Wearable Injectors Market for Non-Insulin Drugs: Distribution by Therapeutic Area (By Volume)
- Table 34.126 Wearable Injectors Market for Non-Insulin Drugs Targeting Oncological Disorders, Historical Trends (Since 2022) and Forecasted Estimates (Till 2035) (By Volume)
- Table 34.127 Wearable Injectors Market for Non-Insulin Drugs Targeting Cardiovascular Disorders, Historical Trends (Since 2022) and Forecasted Estimates (Till 2035) (By Volume)
- Table 34.128 Wearable Injectors Market for Non-Insulin Drugs Targeting Autoimmune Disorders, Historical Trends (Since 2022) and Forecasted Estimates (Till 2035) (By Volume)
- Table 34.129 Wearable Injectors Market for Non-Insulin Drugs Targeting Neurological Disorders, Historical Trends (Since 2022) and Forecasted Estimates (Till 2035) (By Volume)
- Table 34.130 Wearable Injectors Market for Non-Insulin Drugs Targeting Other Disorders, Historical Trends (Since 2022) and Forecasted Estimates (Till 2035) (By Volume)
- Table 34.131 Wearable Injectors Market for Non-Insulin Drugs: Distribution by Geographical Regions (By Value)
- Table 34.132 Wearable Injectors Market for Non-Insulin Drugs in North America, Historical Trends (Since 2022) and Forecasted Estimates (Till 2035) (By Value)
- Table 34.133 Wearable Injectors Market for Non-Insulin Drugs in Europe, Historical Trends (Since 2022) and Forecasted Estimates (Till 2035) (By Value)
- Table 34.134 Wearable Injectors Market for Non-Insulin Drugs in Asia, Historical Trends (Since 2022) and Forecasted Estimates (Till 2035) (By Value)
- Table 34.135 Wearable Injectors Market for Non-Insulin Drugs in Latin America, Historical Trends (Since 2022) and Forecasted Estimates (Till 2035) (By Value)
- Table 34.136 Wearable Injectors Market for Non-Insulin Drugs in Middle East and North Africa, Historical Trends (Since 2022) and Forecasted Estimates (Till 2035) (By Value)
- Table 34.137 Wearable Injectors Market for Non-Insulin Drugs: Distribution by Geographical Regions (By Volume)
- Table 34.138 Wearable Injectors Market for Non-Insulin Drugs in North America, Historical Trends (Since 2022) and Forecasted Estimates (Till 2035) (By Volume)
- Table 34.139 Wearable Injectors Market for Non-Insulin Drugs in Europe, Historical Trends (Since 2022) and Forecasted Estimates (Till 2035) (By Volume)
- Table 34.140 Wearable Injectors Market for Non-Insulin Drugs in Asia, Historical Trends (Since 2022) and Forecasted Estimates (Till 2035) (By Volume)
- Table 34.141 Wearable Injectors Market for Non-Insulin Drugs in Latin America, Historical Trends (Since 2022) and Forecasted Estimates (Till 2035) (By Volume)
- Table 34.142 Wearable Injectors Market for Non-Insulin Drugs in Middle East and North Africa, Historical Trends (Since 2022) and Forecasted Estimates (Till 2035) (By Volume)
- Table 34.143 Global Wearable Injectors Market for Insulin, Historical Trends (Since 2022) and Forecasted Estimates (Till 2035) (By Value)
- Table 34.144 Global Wearable Injectors Market for Insulin, Historical Trends (Since 2022) and Forecasted Estimates (Till 2035) (By Volume)
- Table 34.145 Wearable Injectors Market for Insulin: Distribution by Type of Device (By Value)
- Table 34.146 Wearable Patch Pump Market for Insulin, Historical Trends (Since 2022) and Forecasted Estimates (Till 2035) (By Value)
- Table 34.147 Wearable Infusion Pump Market for Insulin, Historical Trends (Since 2022) and Forecasted Estimates (Till 2035) (By Value)
- Table 34.148 Wearable Injectors Market for Insulin: Distribution by Type of Device (By Volume)
- Table 34.149 Wearable Patch Pump Market for Insulin, Historical Trends (Since 2022) and Forecasted Estimates (Till 2035) (By Volume)
- Table 34.150 Wearable Infusion Pump Market for Insulin, Historical Trends (Since 2022) and Forecasted Estimates (Till 2035) (By Volume)
- Table 34.151 Wearable Injectors Market for Insulin: Distribution by Degree of Automation (By Value)
- Table 34.152 Automated / Smart Wearable Injectors Market for Insulin, Historical Trends (Since 2022) and Forecasted Estimates (Till 2035) (By Value)
- Table 34.153 Manual Wearable Injectors Market for Insulin, Historical Trends (Since 2022) and Forecasted Estimates (Till 2035) (By Value)
- Table 34.154 Wearable Injectors Market for Insulin: Distribution by Degree of Automation (By Volume)
- Table 34.155 Automated / Smart Wearable Injectors Market for Insulin, Historical Trends (Since 2022) and Forecasted Estimates (Till 2035) (By Volume)
- Table 34.156 Manual Wearable Injectors Market for Insulin, Historical Trends (Since 2022) and Forecasted Estimates (Till 2035) (By Volume)
- Table 34.157 Wearable Injectors Market for Insulin: Distribution by Geographical Regions (By Value)
- Table 34.158 Wearable Injectors Market for Insulin in North America, Historical Trends (Since 2022) and Forecasted Estimates (Till 2035) (By Value)
- Table 34.159 Wearable Injectors Market for Insulin in the US, Historical Trends (Since 2022) and Forecasted Estimates (Till 2035) (By Value)
- Table 34.160 Wearable Injectors Market for Insulin in Canada, Historical Trends (Since 2022) and Forecasted Estimates (Till 2035) (By Value)
- Table 34.161 Wearable Injectors Market for Insulin in Europe, Historical Trends (Since 2022) and Forecasted Estimates (Till 2035) (By Value)
- Table 34.162 Wearable Injectors Market for Insulin in Germany, Historical Trends (Since 2022) and Forecasted Estimates (Till 2035) (By Value)
- Table 34.163 Wearable Injectors Market for Insulin in the UK, Historical Trends (Since 2022) and Forecasted Estimates (Till 2035) (By Value)
- Table 34.164 Wearable Injectors Market for Insulin in Spain, Historical Trends (Since 2022) and Forecasted Estimates (Till 2035) (By Value)
- Table 34.165 Wearable Injectors Market for Insulin in France, Historical Trends (Since 2022) and Forecasted Estimates (Till 2035) (By Value)
- Table 34.166 Wearable Injectors Market for Insulin in Italy, Historical Trends (Since 2022) and Forecasted Estimates (Till 2035) (By Value)
- Table 34.167 Wearable Injectors Market for Insulin in Rest of Europe, Historical Trends (Since 2022) and Forecasted Estimates (Till 2035) (By Value)
- Table 34.168 Wearable Injectors Market for Insulin in Asia, Historical Trends (Since 2022) and Forecasted Estimates (Till 2035) (By Value)
- Table 34.169 Wearable Injectors Market for Insulin in China, Historical Trends (Since 2022) and Forecasted Estimates (Till 2035) (By Value)
- Table 34.170 Wearable Injectors Market for Insulin in India, Historical Trends (Since 2022) and Forecasted Estimates (Till 2035) (By Value)
- Table 34.171 Wearable Injectors Market for Insulin in Japan, Historical Trends (Since 2022) and Forecasted Estimates (Till 2035) (By Value)
- Table 34.172 Wearable Injectors Market for Insulin in Pakistan, Historical Trends (Since 2022) and Forecasted Estimates (Till 2035) (By Value)
- Table 34.173 Wearable Injectors Market for Insulin in Rest of Asia, Historical Trends (Since 2022) and Forecasted Estimates (Till 2035) (By Value)
- Table 34.174 Wearable Injectors Market for Insulin in Latin America, Historical Trends (Since 2022) and Forecasted Estimates (Till 2035) (By Value)
- Table 34.175 Wearable Injectors Market for Insulin in Brazil, Historical Trends (Since 2022) and Forecasted Estimates (Till 2035) (By Value)
- Table 34.176 Wearable Injectors Market for Insulin in Mexico, Historical Trends (Since 2022) and Forecasted Estimates (Till 2035) (By Value)
- Table 34.177 Wearable Injectors Market for Insulin in Argentina, Historical Trends (Since 2022) and Forecasted Estimates (Till 2035) (By Value)
- Table 34.178 Wearable Injectors Market for Insulin in Middle East and North Africa, Historical Trends (Since 2022) and Forecasted Estimates (Till 2035) (By Value)
- Table 34.179 Wearable Injectors Market for Insulin in Saudi Arabia, Historical Trends (Since 2022) and Forecasted Estimates (Till 2035) (By Value)
- Table 34.180 Wearable Injectors Market for Insulin in Israel, Historical Trends (Since 2022) and Forecasted Estimates (Till 2035) (By Value)
- Table 34.181 Wearable Injectors Market for Insulin in Egypt, Historical Trends (Since 2022) and Forecasted Estimates (Till 2035) (By Value)
- Table 34.182 Wearable Injectors Market for Insulin: Distribution by Geographical Regions (By Volume)
- Table 34.183 Wearable Injectors Market for Insulin in North America, Historical Trends (Since 2022) and Forecasted Estimates (Till 2035) (By Volume)
- Table 34.184 Wearable Injectors Market for Insulin in the US, Historical Trends (Since 2022) and Forecasted Estimates (Till 2035) (By Volume)
- Table 34.185 Wearable Injectors Market for Insulin in Canada, Historical Trends (Since 2022) and Forecasted Estimates (Till 2035) (By Volume)
- Table 34.186 Wearable Injectors Market for Insulin in Europe, Historical Trends (Since 2022) and Forecasted Estimates (Till 2035) (By Volume)
- Table 34.187 Wearable Injectors Market for Insulin in Germany, Historical Trends (Since 2022) and Forecasted Estimates (Till 2035) (By Volume)
- Table 34.188 Wearable Injectors Market for Insulin in the UK, Historical Trends (Since 2022) and Forecasted Estimates (Till 2035) (By Volume)
- Table 34.189 Wearable Injectors Market for Insulin in Spain, Historical Trends (Since 2022) and Forecasted Estimates (Till 2035) (By Volume)
- Table 34.190 Wearable Injectors Market for Insulin in France, Historical Trends (Since 2022) and Forecasted Estimates (Till 2035) (By Volume)
- Table 34.191 Wearable Injectors Market for Insulin in Italy, Historical Trends (Since 2022) and Forecasted Estimates (Till 2035) (By Volume)
- Table 34.192 Wearable Injectors Market for Insulin in Rest of Europe, Historical Trends (Since 2022) and Forecasted Estimates (Till 2035) (By Volume)
- Table 34.193 Wearable Injectors Market for Insulin in Asia, Historical Trends (Since 2022) and Forecasted Estimates (Till 2035) (By Volume)
- Table 34.194 Wearable Injectors Market for Insulin in China, Historical Trends (Since 2022) and Forecasted Estimates (Till 2035) (By Volume)
- Table 34.195 Wearable Injectors Market for Insulin in India, Historical Trends (Since 2022) and Forecasted Estimates (Till 2035) (By Volume)
- Table 34.196 Wearable Injectors Market for Insulin in Japan, Historical Trends (Since 2022) and Forecasted Estimates (Till 2035) (By Volume)
- Table 34.197 Wearable Injectors Market for Insulin in Pakistan, Historical Trends (Since 2022) and Forecasted Estimates (Till 2035) (By Volume)
- Table 34.198 Wearable Injectors Market for Insulin in Rest of Asia, Historical Trends (Since 2022) and Forecasted Estimates (Till 2035) (By Volume)
- Table 34.199 Wearable Injectors Market for Insulin in Latin America, Historical Trends (Since 2022) and Forecasted Estimates (Till 2035) (By Volume)
- Table 34.200 Wearable Injectors Market for Insulin in Brazil, Historical Trends (Since 2022) and Forecasted Estimates (Till 2035) (By Volume)
- Table 34.201 Wearable Injectors Market for Insulin in Mexico, Historical Trends (Since 2022) and Forecasted Estimates (Till 2035) (By Volume)
- Table 34.202 Wearable Injectors Market for Insulin in Argentina, Historical Trends (Since 2022) and Forecasted Estimates (Till 2035) (By Volume)
- Table 34.203 Wearable Injectors Market for Insulin in Middle East and North Africa, Historical Trends (Since 2022) and Forecasted Estimates (Till 2035) (By Volume)
- Table 34.204 Wearable Injectors Market for Insulin in Saudi Arabia, Historical Trends (Since 2022) and Forecasted Estimates (Till 2035) (By Volume)
- Table 34.205 Wearable Injectors Market for Insulin in Israel, Historical Trends (Since 2022) and Forecasted Estimates (Till 2035) (By Volume)
- Table 34.206 Wearable Injectors Market for Insulin in Egypt, Historical Trends (Since 2022) and Forecasted Estimates (Till 2035) (By Volume)
List of Figures
- Figure 2.1 Research Methodology: Project Methodology
- Figure 2.2 Research Methodology: Data Sources for Secondary Research
- Figure 2.3 Research Methodology: Robust Quality Control
- Figure 3.1 Market Dynamics: Forecast Methodology
- Figure 3.2 Market Dynamics: Market Assessment Framework
- Figure 4.1 Lessons Learnt from Past Recessions
- Figure 5.1 Executive Summary: Market Landscape
- Figure 5.2 Executive Summary: Market Trends
- Figure 5.3 Executive Summary: Market Forecast and Opportunity Analysis
- Figure 6.1 Drug Delivery Systems
- Figure 6.2 Evolution of Healthcare Safety Legislations
- Figure 6.3 Wearable Injectors Market: Key Driving Factors
- Figure 6.4 Types of Self-Injection Devices
- Figure 7.1 Wearable Injectors for Non-Insulin Drugs: Distribution by Type of Device
- Figure 7.2 Wearable Injectors for Non-Insulin Drugs: Distribution by Status of Development
- Figure 7.3 Wearable Injectors for Non-Insulin Drugs: Distribution by Mode of Drug Filling
- Figure 7.4 Wearable Injectors for Non-Insulin Drugs: Distribution by Type of Drug Delivery
- Figure 7.5 Wearable Injectors for Non-Insulin Drugs: Distribution by Usability
- Figure 7.6 Wearable Injectors for Non-Insulin Drugs: Distribution by Drug Reservoir Volume
- Figure 7.7 Wearable Injectors for Non-Insulin Drugs: Distribution by Type of Drug Molecule
- Figure 7.8 Wearable Injectors for Non-Insulin Drugs: Distribution by Type of Dose
- Figure 7.9 Wearable Injectors for Non-Insulin Drugs: Distribution by Dose of Drug
- Figure 7.10 Wearable Injectors for Non-Insulin Drugs: Distribution by Mode of Injection
- Figure 7.11 Wearable Injectors for Non-Insulin Drugs: Distribution by Therapeutic Area
- Figure 7.12 Wearable Injectors for Non-Insulin Drugs: Distribution by Type of Drug Container
- Figure 7.13 Wearable Injectors for Non-Insulin Drugs: Distribution by Mode of Drug Filling
- Figure 7.14 Wearable Injectors for Non-Insulin Drug Developers: Distribution by Year of Establishment
- Figure 7.15 Wearable Injectors for Non-Insulin Drug Developers: Distribution by Company Size
- Figure 7.16 Wearable Injectors for Non-Insulin Drug Developers: Distribution by Location of Headquarters
- Figure 7.17 Leading Players: Distribution by Number of Wearable Injectors Developed for Non-Insulin
- Figure 8.1 Drug Device Combinations for Non-Insulin Drugs: Distribution by Type of Device
- Figure 8.2 Drug Device Combinations for Non-Insulin Drugs: Distribution by Status of Development
- Figure 8.3 Drug Device Combinations for Non-Insulin Drugs: Distribution by Type of Drug Delivery
- Figure 8.4 Drug Device Combinations for Non-Insulin Drugs: Distribution by Usability
- Figure 8.5 Drug Device Combinations for Non-Insulin Drugs: Distribution by Drug Reservoir Volume
- Figure 8.6 Drug Device Combinations for Non-Insulin Drugs: Distribution by Type of Drug Molecule
- Figure 8.7 Drug Device Combinations for Non-Insulin Drugs: Distribution by Type of Dose
- Figure 8.8 Drug Device Combinations for Non-Insulin Drugs: Distribution by Dose of Drug
- Figure 8.9 Drug Device Combinations for Non-Insulin Drugs: Distribution by Mode of Injection
- Figure 8.10 Drug Device Combinations for Non-Insulin Drugs: Distribution by Therapeutic Area
- Figure 8.11 Drug Device Combinations for Non-Insulin Drugs: Distribution by Type of Drug Container
- Figure 8.12 Drug Device Combinations for Non-Insulin Drugs: Distribution by Mode of Drug Filling
- Figure 8.13 Drug Device Combinations for Non-Insulin Drug Developers: Distribution by Year of Establishment
- Figure 8.14 Drug Device Combinations for Non-Insulin Drug Developers: Distribution by Company Size
- Figure 8.15 Drug Device Combinations for Non-Insulin Drug Developers: Distribution by Location of Headquarters
- Figure 8.16 Device Developers: Distribution by Number of Drug Device Combination Developed
- Figure 9.1 Wearable Injectors for Insulin: Distribution by Type of Device
- Figure 9.2 Wearable Injectors for Insulin: Distribution by Status of Development
- Figure 9.3 Wearable Injectors for Insulin: Distribution by Type of Insulin Delivery
- Figure 9.4 Wearable Injectors for Insulin: Distribution by Type of Automated Insulin Delivery
- Figure 9.5 Wearable Injectors for Insulin: Distribution by Type of Connectivity Feature
- Figure 9.6 Wearable Injectors for Insulin: Distribution by Waterproof Capability
- Figure 9.7 Wearable Injectors for Insulin: Distribution by Usability
- Figure 9.8 Wearable Injectors for Insulin: Distribution by Period of Use
- Figure 9.9 Wearable Injectors for Insulin: Distribution by Type of Advanced Feature
- Figure 9.10 Wearable Injectors for Insulin: Distribution by Type of Drug Container
- Figure 9.11 Wearable Injectors for Insulin: Distribution by Mode of Drug Filling
- Figure 9.12 Wearable Injectors for Insulin: Distribution by Type of Dose
- Figure 9.13 Wearable Injectors for Insulin: Distribution by Type of Diabetes
- Figure 9.14 Wearable Injectors for Insulin: Distribution by Availability of Connectivity Feature
- Figure 9.15 Wearable Injectors for Insulin Drug Developers: Distribution by Year of Establishment
- Figure 9.16 Wearable Injectors for Insulin Drug Developers: Distribution by Company Size
- Figure 9.17 Wearable Injectors for Insulin Drug Developers: Distribution by Location of Headquarters
- Figure 9.18 Leading Players: Distribution by Number of Wearable Injectors for Insulin
- Figure 10.1 Product Competitiveness Analysis: Wearable Injectors for Non-Insulin Drugs
- Figure 10.2 Product Competitiveness Analysis: Drug Device Combinations for Non-Insulin Drugs
- Figure 10.3 Product Competitiveness Analysis: Wearable Injectors for Insulin
- Figure 11.1 Gerresheimer: Annual Revenues, FY 2022 Onwards (EUR Million)
- Figure 11.2 West Pharmaceuticals: Annual Revenues, FY 2022 Onwards (USD Billion)
- Figure 11.3 Eli Lilly: Annual Revenues, FY 2022 Onwards (USD Billion)
- Figure 11.4 Insulet: Annual Revenues, FY 2022 Onwards (USD Million)
- Figure 11.5 Medtronic: Annual Revenues, FY 2022 Onwards (USD Billion)
- Figure 11.6 Roche: Annual Revenues, FY 2022 Onwards (CHF Billion)
- Figure 13.1 Partnerships and Collaborations: Cumulative Year-wise Trend, Since 2015
- Figure 13.2 Partnerships and Collaborations: Distribution by Type of Partnership
- Figure 13.3 Partnerships and Collaborations: Distribution by Year and Type of Partnership, Since 2015
- Figure 13.4 Partnerships and Collaborations: Distribution by Partner
- Figure 13.5 Partnerships and Collaborations: Distribution by Year of Partnership and Type of Partner
- Figure 13.6 Partnerships and Collaborations: Distribution by Type of Device
- Figure 13.7 Most Active Players: Distribution by Number of Partnerships
- Figure 13.8 Most Active Players: Distribution by Type of Partnership
- Figure 13.9 Partnerships and Collaborations: Local and International Agreements
- Figure 13.10 Partnerships and Collaborations: Intercontinental and Intracontinental Agreements
- Figure 15.1 Patent Analysis: Distribution by Type of Patent
- Figure 15.2 Patent Analysis: Distribution by Patent Publication Year
- Figure 15.3 Patent Analysis: Distribution by Patent Application Year
- Figure 15.4 Patent Analysis: Distribution by Granted Patents and Patent Applications by Publication Year
- Figure 15.5 Patent Analysis: Distribution by Jurisdiction
- Figure 15.6 Patent Analysis: Distribution by Type of Applicant
- Figure 15.7 Patent Analysis: Distribution by CPC Symbols
- Figure 15.8 Leading Industry Players: Distribution by Number of Patents
- Figure 15.9 Leading Non-Industry Players: Distribution by Number of Patents
- Figure 15.10 Leading Individual Assignees: Distribution by Number of Patents
- Figure 15.11 Patent Benchmarking: Distribution by Patent Characteristics (CPC Symbols)
- Figure 15.12 Patent Analysis: Distribution by Patent Age
- Figure 15.13 Wearable Injectors: Patent Valuation
- Figure 17.1 Clinical Trial Analysis: Distribution by Trial Recruitment Status
- Figure 17.2 Clinical Trial Analysis: Cumulative Distribution by Trial Registration Year
- Figure 17.3 Clinical Trial Analysis: Distribution of Enrolled Patient Population by Trial Registration Year
- Figure 17.4 Clinical Trial Analysis: Distribution by Trial Phase
- Figure 17.5 Clinical Trial Analysis: Distribution of Enrolled Patient Population by Trial Phase
- Figure 17.6 Clinical Trial Analysis: Cumulative Distribution by Trial Registration Year and Trial Recruitment Status
- Figure 17.7 Clinical Trial Analysis: Distribution by Study Design
- Figure 17.8 Clinical Trial Analysis: Distribution by Type of Sponsor / Collaborator
- Figure 17.9 Clinical Trial Analysis: Distribution by Therapeutic Area
- Figure 17.10 Most Active Players: Distribution by Number of Registered Trials
- Figure 17.11 Most Popular Wearable Injectors: Distribution by Number of Registered Trials
- Figure 17.12 Clinical Trial Analysis: Geographical Distribution by Number of Clinical Trials
- Figure 17.13 Clinical Trial Analysis: Distribution of Enrolled Patient Population by Trial Recruitment Status and Geography
- Figure 18.1 Funding and Investment Analysis: Distribution of Year of Funding, Since 2014
- Figure 18.2 Funding and Investment Analysis: Distribution of Amount Invested by Year, Since 2014 (USD Million)
- Figure 18.3 Funding and Investment Analysis: Distribution by Type of Funding
- Figure 18.4 Funding and Investment Analysis: Distribution by Type of Device
- Figure 18.5 Funding and Investment Analysis: Year-wise Distribution by Type of Funding and Amount Raised (USD Million)
- Figure 18.6 Funding and Investment Analysis: Distribution by Target Disease Indication
- Figure 18.7 Most Active Players: Distribution by Number of Funding Instances
- Figure 18.8 Most Active Players: Distribution by Amount Invested
- Figure 18.9 Leading Investors: Distribution by Number of Funding Instances
- Figure 18.10 Funding and Investments: Distribution by Geography
- Figure 19.1 SWOT Factors: Harvey Ball Analysis
- Figure 20.1 CMOs: Distribution by Geography
- Figure 21.1 Key Regulatory Authorities for Medical Devices
- Figure 21.2 Medical Devices Review / Approval Process in the US
- Figure 21.3 Healthcare Insurance Coverage in the US: Distribution by Type of Coverage
- Figure 21.4 Medical Devices National Coverage Determination Process: US
- Figure 21.5 Medical Devices Review / Approval Process in Canada
- Figure 21.6 Healthcare Insurance Coverage in Canada: Distribution by Type of Coverage
- Figure 21.7 Medical Devices Review / Approval Process in Mexico
- Figure 21.8 Regulatory Bodies in EU5 Countries
- Figure 21.9 Steps involved in CE Marking Process
- Figure 21.10 Medical Devices Review / Approval Process in Europe
- Figure 21.11 Medical Devices Review / Approval Process in the UK
- Figure 21.12 Healthcare Insurance Coverage in the UK: Distribution by Type of Coverage
- Figure 21.13 Medical Devices Reimbursement Process: UK
- Figure 21.14 Healthcare Insurance Coverage in France: Distribution by Type of Coverage
- Figure 21.15 Medical Devices Reimbursement Process: France
- Figure 21.16 Healthcare Insurance Coverage in Germany: Distribution by Type of Coverage
- Figure 21.17 Medical Devices Reimbursement Process for In-Patient Setting: Germany
- Figure 21.18 Medical Devices Reimbursement Process for Out-Patient Care: Germany
- Figure 21.19 Healthcare Insurance Coverage in Italy: Distribution by Type of Coverage
- Figure 21.20 Medical Devices Reimbursement Process: Italy
- Figure 21.21 Healthcare Insurance Coverage in Spain: Distribution by Type of Coverage
- Figure 21.22 Medical Devices Reimbursement Process: Spain
- Figure 21.23 Medical Devices Review / Approval Process in Australia
- Figure 21.24 Healthcare Insurance Coverage in Australia: Distribution by Type of Coverage
- Figure 21.25 Medical Devices Review / Approval Process in Brazil
- Figure 21.26 Medical Devices Reimbursement Process: Brazil
- Figure 21.27 Medical Devices Review / Approval Process in China
- Figure 21.28 Healthcare Insurance Coverage in China: Distribution by Type of Coverage
- Figure 21.29 Medical Devices Reimbursement Process: Shanghai
- Figure 21.30 Medical Devices Review / Approval Process in India
- Figure 21.31 Healthcare Insurance Coverage in Israel: Distribution by Type of Coverage
- Figure 21.32 Medical Devices Review / Approval Process in Japan
- Figure 21.33 Medical Devices Reimbursement Process: Japan
- Figure 21.34 Healthcare Insurance Coverage in Japan: Distribution by Type of Coverage
- Figure 21.35 New Medical Devices Reimbursement Process: Japan
- Figure 21.36 Medical Devices Review / Approval Process in New Zealand
- Figure 21.37 Healthcare Insurance Coverage in New Zealand: Distribution by Type of Coverage
- Figure 21.38 Medical Devices Review / Approval Process in Singapore
- Figure 21.39 Medical Devices Review / Approval Process in South Korea
- Figure 21.40 Healthcare Insurance Coverage in South Korea: Distribution by Type of Coverage
- Figure 21.41 Medical Devices Review / Approval Process in South Africa
- Figure 21.42 Medical Devices Review / Approval Process in Taiwan
- Figure 21.43 Healthcare Insurance Coverage in Taiwan: Distribution by Type of Coverage
- Figure 21.44 Medical Devices Review / Approval Process in Thailand
- Figure 21.45 Heat Map Analysis: Comparison of Regional Regulatory Guidelines for Medical Devices
- Figure 21.46 Regulatory Control for Medical Devices: Regional Analysis by Device Risk Category
- Figure 23.1 Global Wearable Injectors Market for Non-Insulin Drugs, Historical Trends (Since 2022) and Forecasted Estimates (Till 2035) (By Value)
- Figure 23.2 Global Wearable Injectors Market for Non-Insulin Drugs, Historical Trends (Since 2022) and Forecasted Estimates (Till 2035) (By Volume)
- Figure 24.1 Wearable Injectors Market for Non-Insulin Drugs: Distribution by Type of Device (By Value)
- Figure 24.2 Wearable Patch Pump Market for Non-Insulin Drugs, Historical Trends (Since 2022) and Forecasted Estimates (Till 2035) (By Value)
- Figure 24.3 Wearable Infusion Pump Market for Non-Insulin Drugs, Historical Trends (Since 2022) and Forecasted Estimates (Till 2035) (By Value)
- Figure 24.4 Wearable Injectors Market for Non-Insulin Drugs: Distribution by Type of Device (By Volume)
- Figure 24.5 Wearable Patch Pump Market for Non-Insulin Drugs, Historical Trends (Since 2022) and Forecasted Estimates (Till 2035) (By Volume)
- Figure 24.6 Wearable Infusion Pump Market for Non-Insulin Drugs, Historical Trends (Since 2022) and Forecasted Estimates (Till 2035) (By Volume)
- Figure 25.1 Wearable Injectors Market for Non-Insulin Drugs: Distribution by Usability (By Value)
- Figure 25.2 Disposable Wearable Injectors Market for Non-Insulin Drugs, Historical Trends (Since 2022) and Forecasted Estimates (Till 2035) (By Value)
- Figure 25.3 Reusable / Disposable Components Wearable Injectors Market for Non-Insulin Drugs, Historical Trends (Since 2022) and Forecasted Estimates (Till 2035) (By Value)
- Figure 25.4 Wearable Injectors Market for Non-Insulin Drugs: Distribution by Usability (By Volume)
- Figure 25.5 Disposable Wearable Injectors Market for Non-Insulin Drugs, Historical Trends (Since 2022) and Forecasted Estimates (Till 2035) (By Volume)
- Figure 25.6 Reusable / Disposable Components Wearable Injectors Market for Non-Insulin Drugs, Historical Trends (Since 2022) and Forecasted Estimates (Till 2035) (By Volume)
- Figure 26.1 Wearable Injectors Market for Non-Insulin Drugs: Distribution by Therapeutic Area (By Value)
- Figure 26.2 Wearable Injectors Market for Non-Insulin Drugs Targeting Oncological Disorders, Historical Trends (Since 2022) and Forecasted Estimates (Till 2035) (By Value)
- Figure 26.3 Wearable Injectors Market for Non-Insulin Drugs Targeting Cardiovascular Disorders, Historical Trends (Since 2022) and Forecasted Estimates (Till 2035) (By Value)
- Figure 26.4 Wearable Injectors Market for Non-Insulin Drugs Targeting Autoimmune Disorders, Historical Trends (Since 2022) and Forecasted Estimates (Till 2035) (By Value)
- Figure 26.5 Wearable Injectors Market for Non-Insulin Drugs Targeting Neurological Disorders, Historical Trends (Since 2022) and Forecasted Estimates (Till 2035) (By Value)
- Figure 26.6 Wearable Injectors Market for Non-Insulin Drugs Targeting Other Disorders, Historical Trends (Since 2022) and Forecasted Estimates (Till 2035) (By Value)
- Figure 26.7 Wearable Injectors Market for Non-Insulin Drugs: Distribution by Therapeutic Area (By Volume)
- Figure 26.8 Wearable Injectors Market for Non-Insulin Drugs Targeting Oncological Disorders, Historical Trends (Since 2022) and Forecasted Estimates (Till 2035) (By Volume)
- Figure 26.9 Wearable Injectors Market for Non-Insulin Drugs Targeting Cardiovascular Disorders, Historical Trends (Since 2022) and Forecasted Estimates (Till 2035) (By Volume)
- Figure 26.10 Wearable Injectors Market for Non-Insulin Drugs Targeting Autoimmune Disorders, Historical Trends (Since 2022) and Forecasted Estimates (Till 2035) (By Volume)
- Figure 26.11 Wearable Injectors Market for Non-Insulin Drugs Targeting Neurological Disorders, Historical Trends (Since 2022) and Forecasted Estimates (Till 2035) (By Volume)
- Figure 26.12 Wearable Injectors Market for Non-Insulin Drugs Targeting Other Disorders, Historical Trends (Since 2022) and Forecasted Estimates (Till 2035) (By Volume)
- Figure 27.1 Wearable Injectors Market for Non-Insulin Drugs: Distribution by Geographical Regions (By Value)
- Figure 27.2 Wearable Injectors Market for Non-Insulin Drugs in North America, Historical Trends (Since 2022) and Forecasted Estimates (Till 2035) (By Value)
- Figure 27.3 Wearable Injectors Market for Non-Insulin Drugs in Europe, Historical Trends (Since 2022) and Forecasted Estimates (Till 2035) (By Value)
- Figure 27.4 Wearable Injectors Market for Non-Insulin Drugs in Asia, Historical Trends (Since 2022) and Forecasted Estimates (Till 2035) (By Value)
- Figure 27.5 Wearable Injectors Market for Non-Insulin Drugs in Latin America, Historical Trends (Since 2022) and Forecasted Estimates (Till 2035) (By Value)
- Figure 27.6 Wearable Injectors Market for Non-Insulin Drugs in Middle East and North Africa, Historical Trends (Since 2022) and Forecasted Estimates (Till 2035) (By Value)
- Figure 27.7 Wearable Injectors Market for Non-Insulin Drugs: Distribution by Geographical Regions (By Volume)
- Figure 27.8 Wearable Injectors Market for Non-Insulin Drugs in North America, Historical Trends (Since 2022) and Forecasted Estimates (Till 2035) (By Volume)
- Figure 27.9 Wearable Injectors Market for Non-Insulin Drugs in Europe, Historical Trends (Since 2022) and Forecasted Estimates (Till 2035) (By Volume)
- Figure 27.10 Wearable Injectors Market for Non-Insulin Drugs in Asia, Historical Trends (Since 2022) and Forecasted Estimates (Till 2035) (By Volume)
- Figure 27.11 Wearable Injectors Market for Non-Insulin Drugs in Latin America, Historical Trends (Since 2022) and Forecasted Estimates (Till 2035) (By Volume)
- Figure 27.12 Wearable Injectors Market for Non-Insulin Drugs in Middle East and North Africa, Historical Trends (Since 2022) and Forecasted Estimates (Till 2035) (By Volume)
- Figure 27.13 Penetration Growth (P-G) Matrix: Geographical Regions
- Figure 27.14 Market Movement Analysis: Geographical Regions
- Figure 28.1 Global Wearable Injectors Market for Insulin, Historical Trends (Since 2022) and Forecasted Estimates (Till 2035) (By Value)
- Figure 28.2 Global Wearable Injectors Market for Insulin, Historical Trends (Since 2022) and Forecasted Estimates (Till 2035) (By Volume)
- Figure 29.1 Wearable Injectors Market for Insulin: Distribution by Type of Device (By Value)
- Figure 29.2 Wearable Patch Pump Market for Insulin, Historical Trends (Since 2022) and Forecasted Estimates (Till 2035) (By Value)
- Figure 29.3 Wearable Infusion Pump Market for Insulin, Historical Trends (Since 2022) and Forecasted Estimates (Till 2035) (By Value)
- Figure 29.4 Wearable Injectors Market for Insulin: Distribution by Type of Device (By Volume)
- Figure 29.5 Wearable Patch Pump Market for Insulin, Historical Trends (Since 2022) and Forecasted Estimates (Till 2035) (By Volume)
- Figure 29.6 Wearable Infusion Pump Market for Insulin, Historical Trends (Since 2022) and Forecasted Estimates (Till 2035) (By Volume)
- Figure 30.1 Wearable Injectors Market for Insulin: Distribution by Degree of Automation (By Value)
- Figure 30.2 Automated / Smart Wearable Injectors Market for Insulin, Historical Trends (Since 2022) and Forecasted Estimates (Till 2035) (By Value)
- Figure 30.3 Manual Wearable Injectors Market for Insulin, Historical Trends (Since 2022) and Forecasted Estimates (Till 2035) (By Value)
- Figure 30.4 Wearable Injectors Market for Insulin: Distribution by Degree of Automation (By Volume)
- Figure 30.5 Automated / Smart Wearable Injectors Market for Insulin, Historical Trends (Since 2022) and Forecasted Estimates (Till 2035) (By Volume)
- Figure 30.6 Manual Wearable Injectors Market for Insulin, Historical Trends (Since 2022) and Forecasted Estimates (Till 2035) (By Volume)
- Figure 31.1 Wearable Injectors Market for Insulin: Distribution by Geographical Regions (By Value)
- Figure 31.2 Wearable Injectors Market for Insulin in North America, Historical Trends (Since 2022) and Forecasted Estimates (Till 2035) (By Value)
- Figure 31.3 Wearable Injectors Market for Insulin in the US, Historical Trends (Since 2022) and Forecasted Estimates (Till 2035) (By Value)
- Figure 31.4 Wearable Injectors Market for Insulin in Canada, Historical Trends (Since 2022) and Forecasted Estimates (Till 2035) (By Value)
- Figure 31.5 Wearable Injectors Market for Insulin in Europe, Historical Trends (Since 2022) and Forecasted Estimates (Till 2035) (By Value)
- Figure 31.6 Wearable Injectors Market for Insulin in Germany, Historical Trends (Since 2022) and Forecasted Estimates (Till 2035) (By Value)
- Figure 31.7 Wearable Injectors Market for Insulin in the UK, Historical Trends (Since 2022) and Forecasted Estimates (Till 2035) (By Value)
- Figure 31.8 Wearable Injectors Market for Insulin in Spain, Historical Trends (Since 2022) and Forecasted Estimates (Till 2035) (By Value)
- Figure 31.9 Wearable Injectors Market for Insulin in France, Historical Trends (Since 2022) and Forecasted Estimates (Till 2035) (By Value)
- Figure 31.10 Wearable Injectors Market for Insulin in Italy, Historical Trends (Since 2022) and Forecasted Estimates (Till 2035) (By Value)
- Figure 31.11 Wearable Injectors Market for Insulin in Rest of Europe, Historical Trends (Since 2022) and Forecasted Estimates (Till 2035) (By Value)
- Figure 31.12 Wearable Injectors Market for Insulin in Asia, Historical Trends (Since 2022) and Forecasted Estimates (Till 2035) (By Value)
- Figure 31.13 Wearable Injectors Market for Insulin in China, Historical Trends (Since 2022) and Forecasted Estimates (Till 2035) (By Value)
- Figure 31.14 Wearable Injectors Market for Insulin in India, Historical Trends (Since 2022) and Forecasted Estimates (Till 2035) (By Value)
- Figure 31.15 Wearable Injectors Market for Insulin in Japan, Historical Trends (Since 2022) and Forecasted Estimates (Till 2035) (By Value)
- Figure 31.16 Wearable Injectors Market for Insulin in Pakistan, Historical Trends (Since 2022) and Forecasted Estimates (Till 2035) (By Value)
- Figure 31.17 Wearable Injectors Market for Insulin in Rest of Asia, Historical Trends (Since 2022) and Forecasted Estimates (Till 2035) (By Value)
- Figure 31.18 Wearable Injectors Market for Insulin in Latin America, Historical Trends (Since 2022) and Forecasted Estimates (Till 2035) (By Value)
- Figure 31.19 Wearable Injectors Market for Insulin in Brazil, Historical Trends (Since 2022) and Forecasted Estimates (Till 2035) (By Value)
- Figure 31.20 Wearable Injectors Market for Insulin in Mexico, Historical Trends (Since 2022) and Forecasted Estimates (Till 2035) (By Value)
- Figure 31.21 Wearable Injectors Market for Insulin in Argentina, Historical Trends (Since 2022) and Forecasted Estimates (Till 2035) (By Value)
- Figure 31.22 Wearable Injectors Market for Insulin in Middle East and North Africa, Historical Trends (Since 2022) and Forecasted Estimates (Till 2035) (By Value)
- Figure 31.23 Wearable Injectors Market for Insulin in Saudi Arabia, Historical Trends (Since 2022) and Forecasted Estimates (Till 2035) (By Value)
- Figure 31.24 Wearable Injectors Market for Insulin in Israel, Historical Trends (Since 2022) and Forecasted Estimates (Till 2035) (By Value)
- Figure 31.25 Wearable Injectors Market for Insulin in Egypt, Historical Trends (Since 2022) and Forecasted Estimates (Till 2035) (By Value)
- Figure 31.26 Wearable Injectors Market for Insulin: Distribution by Geographical Regions (By Volume)
- Figure 31.27 Wearable Injectors Market for Insulin in North America, Historical Trends (Since 2022) and Forecasted Estimates (Till 2035) (By Volume)
- Figure 31.28 Wearable Injectors Market for Insulin in the US, Historical Trends (Since 2022) and Forecasted Estimates (Till 2035) (By Volume)
- Figure 31.29 Wearable Injectors Market for Insulin in Canada, Historical Trends (Since 2022) and Forecasted Estimates (Till 2035) (By Volume)
- Figure 31.30 Wearable Injectors Market for Insulin in Europe, Historical Trends (Since 2022) and Forecasted Estimates (Till 2035) (By Volume)
- Figure 31.31 Wearable Injectors Market for Insulin in Germany, Historical Trends (Since 2022) and Forecasted Estimates (Till 2035) (By Volume)
- Figure 31.32 Wearable Injectors Market for Insulin in the UK, Historical Trends (Since 2022) and Forecasted Estimates (Till 2035) (By Volume)
- Figure 31.33 Wearable Injectors Market for Insulin in Spain, Historical Trends (Since 2022) and Forecasted Estimates (Till 2035) (By Volume)
- Figure 31.34 Wearable Injectors Market for Insulin in France, Historical Trends (Since 2022) and Forecasted Estimates (Till 2035) (By Volume)
- Figure 31.35 Wearable Injectors Market for Insulin in Italy, Historical Trends (Since 2022) and Forecasted Estimates (Till 2035) (By Volume)
- Figure 31.36 Wearable Injectors Market for Insulin in Rest of Europe, Historical Trends (Since 2022) and Forecasted Estimates (Till 2035) (By Volume)
- Figure 31.37 Wearable Injectors Market for Insulin in Asia, Historical Trends (Since 2022) and Forecasted Estimates (Till 2035) (By Volume)
- Figure 31.38 Wearable Injectors Market for Insulin in China, Historical Trends (Since 2022) and Forecasted Estimates (Till 2035) (By Volume)
- Figure 31.39 Wearable Injectors Market for Insulin in India, Historical Trends (Since 2022) and Forecasted Estimates (Till 2035) (By Volume)
- Figure 31.40 Wearable Injectors Market for Insulin in Japan, Historical Trends (Since 2022) and Forecasted Estimates (Till 2035) (By Volume)
- Figure 31.41 Wearable Injectors Market for Insulin in Pakistan, Historical Trends (Since 2022) and Forecasted Estimates (Till 2035) (By Volume)
- Figure 31.42 Wearable Injectors Market for Insulin in Rest of Asia, Historical Trends (Since 2022) and Forecasted Estimates (Till 2035) (By Volume)
- Figure 31.43 Wearable Injectors Market for Insulin in Latin America, Historical Trends (Since 2022) and Forecasted Estimates (Till 2035) (By Volume)
- Figure 31.44 Wearable Injectors Market for Insulin in Brazil, Historical Trends (Since 2022) and Forecasted Estimates (Till 2035) (By Volume)
- Figure 31.45 Wearable Injectors Market for Insulin in Mexico, Historical Trends (Since 2022) and Forecasted Estimates (Till 2035) (By Volume)
- Figure 31.46 Wearable Injectors Market for Insulin in Argentina, Historical Trends (Since 2022) and Forecasted Estimates (Till 2035) (By Volume)
- Figure 31.47 Wearable Injectors Market for Insulin in Middle East and North Africa, Historical Trends (Since 2022) and Forecasted Estimates (Till 2035) (By Volume)
- Figure 31.48 Wearable Injectors Market for Insulin in Saudi Arabia, Historical Trends (Since 2022) and Forecasted Estimates (Till 2035) (By Volume)
- Figure 31.49 Wearable Injectors Market for Insulin in Israel, Historical Trends (Since 2022) and Forecasted Estimates (Till 2035) (By Volume)
- Figure 31.50 Wearable Injectors Market for Insulin in Egypt, Historical Trends (Since 2022) and Forecasted Estimates (Till 2035) (By Volume)
- Figure 31.51 Penetration Growth (P-G) Matrix: Geographical Regions
- Figure 31.52 Market Movement Analysis: Geographical Regions
- Figure 32.1 Concluding Remarks: Market Landscape of Wearable Injectors for Non-Insulin
- Figure 32.2 Concluding Remarks: Market Landscape of Drug Device Combinations
- Figure 32.3 Concluding Remarks: Market Landscape of Wearable Injectors for Insulin
- Figure 32.4 Concluding Remarks: Partnerships and Collaborations
- Figure 32.5 Concluding Remarks: Key Acquisition Targets
- Figure 32.6 Concluding Remarks: Patent Analysis
- Figure 32.7 Concluding Remarks: Likely Drug Candidates
- Figure 32.8 Concluding Remarks: Clinical Trial Analysis
- Figure 32.9 Concluding Remarks: Funding and Investment Analysis
- Figure 32.10 Concluding Remarks: Market Sizing and Opportunity Analysis for Wearable Injectors for Non-Insulin
- Figure 32.11 Concluding Remarks: Market Sizing and Opportunity Analysis for Wearable Injectors for Insulin
 全球穿戴式注射器市場規模、佔有率、趨勢和成長分析報告(2026-2034年)穿戴式注射器全球市場規模、佔有率、趨勢和成長分析報告(2026-2034)
 穿戴式注射器市場規模、佔有率和成長分析:按設備類型、技術、自動化程度、易用性、治療領域/應用、最終用戶和地區分類-2026-2033年產業預測
 穿戴式注射器市場預測至2034年—按類型、應用、技術、最終用戶和地區分類的全球分析
 穿戴式注射器市場:按類型、技術、用途、容量、患者族群、應用和最終用戶分類-2026-2032年全球市場預測
 穿戴式注射器市場規模、佔有率、趨勢和預測:按類型、技術、應用、最終用途和地區分類,2026-2034年
 高容量自動注射器市場規模、佔有率和成長分析:按產品類型、應用、最終用戶、分銷管道和地區分類-2026-2033年產業預測
 穿戴式自動注射器市場規模、佔有率和成長分析:按產品類型、應用、容量、技術、劑量分子類型、給藥途徑、應用和地區分類-2026-2033年產業預測
 2026年全球穿戴式注射器市場報告日本穿戴式注射器市場報告(按類型、技術、應用、最終用途和地區分類,2026-2034年)