


 |
市場調查報告書
商品編碼
1920861
細胞療法製造市場(第七版):趨勢與預測至 2035 年 - 按細胞療法類型、細胞來源、企業規模、製造商類型和地區劃分Cell Therapy Manufacturing Market (7th Edition): Trends and Forecast Till 2035 - Distribution by Type of Cell Therapy, Source of Cells, Scale of Operation, Type of Manufacturer, and Geography |
||||||
細胞療法製造市場:概述
根據 Roots Analysis 預測,細胞療法製造市場預計將以 7.7% 的複合年增長率增長,從目前的 71.72 億美元增長至 2035 年的 140.17 億美元。
細胞療法製造市場 - 成長與趨勢
多年來,許多技術創新和發現改變了醫學領域。其中一項特別顯著的進步是基於細胞療法的出現。這些療法展現出巨大的治療潛力,並且在很大程度上避免了傳統藥物治療中常見的許多毒性問題。目前,研究人員正在研究 1000 多種針對多種疾病的細胞和基因療法候選藥物。目前,全球已有約 45 種細胞療法獲得監管機構批准。此外,多家機構正致力於解決生產難題,確保這些創新療法的持續成功。
細胞和基因療法的生產是一個複雜的過程,需要在嚴格控制的無菌環境中進行,涉及多個關鍵步驟,包括免疫細胞(如 T 細胞和幹細胞)的分離、修飾和擴增。每個步驟都需要使用專門的封閉系統,並嚴格遵守監管標準,以確保最終產品的安全性和有效性。各公司正致力於升級細胞處理和處理設備,改善輔助材料和細胞計數技術,並應對持續存在的物流挑戰。因此,對於細胞療法開發商而言,投資靈活的自動化技術以降低生產這些先進候選療法過程中人為錯誤帶來的風險變得越來越重要。這些改進有望幫助企業在維持產品品質和一致性的同時,有效控製成本。
成長驅動因素:市場擴張的策略基礎
細胞治療領域正經歷快速成長,其特點是臨床試驗數量增加和監管審批範圍擴大。隨著越來越多的療法從早期研究進入後期臨床試驗,患者獲得這些療法的機會也不斷擴大。根據美國基因與細胞治療學會 (ASGCT) 的報告,目前活躍的基因、細胞和 RNA 療法研發管線共有 4,418 個項目(2,155 個基因療法和 966 個非基因修飾細胞療法),其中有 79 個新的基因療法試驗(57% 集中在腫瘤領域)。 RNA 療法研發管線包括 2,155 種基因療法和 966 種非基因修飾細胞療法。此外,本季啟動了 79 個新的基因療法試驗(57% 集中在腫瘤領域)和 27 個新的細胞療法試驗(74% 集中在非腫瘤領域)。預計隨著本地細胞療法生產設施的建立,這一進展將進一步加強。
市場挑戰:發展面臨的重大障礙
儘管市場需求強勁,但細胞療法生產產業在將細胞療法產品從實驗室規模過渡到臨床規模的過程中面臨諸多挑戰。這些障礙包括熟練勞動力短缺、監管合規問題以及缺乏先進的設施和基礎設施。細胞療法生產過程需要無菌、高等級的無塵室和嚴格的隔離監控,以確保產品的完整性和合規性。由於這些複雜的流程,擴大細胞療法生產的規模可能極具挑戰性。
細胞療法生產市場:關鍵洞察
本報告深入分析了細胞療法生產市場的現狀,並指出了該行業的潛在成長機會。報告的主要發現包括:
- 目前,約有 200 家產業參與者從事細胞療法生產,其中約 45% 的總部位於美國。
- 超過40%的產業參與者同時捐贈T細胞和幹細胞。這是因為T細胞的排斥風險較低,而幹細胞具有獨特的再生和修復受損細胞及組織的能力。
- 目前,超過80家非行業公司從事細胞療法製造,其中約55%位於美國。
- 約30%的非產業細胞療法製造商成立於2001年之前,其中超過60%的公司同時使用自體細胞和異體細胞。
- 迄今為止,已有多個評估免疫細胞療法的臨床試驗註冊,其中大部分(65%)研究在亞太地區的各個試驗中心進行。
- 近年來,各利害關係人之間建立的多元化合作關係也反映了市場對該領域日益增長的興趣。事實上,超過55%的合作協議簽署於2022年或以後。
- 70%的產業參與者正在透過建立新設施來擴展其現有的生產和技術能力,其中超過40%的設施專門用於T細胞生產。
- 超過55%的大型製藥公司在該領域的投入是透過合作和夥伴關係推動的。 其中相當一部分已由百時美施貴寶公司實施。
- 目前營運的細胞療法生產能力(以無塵室數量計算)約95%由業內企業擁有,其中規模最大的設施位於北美。
- 細胞療法需求的成長得益於產品核准數量的增加、治療方法的進步、醫療基礎設施的擴建以及病患意識的提高。
- 由於高昂的資本成本和先進技術,細胞療法製造業預計將以8.25%的複合年增長率成長。預計約60%的生產活動將外包給合約生產組織(CMO)。
- 癌症發生率上升、患者對個人化細胞療法的需求變化以及細胞療法製造技術的進步預計將推動市場穩步成長。
- 北美地區的快速技術創新預計將在今年佔細胞療法製造市場的重要佔有率。
- 受美國領先企業開發的已獲批准的細胞療法的成功推動,商業細胞療法製造市場預計將以12.93%的複合年增長率增長。
- 鑑於細胞療法在臨床上的快速成功和不斷增長的需求,以及其在治療血液癌症等疾病方面的廣泛潛力,該行業已為未來的增長做好了充分準備。
細胞療法製造市場
市場規模與機會分析依下列參數細分:
按細胞療法類型
- CAR-T 細胞療法
- 幹細胞療法
- TCR 療法
- TIL 療法
- 樹突細胞療法
- 其他
依細胞來源
- 自體細胞
- 異體細胞
- 未定義細胞
依企業規模
- 臨床規模
- 商業規模
依製造商類型
- 內部製造商
- 合約製造組織
按地區
- 北部美洲
- 美國
- 加拿大
- 歐洲
- 法國
- 德國
- 義大利
- 西班牙
- 英國
- 其他
亞太及世界其他地區
- 阿根廷
- 澳大利亞
- 巴西
- 中國
- 印度
- 以色列
- 日本
- 新加坡
- 南非
- 韓國
- 台灣
細胞療法製造市場:主要細分市場
CAR-T 細胞療法佔細胞療法製造市場最大佔有率
今年,CAR-T 細胞療法細分市場佔了最大的市場佔有率(約 65%),這主要得益於其療程更短、輸注次數更少。此外,包括自然殺手細胞療法和基因修飾細胞療法在內的其他細胞療法細分市場,預計在預測期內將維持16.15%的複合年增長率。自然殺手細胞良好的安全性降低了移植物抗宿主疾病等併發症的風險。此外,其作為現成療法的潛力也推動了這一成長。
自體細胞將佔細胞療法生產市場最大佔有率
到2035年,自體細胞療法預計將佔細胞療法生產市場更大的佔有率,超過50%。此外,預計該細分市場在整個預測期內將呈現顯著成長。這主要是因為自體細胞療法生產專注於使用患者自身的細胞,從而最大限度地降低了免疫排斥的風險,而免疫排斥可能導致移植物抗宿主疾病等嚴重併發症。
北美將佔市場主導地位,佔有率最大
根據我們的市場預測,預計到2025年,北美將維持細胞療法生產市場最大的佔有率,約佔45%。此外,預計到2035年,北美將實現9.70%的相對較快的成長率。值得注意的是,該市場約60%的市佔率來自臨床細胞療法生產。在臨床細胞療法生產領域,美國是製造商的中心,擁有鼓勵創新的監管框架和高技能的勞動力。這種區域集中化使得細胞療法的生產能夠從早期研發到商業化供應高效擴展。
細胞療法生產市場的主要參與者
- Advanced Therapies
- AGC Biologics
- Astellas Pharma
- Catalent
- Charles River Laboratories
- City of Hope
- Clinical Cell and Vaccine Production Facility (CVPF)
- Evotec
- Fraunhofer Institute for Cell Therapy and Immunology
- ImmunityBio
- Lonza
- Merck Millipore
- Miltenyi Biotec
- Minaris Advanced Therapies
- 紐卡斯爾先進療法
- 英國國家醫療服務體系血液與移植中心
- OBiO Tech
- Pharmaron
- Rayne 細胞治療中心
- Resilience
- Sartorius
- 蘇格蘭國家輸血服務中心 (SNBTS) 細胞治療中心
- SK pharmteco(SK 株式會社子公司)
- Takara Bio
- 賽默飛世爾科技
細胞治療製造市場:研究範圍
- 市場規模和機會分析:本報告對細胞治療製造市場進行了詳細分析,重點關注以下關鍵市場細分:[A] 細胞治療類型,[B] 細胞來源,[C] 營運規模,[D] 製造商類型,以及 [E] 地理區域。
- 產業參與者 - 市場概況 1:詳細概述細胞治療製造領域企業的當前市場概況,包括以下資訊:[A] 成立年份,[B] 公司規模,[C] 總部所在地,[D] 生產設施所在地,[E] 提供的免疫細胞類型,[F] 細胞來源,[G] 業務規模,以及服務 [H] 提供的其他類型。
- 非產業參與者 - 市場概況 2:詳細概述細胞治療製造領域非產業參與者的當前市場概況,以及以下相關參數的資訊:[A] 成立年份,[B] 公司規模,[C] 總部所在地,[D] 生產設施所在地,[E] 提供的免疫細胞類型,[F] 細胞來源,[G] 業務規模,以及 [H] 業務規模提供的其他類型。
- 監管環境:概述北美(主要指美國)、歐洲和亞洲(主要指日本和中國)細胞療法生產相關的法規。包括對全球主要監管機構授予生產設施的各種認證和批准的分析。
- 案例研究 1:概述全球各機構發布的旨在推進細胞療法生產流程的各種路線圖。
- 案例研究 2:本報告詳細闡述了技術自動化在優化目前使用封閉式和一次性系統的生產流程中的具體作用。此外,也基於兩個案例研究,展示了自動化設備開發的各個階段。
- 公司簡介:本報告根據[A]成立年份、[B]總部所在地、[C]產品組合、[D]近期發展和[E]未來展望,詳細介紹了北美、歐洲和亞太地區細胞療法生產領域的主要行業和非行業參與者。
- 臨床試驗分析:本報告基於多個相關參數分析已完成、正在進行和計劃中的臨床試驗,這些參數包括研究註冊年份、入組患者人數、研究狀態、研究階段、患者性別、研究設計、分配方法、幹預模型、盲法類型、申辦方/合作方類型、主要參與者(按進行的臨床試驗數量劃分)以及試驗的地域分佈。
- 合作關係:本報告基於多個相關參數詳細分析細胞治療生產商之間的合作關係,這些參數包括合作年份、合作類型、提供的免疫細胞類型、業務規模以及主要參與者(按合作數量劃分)。本章也涵蓋了市場合作活動的區域分佈。
- 近期擴張趨勢:除了對行業內已公佈的擴張計劃進行詳細分析外,本分析還基於以下幾個相關參數:[A] 擴張年份,[B] 擴張進度,[C] 擴張類型,[D] 設施位置,[E] 投資額,[F] 提供的免疫細胞類型,[G] 提供的服務類型,以及參與者 [H] 最活躍的類型,以及參與者的活躍類型,以及參與者的最活躍。
- 大型製藥公司舉措:本部分討論了大型製藥公司針對細胞療法生產開展的各項舉措,包括:[A] 舉措年份,[B] 舉措類型,[C] 舉措數量,[D] 合作類型,[E] 合作數量,[F] 設施擴建類型,[G] 設施擴建數量,[H] 設施合作數量,[F] 設施擴建類型,[G] 設施擴建[L] 企業規模。
- 產能分析:細胞療法生產總裝置容量的估算。該分析基於公開信息,並結合利益相關者提供的信息進行計算,確定了可用產能在潔淨室面積和潔淨室數量方面的分佈。
- 需求分析:對細胞療法的年度商業和臨床需求進行基於資訊的估算。對以下相關參數進行橫斷面分析:[A] 細胞療法類型,[B] 主要地理區域。
- 成本分析:深入分析可能影響細胞療法價格的各種因素。重點介紹製造商為確定產品價格而採用的各種模型/方法。
- 內部生產與外包決策框架:定性分析,重點介紹細胞療法開發商在決定是內部生產產品還是利用合約生產組織 (CMO) 的服務時應考慮的各種因素。
- 總擁有成本:基於公司規模,對細胞療法生產機構 20 年的總擁有成本進行詳細分析。
- SWOT 分析:討論優勢、劣勢、機會和威脅,並確定每個 SWOT 參數對市場動態的相對影響。
目錄
第一章:引言
第二章:研究方法
第三章:市場動態
- 章節概述
- 預測研究法
- 市場估值框架
- 預測工具與技術
- 關鍵考慮因素
- 局限性
第四章:宏觀經濟指標
第五章:摘要整理
第六章:引言
- 章節概述
- 細胞療法簡介
- 細胞療法生產概述
- 細胞療法生產模式
- 細胞療法生產的可擴展性流程
- 細胞療法生產者類型
- 細胞療法生產的主要挑戰
- 影響細胞療法生產的關鍵因素
- 細胞療法生產自動化
- 細胞療法生產供應鏈
- 未來展望
第七章:細胞療法生產者(產業參與者):市場概況
- 章節概述
- 產業參與者:市場概況
第八章:細胞療法生產者(非產業參與者):市場概況
- 章節概述
- 非行業參與者:市場概況
第九章:監理環境
- 章節概述
- 當前狀況
- 細胞療法監管機構生產製造
- 早期細胞療法生產指南概要
- 早期細胞療法生產面臨的挑戰
- 監管指南的區域差異
第十章:案例研究:克服細胞療法生產相關挑戰的路線圖
- 章節概述
- 美國路線圖
- 其他地區路線圖
第十一章:案例研究:細胞療法生產中的自動化技術
- 章節概述
- 細胞療法生產流程自動化
- 成長驅動因素與障礙
- 個案研究
第十二章:產業參與者公司簡介
- 章節概述
- 北美服務提供者
- AGC 生物製劑
- 康泰倫特
- 查爾斯河實驗室
- 免疫生物
- 默克密理博
- 米納里斯先進療法
- 韌性
- SK pharmteco(SK Inc. 的子公司)
- 賽默飛世爾科技
- 歐洲服務提供者
- Evotec
- 龍沙
- 美天旎生物科技
- 賽多利斯
- 亞太地區服務提供者
- 安斯泰來製藥
- 奧比奧科技
- Pharmaron
- Takara Bio
第13章 公司簡介:產業外的公司
- 章節概述
- 希望之城
- 臨床細胞和疫苗生產設施 (CVPF)
- 弗勞恩霍夫細胞治療與免疫學研究所
- 紐卡斯爾先進療法
- 英國國家醫療服務體系血液與移植中心
- 雷恩細胞治療中心(倫敦國王學院)
- 蘇格蘭國家輸血服務中心 (SNBTS) 細胞治療設施
第14章:細胞治療製造領域的非營利組織
- 章節概述
- 細胞治療製造:非營利組織
- 細胞療法生產:國際會議
第15章:臨床試驗分析
- 章節概述
- 研究範圍與方法
- 細胞療法:臨床試驗分析
第16章:夥伴關係與合作
第17章:近期擴張
- 章節概述
- 擴張型
- 細胞療法生產:近期擴張
第18章:主要藥廠的措施
- 章節概述
- 細胞療法生產:主要製藥公司列表
- 細胞療法生產:主要製藥公司措施列表
第19章 產能分析
第20章:需求分析
第21章:成本分析
- 章節概述
- 導致細胞療法價格高的因素
- 細胞療法定價模型
- 細胞療法成本優化
- 細胞療法合約生產組織的作用
- 細胞療法報銷考量
第22章:自製或外購決策架構
- 章節概述
- 假設和關鍵參數
- 細胞療法生產:自製或外購決策
第23章:細胞療法生產組織的總擁有成本
第24章:SWOT分析
第25章:研究與分析
第26章:全球細胞療法製造市場
第27章:細胞療法製造市場(依細胞療法類型劃分)
第28章:細胞療法製造市場(依細胞來源劃分)
第29章:細胞療法製造市場(依企業規模劃分)
第30章 細胞療法生產市場(依生產商類型劃分)
第31章 細胞療法生產市場(按地區劃分)
第32章 細胞療法生產市場機會分析:北美
第33章 細胞療法生產市場機會分析:歐洲
第34章 細胞療法生產市場機會分析:亞太地區及世界其他地區
第35章 結論
第36章 高階主管洞察
附錄一:表格資料
附錄二:公司與組織列表
Cell Therapy Manufacturing Market: Overview
As per Roots Analysis, the cell therapy manufacturing market is estimated to grow from USD 7,172 million in the current year to USD 14,017 million by 2035, at a CAGR of 7.7% during the forecast period, till 2035.
Cell Therapy Manufacturing Market: Growth and Trends
Over the years, numerous technological innovations and discoveries have transformed the field of medicine. One notable advancement is the emergence of cell-based therapies, which have shown substantial therapeutic promise and are largely free from many of the toxicity issues linked to traditional pharmacological treatments. Researchers are exploring over 1,000 cell and gene therapy candidates targeting a wide range of disease indications. Of these, approximately 45 cell-based therapies have already received approval from various global regulatory agencies. In addition, several organizations are implementing initiatives to tackle manufacturing challenges and ensure the ongoing success of these innovative therapies.
The manufacturing of cell and gene therapies is a complex process that occurs in a meticulously controlled, contamination-free environment and involves multiple critical stages, such as isolating, modifying, and expanding immune cells, including T-cells and stem cells. Each of these stages demand the use of specialized closed systems and rigorous compliance with regulatory standards to guarantee the safety and effectiveness of the final products. Companies are focused on enhancing cell handling and processing equipment, improving ancillary materials and cell counting techniques, and addressing current logistical challenges. Consequently, it is becoming increasingly essential for cell therapy developers to invest in flexible and automated technologies to mitigate the risks associated with human error during the production of these advanced therapeutic candidates. These improvements are expected to help companies maintain quality and consistency of products while keeping costs manageable.
Growth Drivers: Strategic Enablers of Market Expansion
The field of cell therapy is experiencing rapid growth, characterized by an increase in clinical trial and a rise in regulatory approvals. With a greater number of therapies advancing from initial research to late-stage clinical trials, patients have more opportunities to access these treatments. A report from the American Society of Gene & Cell Therapy (ASGCT) indicates that there are currently 4,418 active programs in the combined gene, cell, and RNA therapy pipeline, comprising 2,155 gene therapies and 966 non-genetically modified cell therapies, along with 79 new gene therapy trials (57% focused on oncology) and 27 new cell therapy trials (74% in non-oncology) that were initiated during that quarter. This progress will be bolstered by the establishment of local manufacturing facilities for cell therapies.
Market Challenges: Critical Barriers Impeding Progress
Despite strong demand, the cell therapy manufacturing sector faces multiple challenges in moving cell-based therapy products from the lab to clinical scale. These obstacles include a shortage of skilled workers, regulatory compliance issues, and insufficient advanced facilities and infrastructure. The manufacturing processes for cell therapy necessitate sterile, high-grade clean rooms and strict monitoring of containment levels to ensure product integrity and compliance. Due to these intricate procedures, scaling up cell therapy manufacturing can be considerably difficult.
Cell Therapy Manufacturing Market: Key Insights
The report delves into the current state of the cell therapy manufacturing market and identifies potential growth opportunities within industry. Some key findings from the report include:
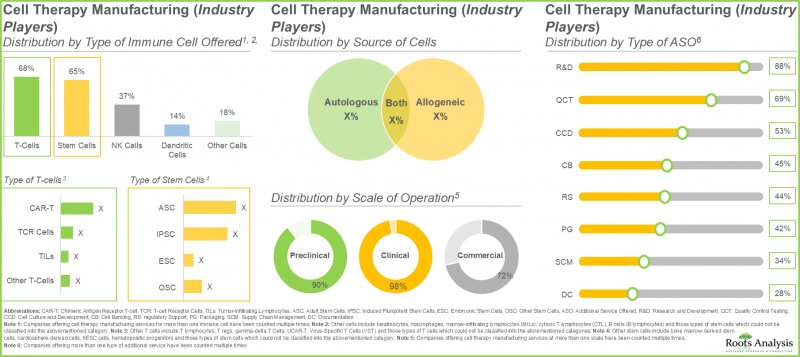
- Currently, close to 200 industry players are engaged in cell therapy manufacturing; of these, ~45% of players are headquartered in the US.
- More than 40% of industry players offer both T-cells and stem cells, as T-cells have a lower risk of rejection while stem cells possess a unique ability to regenerate or repair damaged cells and tissues.
- More than 80 non-industry players are currently engaged in the manufacturing of cell therapies; around 55% of these players are based in the US.
- ~30% of the non-industry cell therapy manufacturers were established before 2001; among these, more than 60% of players utilize both autologous and allogeneic source of cells.
- Several clinical trials evaluating immune cell therapies have been registered till date; majority (65%) of these studies have been conducted across various trial sites in Asia-Pacific.
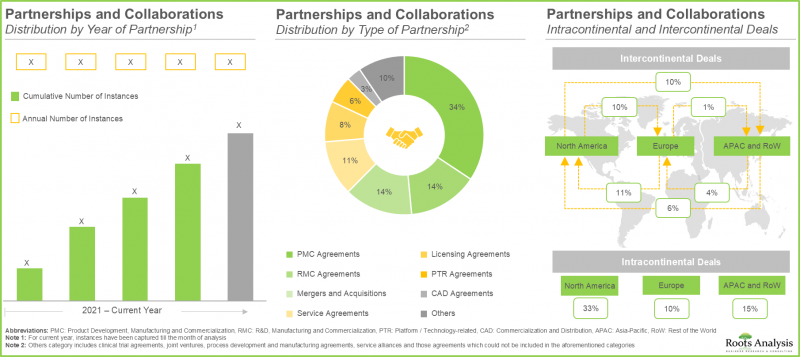
- The rising interest in this market is reflected from the diverse partnerships established among various stakeholders in the recent past; in fact, >55% of the deals have been inked post 2022.
- 70% of the industry players have expanded their existing capacities and capabilities through establishment of new facilities; more than 40% facilities are dedicated to manufacturing of T cells.
- Over 55% of major big pharma initiatives in this domain have been pursued through partnerships and collaborations; of these, a sizeable proportion of the initiatives were undertaken by Bristol-Myers Squibb.
- ~95% of the current installed cell therapy manufacturing capacity (in terms of number of cleanrooms) is presently available with industry players; maximum capacity is installed in facilities based in North America.
- The rising demand for cell-based therapies stems from increasing product approvals, advancing therapies, expanding healthcare infrastructure, and growing patient awareness.
- The cell therapy manufacturing domain is poised to grow at a CAGR of 8.25%, owing to high capital costs and advanced technologies; ~60% of manufacturing activities are expected to be outsourced to CMOs.
- Owing to the rising prevalence of cancer, and shift in patient preferences towards tailored cell therapies and advancements in cell therapy manufacturing technologies, the market is poised for a steady growth in the future.
- North America is expected to capture a significant share of the cell therapy manufacturing market in the current year owing to rapid innovation of technologies within the region.
- Driven by the success of approved cell therapies developed by prominent players in the US, the commercial cell therapy manufacturing market is expected to grow at CAGR of 12.93%.
- Given the rapid clinical success and rising demand for cell therapies, coupled with their extensive potential in treating disorders like blood cancer, the industry is well-positioned for future growth.
Cell Therapy Manufacturing Market
The market sizing and opportunity analysis has been segmented across the following parameters:
By Type of Cell Therapy
- CAR-T Cell Therapy
- Stem Cell Therapy
- TCR Therapy
- TIL Therapy
- Dendritic Cell Therapy
- Others
By Source of Cells
- Autologous Cells
- Allogeneic Cells
- Unspecified Cells
By Scale of Operation
- Clinical Scale
- Commercial Scale
By Type of Manufacturer
- In-house Manufacturers
- Contract Manufacturing Organizations
By Geographical Regions
- North America
- US
- Canada
- Europe
- France
- Germany
- Italy
- Spain
- UK
- Rest of Europe
Asia-Pacific and Rest of the World
- Argentina
- Australia
- Brazil
- China
- India
- Israel
- Japan
- Singapore
- South Africa
- South Korea
- Taiwan
Cell Therapy Manufacturing Market: Key Segments
CAR-T Cell Therapies Accounts for the Largest Share in the Cell Therapy Manufacturing Market
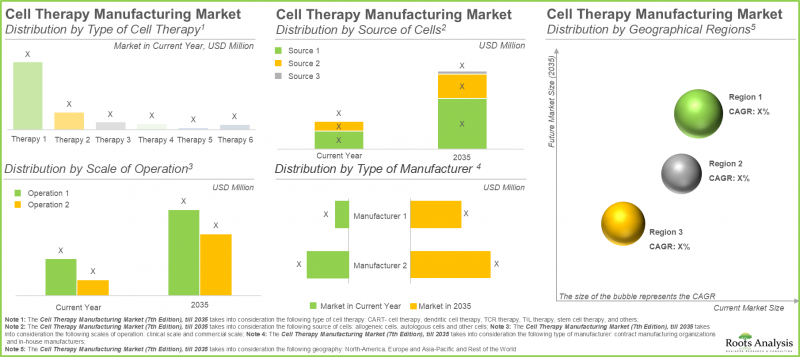
In the present year, the CAR-T cell therapies segment holds the largest market share (approximately 65%), attributed to the shorter treatment regimen that requires fewer infusions. Further, the segment of other cell therapies, which includes natural killer cell therapies and gene-modified cell therapies, is anticipated to experience a higher compound annual growth rate (CAGR) of 16.15% throughout the forecast period. The favorable safety profile of NK cells reduces the risk of conditions such as graft-versus-host disease. Additionally, their potential to function as off-the-shelf therapies propels this growth.
Autologous Cells Hold the Highest Share in the Cell Therapy Manufacturing Market
In 2035, the autologous segment is projected to hold a larger share of the cell therapy manufacturing market, accounting for over 50%. Additionally, this segment is expected to experience a notable growth rate throughout the forecast period. This can be attributed mainly to the focus of autologous cell therapy manufacturing on the patient's own cells, which minimizes the risk of immune rejection that can result in severe complications such as graft-versus-host disease.
North America Dominates the Market by Securing Highest Share
Based on our market forecast, North America is expected to hold the largest share of the cell therapy manufacturing market, accounting for approximately 45% by 2025. Further, we anticipate that North America will experience a comparatively faster growth rate of 9.70% until 2035. It is important to highlight that around 60% of this market derives from clinical cell therapy manufacturing. In the clinical cell therapy manufacturing sector, the U.S. has become a central hub for manufacturers, bolstered by their innovation-friendly regulatory framework and highly qualified workforce. This regional concentration enables efficient scaling of cell therapy production, from initial development stages to commercial supply.
Primary Research Overview
The opinions and insights presented in the market report were also influenced by discussions held with senior stakeholders in the industry. The market report includes detailed transcripts of interviews conducted with the following individuals:
- Marketing Manager, Cell Therapy, Mid-sized Company, Australia
- Director, UK
- Marketing Director, Small Company, Belgium
- Management Board Vice-President, Large Company, Poland
- Senior Director of Sales Advanced Therapies; Vice President of Marketing, Small Company, US
- Business Administration Department Manager, Mid-sized Company, Japan
- Chief Business Officer, Small Company, Netherlands
- Director of Finance and Facility Operations, US
- Senior Director, Very Large Company, Japan
- Chief Executive Officer, Mid-sized Company, UK
- Former Chief Technical Officer, Large Company, US
- Former Chief Executive Officer, Small Company, Netherlands
- Former General Manager, Small Company, France
- Chief Executive Officer, Large Company, China
- Executive Vice President Research and Development, Small Company, Israel
- Former Business Development Manager, Mid-sized Company, UK
- Professor and American Red Cross Chair in Transfusion Medicine, US
- Former Co-Founder and Chief Executive Officer, Small Company, Singapore
- Former Manager, Business Development and Operations-cGMP Manufacturing Unit, Mid-sized Company, Canada
- Manager of Business Development, Small Company, US
- Former Department Leader, Cell Therapy Innovation and Development, Mid-sized Company, France
- Former Chief Executive Officer, Mid-sized Company, Australia
- Chief Executive Officer, Small Company, Netherlands
Example Players in Cell Therapy Manufacturing Market
- Advanced Therapies
- AGC Biologics
- Astellas Pharma
- Catalent
- Charles River Laboratories
- City of Hope
- Clinical Cell and Vaccine Production Facility (CVPF)
- Evotec
- Fraunhofer Institute for Cell Therapy and Immunology
- ImmunityBio
- Lonza
- Merck Millipore
- Miltenyi Biotec
- Minaris Advanced Therapies
- Newcastle Advanced Therapies
- NHS Blood and Transplant
- OBiO Tech
- Pharmaron
- Rayne Cell Therapy Suite
- Resilience
- Sartorius
- Scottish National Blood Transfusion Service (SNBTS) Cellular Therapy Facility
- SK pharmteco (Subsidiary of SK Inc.)
- Takara Bio
- Thermo Fisher Scientific
Cell Therapy Manufacturing Market: Research Coverage
- Market Sizing and Opportunity Analysis: The report features an in-depth analysis of the cell therapy manufacturing market, focusing on key market segments, including [A] type of cell therapy, [B] source of cells, [C] scale of operation, [D] type of manufacturer, and [E] geographical regions.
- Industry Players - Market Landscape 1: A detailed overview of the current market landscape of companies engaged of industry players in cell therapy manufacturing domain, featuring information on, along with information on several relevant parameters, such as [A] year of establishment, [B] company size, [C] location of headquarters, [D] location of manufacturing facility, [E] type of immune cell offered, [F] source of cells, [G] scale of operation, and [H] type of additional service offered.
- Non-industry Players - Market Landscape 2: A detailed overview of the current market landscape of non-industry players in cell therapy manufacturing domain along with information on several relevant parameters, such as [A] year of establishment, [B] company size, [C] location of headquarters, [D] location of manufacturing facility, [E] type of immune cell offered, [F] source of cells, [G] scale of operation, and [H] type of additional service offered.
- Regulatory Landscape: An overview of cell therapy manufacturing related regulations across various geographies, including North America (focusing on the US), Europe and Asia (focusing on Japan and China), featuring an analysis of the diverse certifications / accreditations awarded to the manufacturing facilities by important regulatory bodies across the globe.
- Case Study 1: An overview of the various roadmaps published by different agencies across the globe in order to provide strategies to advance cell therapy manufacturing process.
- Case Study 2: A detailed role of technology automation in cell therapy manufacturing in order to optimize the current manufacturing practices with the use of closed and single use systems. Further, it features a roadmap that provides information on the steps to develop automation devices, supported by two case studies
- Company Profiles: In-depth profiles of prominent industry and non-industry players in North America, Europe and Asia-Pacific that are involved in cell therapy manufacturing based on [A] year of establishment, [B] location of headquarters, [C] product portfolio, [D] recent developments and [E] an informed future outlook.
- Clinical Trial Analysis: An analysis of completed, ongoing and planned clinical trial, based on several relevant parameters, such as trial registration year, enrolled patient population, trial status, trial phase, patient gender, study design, type of allocation, intervention model, type of masking, type of sponsor / collaborator most active players (in terms of number of clinical trial conducted) and geographical distribution of trials.
- Partnerships and Collaborations: An in-depth analysis of the partnerships and collaborations that have been inked by cell therapy manufacturers, based on several relevant parameters, such as year of partnership, type of partnership, type of immune cell offered, scale of operation and most active players (in terms of number of partnerships). The chapter also highlights the regional distribution of partnership activity in this market.
- Recent Expansions: A detailed analysis of expansions reported in the domain, along with analysis on several relevant parameters, such as [A] year of expansion, [B] status of expansion, [C] type of expansion, [D] location of facility, [E] amount invested, [F] type of immune cell offered, [G] type of service offered and [H] most active players.
- Big Pharma Initiatives: An in-depth analysis of the various cell therapy manufacturing focused initiatives undertaken by big pharma players, based on several relevant parameters, such as [A] year of initiative, [B] type of initiative, [C] number of initiatives, [D] type of partnership, [E] number of partnerships, [F] type of facility expansion, [G] number of facility expansions, [H] region of facility expansion, [I] number of mergers and acquisitions, [J] number of funding and investment, [K] type of immune cell offered, and [L]scale of operation.
- Capacity Analysis: An estimate an estimate of the overall installed capacity for the manufacturing of cell-based therapies, based on information reported by various industry stakeholders in the public domain, highlighting the distribution of the available capacity in terms of cleanroom area and number of cleanrooms.
- Demand Analysis: An informed estimate of the annual commercial and clinical demand for cell therapies, across several relevant parameters, such as [A] type of cell therapy, and [B] key geographical regions.
- Cost Price Analysis: A detailed analysis of various factors that are likely to influence the price of cell-based therapies, featuring different models / approaches adopted by manufacturers in order to determine the price of their proprietary offerings.
- Make Versus Buy Decision Making Framework: A qualitative analysis that highlights the various factors that need to be taken into consideration by cell therapy developers, while deciding whether to manufacture their respective products in-house or engage the services of a CMO.
- Total Cost of Ownership: A detailed total cost of ownership analysis based on company size, for cell therapy manufacturing organizations, over a period of 20 years.
- SWOT Analysis: a discussion on strength, weaknesses, opportunities and threats, highlighting the relative effect of each SWOT parameter on the overall market dynamics.
Key Questions Answered in this Report
- Which are the leading companies in cell therapy manufacturing market?
- Which region dominates the cell therapy contract manufacturing market?
- What are the key trends observed in the cell therapy manufacturing market?
- What factors are likely to influence the evolution of this market?
- What are the primary challenges faced by cell therapy contract manufacturers?
- What is the current and future market size?
- What is the CAGR of this market?
- How is the current and future market opportunity likely to be distributed across key market segments?
Reasons to Buy this Report
- The report provides a comprehensive market analysis, offering detailed revenue projections of the overall market and its specific sub-segments. This information is valuable to both established market leaders and emerging entrants.
- The report offers stakeholders a comprehensive overview of the market, including key drivers, barriers, opportunities, and challenges. This information empowers stakeholders to stay abreast of market trends and make data-driven decisions to capitalize on growth prospects.
- The report can aid businesses in identifying future opportunities in any sector. It also helps in understanding if those opportunities are worth pursuing.
- The report helps in identifying customer demand by understanding the needs, preferences, and behavior of the target audience in order to tailor products or services effectively.
- The report equips new entrants with requisite information regarding a particular market to help them build successful business strategies.
- The report allows for more effective communication with the audience and in building strong business relations.
Additional Benefits
- Complementary PPT Insights Pack
- Complimentary Excel Data Packs for all Analytical Modules in the Report
- 15% Free Content Customization
- Detailed Report Walkthrough Session with Research Team
- Free Updated report if the report is 6-12 months old or older
TABLE OF CONTENTS
1. PREFACE
- 1.1. Introduction
- 1.2. Market Share Insights
- 1.3. Key Market Insights
- 1.4. Report Coverage
- 1.5. Key Questions Answered
- 1.6. Chapter Outlines
2. RESEARCH METHODOLOGY
- 2.1. Chapter Overview
- 2.2. Research Assumptions
- 2.2.1. Market Landscape and Market Trends
- 2.2.2. Market Forecast and Opportunity Analysis
- 2.2.3. Comparative Analysis
- 2.3. Database Building
- 2.3.1. Data Collection
- 2.3.2. Data Validation
- 2.3.3. Data Analysis
- 2.4. Project Methodology
- 2.4.1. Secondary Research
- 2.4.1.1. Annual Reports
- 2.4.1.2. Academic Research Papers
- 2.4.1.3. Company Websites
- 2.4.1.4. Investor Presentations
- 2.4.1.5. Regulatory Filings
- 2.4.1.6. White Papers
- 2.4.1.7. Industry Publications
- 2.4.1.8. Conferences and Seminars
- 2.4.1.9. Government Portals
- 2.4.1.10. Media and Press Releases
- 2.4.1.11. Newsletters
- 2.4.1.12. Industry Databases
- 2.4.1.13. Roots Proprietary Databases
- 2.4.1.14. Paid Databases and Sources
- 2.4.1.15. Social Media Portals
- 2.4.1.16. Other Secondary Sources
- 2.4.2. Primary Research
- 2.4.2.1. Types of Primary Research
- 2.4.2.1.1. Qualitative Research
- 2.4.2.1.2. Quantitative Research
- 2.4.2.1.3. Hybrid Approach
- 2.4.2.2. Advantages of Primary Research
- 2.4.2.3. Techniques for Primary Research
- 2.4.2.3.1. Interviews
- 2.4.2.3.2. Surveys
- 2.4.2.3.3. Focus Groups
- 2.4.2.3.4. Observational Research
- 2.4.2.3.5. Social Media Interactions
- 2.4.2.4. Key Opinion Leaders Considered in Primary Research
- 2.4.2.4.1. Company Executives (CXOs)
- 2.4.2.4.2. Board of Directors
- 2.4.2.4.3. Company Presidents and Vice Presidents
- 2.4.2.4.4. Research and Development Heads
- 2.4.2.4.5. Technical Experts
- 2.4.2.4.6. Subject Matter Experts
- 2.4.2.4.7. Scientists
- 2.4.2.4.8. Doctors and Other Healthcare Providers
- 2.4.2.5. Ethics and Integrity
- 2.4.2.5.1. Research Ethics
- 2.4.2.5.2. Data Integrity
- 2.4.2.1. Types of Primary Research
- 2.4.3. Analytical Tools and Databases
- 2.4.1. Secondary Research
- 2.5. Robust Quality Control
3. MARKET DYNAMICS
- 3.1. Chapter Overview
- 3.2. Forecast Methodology
- 3.2.1. Top-down Approach
- 3.2.2. Bottom-up Approach
- 3.2.3. Hybrid Approach
- 3.3. Market Assessment Framework
- 3.3.1. Total Addressable Market (TAM)
- 3.3.2. Serviceable Addressable Market (SAM)
- 3.3.3. Serviceable Obtainable Market (SOM)
- 3.3.4. Currently Acquired Market (CAM)
- 3.4. Forecasting Tools and Techniques
- 3.4.1. Qualitative Forecasting
- 3.4.2. Correlation
- 3.4.3. Regression
- 3.4.4. Extrapolation
- 3.4.5. Convergence
- 3.4.6. Sensitivity Analysis
- 3.4.7. Scenario Planning
- 3.4.8. Data Visualization
- 3.4.9. Time Series Analysis
- 3.4.10. Forecast Error Analysis
- 3.5. Key Considerations
- 3.5.1. Demographics
- 3.5.2. Government Regulations
- 3.5.3. Reimbursement Scenarios
- 3.5.4. Market Access
- 3.5.5. Supply Chain
- 3.5.6. Industry Consolidation
- 3.5.7. Pandemic / Unforeseen Disruptions Impact
- 3.6. Limitations
4. MACRO-ECONOMIC INDICATORS
- 4.1. Chapter Overview
- 4.2. Market Dynamics
- 4.2.1. Time Period
- 4.2.1.1. Historical Trends
- 4.2.1.2. Current and Forecasted Estimates
- 4.2.2. Currency Coverage
- 4.2.2.1. Major Currencies Affecting the Market
- 4.2.2.2. Factors Affecting Currency Fluctuations
- 4.2.2.3. Impact of Currency Fluctuations on the Industry
- 4.2.3. Foreign Currency Exchange Rate
- 4.2.3.1. Impact of Foreign Exchange Rate Volatility on the Market
- 4.2.3.2. Strategies for Mitigating Foreign Exchange Risk
- 4.2.4. Recession
- 4.2.4.1. Assessment of Current Economic Conditions and Potential Impact on the Market
- 4.2.4.2. Historical Analysis of Past Recessions and Lessons Learnt
- 4.2.5. Inflation
- 4.2.5.1. Measurement and Analysis of Inflationary Pressures in the Economy
- 4.2.5.2. Potential Impact of Inflation on the Market Evolution
- 4.2.6. Interest Rates
- 4.2.6.1. Interest Rates and Their Impact on the Market
- 4.2.6.2. Strategies for Managing Interest Rate Risk
- 4.2.7. Commodity Flow Analysis
- 4.2.7.1. Type of Commodity
- 4.2.7.2. Origins and Destinations
- 4.2.7.3. Values and Weights
- 4.2.7.4. Modes of Transportation
- 4.2.8. Global Trade Dynamics
- 4.2.8.1. Import Scenario
- 4.2.8.2. Export Scenario
- 4.2.8.3. Trade Policies
- 4.2.8.4. Strategies for Mitigating the Risks Associated with Trade Barriers
- 4.2.8.5. Impact of Trade Barriers on the Market
- 4.2.9. War Impact Analysis
- 4.2.9.1. Russian-Ukraine War
- 4.2.9.2. Israel-Hamas War
- 4.2.10. COVID Impact / Related Factors
- 4.2.10.1. Global Economic Impact
- 4.2.10.2. Industry-specific Impact
- 4.2.10.3. Government Response and Stimulus Measures
- 4.2.10.4. Future Outlook and Adaptation Strategies
- 4.2.11. Other Indicators
- 4.2.11.1. Fiscal Policy
- 4.2.11.2. Consumer Spending
- 4.2.11.3. Gross Domestic Product
- 4.2.11.4. Employment
- 4.2.11.5. Taxes
- 4.2.11.6. Stock Market Performance
- 4.2.11.7. Cross Border Dynamics
- 4.2.1. Time Period
- 4.3. Conclusion
5. EXECUTIVE SUMMARY
- 5.1. Executive Summary: Market Landscape
- 5.2. Executive Summary: Market Trends
- 5.3. Executive Summary: Market Forecast and Opportunity Analysis
6. INTRODUCTION
- 6.1. Chapter Overview
- 6.2. Introduction to Cell-based Therapies
- 6.2.1. Comparison of Cell-based Therapies and Other Biotechnology Products
- 6.2.2. Classification of Advanced Therapy Medicinal Products (ATMPs)
- 6.2.3. Current Market Landscape of ATMPs
- 6.3. Overview of Cell Therapy Manufacturing
- 6.4. Cell Therapy Manufacturing Models
- 6.4.1. Centralized Manufacturing
- 6.4.2. Decentralized Manufacturing
- 6.5. Scalability of Cell Therapy Manufacturing Processes
- 6.5.1. Scale-up
- 6.5.2. Scale-out
- 6.6. Types of Cell Therapy Manufacturers
- 6.7. Key Challenges for Manufacturing Cell Therapies
- 6.8. Key Factors Influencing Cell Therapy Manufacturing
- 6.8.1. Cell Characterization
- 6.8.2. Cost of Goods
- 6.9. Automation of Cell Therapy Manufacturing
- 6.10. Cell Therapy Manufacturing Supply Chain
- 6.11. Future Perspectives
7. CELL THERAPY MANUFACTURERS (INDUSTRY PLAYERS): MARKET LANDSCAPE
- 7.1. Chapter Overview
- 7.2. Industry Players: Overall Market Landscape
- 7.2.1. Analysis by Year of Establishment
- 7.2.2. Analysis by Company Size
- 7.2.3. Analysis by Location of Headquarters (Region)
- 7.2.4. Analysis by Location of Headquarters (Country)
- 7.2.5. Analysis by Company Size and Location of Headquarters (Region)
- 7.2.6. Analysis by Location of Manufacturing Facility
- 7.2.7. Analysis by Type of Immune Cell Offered
- 7.2.8. Analysis by Source of Cells
- 7.2.9. Analysis by Scale of Operation
- 7.2.10. Analysis by Type of Additional Service Offered
8. CELL THERAPY MANUFACTURERS (NON-INDUSTRY PLAYERS): MARKET LANDSCAPE
- 8.1. Chapter Overview
- 8.2. Non-Industry Players: Overall Market Landscape
- 8.2.1. Analysis by Year of Establishment
- 8.2.2. Analysis by Location of Headquarters (Region)
- 8.2.3. Analysis by Location of Headquarters (Country)
- 8.2.4. Analysis by Location of Manufacturing Facility
- 8.2.5. Analysis by Type of Immune Cell Offered
- 8.2.6. Analysis by Source of Cell
- 8.2.7. Analysis by Scale of Operation
- 8.2.8. Analysis by Type of Additional Service Offered
9. REGULATORY LANDSCAPE
- 9.1. Chapter Overview
- 9.2. Current Scenario
- 9.2.1. Regulatory Guidelines in North America
- 9.2.2. Regulatory Guidelines in Europe
- 9.2.3. Regulatory Guidelines in Asia-Pacific
- 9.2.3.1. Regulatory Guidelines in Japan
- 9.2.3.2. Regulatory Guidelines in China
- 9.2.4. Conditional Approvals
- 9.3. Regulatory Authorities for Cell Therapy Manufacturing
- 9.3.1. Cell Therapy Manufacturing (Industry Players): Regulatory Authorities
- 9.4. Summary of Guidelines for Early-Stage Manufacturing of Cell Therapies
- 9.5. Existing Challenges to Early-Stage Manufacturing of Cell Therapies
- 9.6. Variability in Regulatory Guidelines across Different Geographies
10. CASE STUDY: ROADMAPS FOR OVERCOMING CHALLENGES RELATED TO CELL THERAPY MANUFACTURING
- 10.1. Chapter Overview
- 10.2. Roadmap for the US
- 10.2.1. Cell Processing
- 10.2.2. Cell Preservation, Distribution and Handling
- 10.2.3. Process Automation and Data Analytics
- 10.2.4. Process Monitoring and Quality Control
- 10.2.5. Standardization and Regulatory Support
- 10.2.6. Workforce Development
- 10.2.7. Supply Chain and Logistics
- 10.3. Roadmaps for Other Geographies
- 10.3.1. Europe
- 10.3.2. Asia-Pacific
11. CASE STUDY: AUTOMATION TECHNOLOGIES FOR CELL THERAPY MANUFACTURING
- 11.1. Chapter Overview
- 11.2. Automation of Cell Therapy Manufacturing Processes
- 11.2.1. Closed Systems
- 11.2.2. Single-use Systems
- 11.2.3. Modular Systems
- 11.3. Growth Drivers and Roadblocks
- 11.4. Case Studies
- 11.4.1. Roadmap to Develop an Automated Cell Manufacturing / Processing Device
- 11.4.2. Automating the Cell Therapy Manufacturing Process
- 11.4.3. Advancement to Automation of Cell Therapy Manufacturing Process
- 11.4.4. GMP-in-a-Box
- 11.4.5. List of Automated and Closed Cell Therapy Processing Systems
12. COMPANY PROFILES: INDUSTRY PLAYERS
- 12.1. Chapter Overview
- 12.2. Service Providers in North America
- 12.2.1. Advanced Therapies
- 12.2.1.1. Company Overview
- 12.2.1.2. Financial Information
- 12.2.1.3. Service Portfolio
- 12.2.1.4. Manufacturing Facilities and Capabilities
- 12.2.1.5. Recent Developments and Future Outlook
- 12.2.1. Advanced Therapies
- similar details are presented for other below mentioned players based on information in the public domain
- 12.2.2. AGC Biologics
- 12.2.3. Catalent
- 12.2.4. Charles River Laboratories
- 12.2.5. ImmunityBio
- 12.2.6. Merck Millipore
- 12.2.7. Minaris Advanced Therapies
- 12.2.8. Resilience
- 12.2.9. SK pharmteco (Subsidiary of SK Inc.)
- 12.2.10. Thermo Fisher Scientific
- 12.3. Service Providers in Europe
- 12.3.1. Evotec
- 12.3.2. Lonza
- 12.3.3. Miltenyi Biotec
- 12.3.4. Sartorius
- 12.4. Service Providers in Asia-Pacific
- 12.4.1. Astellas Pharma
- 12.4.2. OBiO Tech
- 12.4.3. Pharmaron
- 12.4.4. Takara Bio
13. COMPANY PROFILES: NON-INDUSTRY PLAYERS
- 13.1. Chapter Overview
- 13.2. City of Hope
- 13.2.1. Overview
- 13.2.2. Service Portfolio
- 13.2.3. Type of Additional Service Offered
- similar details are presented for other below mentioned players based on information in the public domain
- 13.3. Clinical Cell and Vaccine Production Facility (CVPF)
- 13.4. Fraunhofer Institute for Cell Therapy and Immunology
- 13.5. Newcastle Advanced Therapies
- 13.6. NHS Blood and Transplant
- 13.7. Rayne Cell Therapy Suite (King's College London)
- 13.8. Scottish National Blood Transfusion Service (SNBTS) Cellular Therapy Facility
14. NON-PROFIT ORGANIZATIONS IN CELL THERAPY MANUFACTURING
- 14.1. Chapter Overview
- 14.2. Cell Therapy Manufacturing: Non-Profit Organizations
- 14.2.1. CellCAN
- 14.2.2. Cell Therapy Manufacturing Cooperative Research Center
- 14.2.3. National Cell Manufacturing Consortium (NCMC)
- 14.2.4. California Institute of Regenerative Medicine (CIRM)
- 14.3. Cell Therapy Manufacturing: International Societies
15. CLINICAL TRIAL ANALYSIS
- 15.1. Chapter Overview
- 15.2. Scope and Methodology
- 15.3. Cell Therapies: Clinical Trial Analysis
- 15.3.1. Analysis by Trial Registration Year
- 15.3.2. Analysis by Trial Registration Year and Enrolled Patient Population
- 15.3.3. Analysis by Trial Status
- 15.3.4. Analysis by Trial Registration Year and Trial Status
- 15.3.5. Analysis by Trial Phase
- 15.3.6. Analysis of Enrolled Patient Population by Trial Phase
- 15.3.7. Analysis by Patient Gender
- 15.3.8. Analysis by Study Design
- 15.3.8.1. Analysis by Type of Allocation
- 15.3.8.2. Analysis by Intervention Model
- 15.3.8.3. Analysis by Type of Masking
- 15.3.9. Analysis by Type of Sponsor / Collaborator
- 15.3.10. Most Active Players: Analysis by Number of Registered Trials
- 15.3.11. Analysis by Geography
- 15.3.11.1. Analysis of Clinical Trials by Geography
- 15.3.11.2. Analysis of Clinical Trials by Trial Status and Geography
- 15.3.11.3. Analysis of Enrolled Patient Population by Trial Status and Geography
16. PARTNERSHIPS AND COLLABORATIONS
- 16.1. Chapter Overview
- 16.2. Partnership Models
- 16.3. Cell Therapy Manufacturing: List of Partnerships
- 16.3.1. Analysis by Year of Partnership
- 16.3.2. Analysis by Type of Partnership
- 16.3.3. Analysis by Year and Type of Partnership
- 16.4. Analysis by Type of Immune Cell Offered
- 16.5. Analysis by Scale of Operation
- 16.6. Most Active Players: Analysis by Number of Partnerships
- 16.7. Analysis by Geography
- 16.7.1. Local and International Agreements
- 16.7.2. Intracontinental and Intercontinental Agreements
17. RECENT EXPANSIONS
- 17.1. Chapter Overview
- 17.2. Type of Expansions
- 17.3. Cell Therapy Manufacturing: Recent Expansions
- 17.3.1. Analysis by Year of Expansion
- 17.3.2. Analysis by Type of Expansion
- 17.3.3. Analysis by Year and Type of Expansion
- 17.3.4. Analysis by Location of Expanded Facility (Region)
- 17.3.5. Analysis by Location of Expanded Facility (Country)
- 17.3.6. Analysis by Type of Expansion and Location of Headquarters (Country)
- 17.3.7. Analysis by Type of Immune Cell Offered
- 17.3.8. Analysis by Type of Expansion and Type of Immune Cell Offered
- 17.3.9. Analysis by Scale of Operation
- 17.3.10. Most Active Players: Analysis by Number of Expansions
- 17.3.11. Most Active Players: Analysis by Area of Expansion
18. BIG PHARMA INITIATIVES
- 18.1. Chapter Overview
- 18.2. Cell Therapy Manufacturing: List of Big Pharma Players
- 18.3. Cell Therapy Manufacturing: List of Initiatives by Big Pharma Players
- 18.3.1. Analysis by Year of Initiative
- 18.3.2. Analysis by Type of Initiative
- 18.3.3. Analysis by Year and Type of Initiative
- 18.3.4. Big Players: Analysis by Number of Initiatives
- 18.3.5. Analysis by Type of Partnership
- 18.3.6. Big Players: Analysis by Number of Partnerships
- 18.3.7. Analysis by Type of Facility Expansion
- 18.3.8. Big Players: Analysis by Number of Facility Expansions
- 18.3.9. Big Players: Analysis by Region of Facility Expansion
- 18.3.10. Big Players: Analysis by Number of Mergers and Acquisitions
- 18.3.11. Big Players: Analysis by Number of Funding and Investment
- 18.3.12. Analysis by Type of Immune Cell Offered
- 18.3.13. Analysis by Scale of Operation
- 18.3.14. Analysis of Big Pharma Players by Scale of Operation
- 18.3.15. Big Pharma Initiatives Summary
19. CAPACITY ANALYSIS
- 19.1. Chapter Overview
- 19.2. Industry Players: Key Assumptions and Methodology
- 19.2.1. Cell Therapy Manufacturing: Global Installed Capacity (Number of Cleanrooms)
- 19.2.1.1. Analysis by Company Size
- 19.2.1.2. Analysis by Scale of Operation
- 19.2.1.3. Analysis by Location of Manufacturing Facility
- 19.2.1.4. Analysis by Company Size and Location of Manufacturing Facility
- 19.2.1.5. Analysis by Scale of Operation and Location of Manufacturing Facility
- 19.2.2. Cell Therapy Manufacturing: Global Installed Capacity (Cleanroom Area)
- 19.2.2.1. Analysis by Company Size
- 19.2.2.2. Analysis by Scale of Operation
- 19.2.2.3. Analysis by Location of Manufacturing Facility
- 19.2.2.4. Analysis by Company Size and Location of Manufacturing Facility
- 19.2.2.5. Analysis by Scale of Operation and Location of Manufacturing Facility
- 19.2.1. Cell Therapy Manufacturing: Global Installed Capacity (Number of Cleanrooms)
- 19.3. Non- Industry Players: Key Assumptions and Methodology
- 19.3.1. Cell Therapy Manufacturing: Global Installed Capacity (Number of Cleanrooms)
- 19.3.1.1. Analysis by Scale of Operation
- 19.3.1.2. Analysis by Location of Manufacturing Facility
- 19.3.2. Cell Therapy Manufacturing: Global Installed Capacity (Cleanroom Area)
- 19.3.2.1. Analysis by Scale of Operation
- 19.3.2.2. Analysis by Location of Manufacturing Facility
- 19.3.1. Cell Therapy Manufacturing: Global Installed Capacity (Number of Cleanrooms)
- 19.4. Concluding Remarks
20. DEMAND ANALYSIS
- 20.1. Chapter Overview
- 20.2. Assumptions and Methodology
- 20.3. Global Demand for Cell Therapy Manufacturing
- 20.4. Global Clinical Demand for Cell Therapy Manufacturing
- 20.4.1. Clinical Demand: Analysis by Type of Cell Therapy
- 20.4.2. Clinical Demand: Analysis by Geography
- 20.5. Global Commercial Demand for Cell Therapy Manufacturing
- 20.5.1. Commercial Demand: Analysis by Type of Cell Therapy
- 20.5.2. Commercial Demand: Analysis by Geography
21. COST PRICE ANALYSIS
- 21.1. Chapter Overview
- 21.2. Factors Contributing to the High Price of Cell Therapies
- 21.3. Pricing Models for Cell Therapies
- 21.3.1. Based on Associated Costs for T-cell Therapies
- 21.3.2. Based on Associated Costs for Stem Cell Therapies
- 21.3.3. Based on Availability of Competing Products
- 21.3.4. Based on Target Patient Segment
- 21.3.5. Based on the Opinions of Industry Experts
- 21.4. Cell Therapy Cost Optimization
- 21.4.1. Role of Cost of Goods Sold
- 21.4.2. Role of Automation
- 21.5. Role of Cell Therapy Contract Manufacturing Organizations
- 21.6. Reimbursement-related Considerations for Cell Therapies
- 21.6.1. Case Study: The National Institute for Health and Care Excellence's (NICE) Appraisal of CAR-T Therapies
22. MAKE VERSUS BUY DECISION MAKING FRAMEWORK
- 22.1. Chapter Overview
- 22.2. Assumptions and Key Parameters
- 22.3. Cell Therapy Manufacturing: Make versus Buy Decision Making
- 22.3.1. Scenario 1
- 22.3.2. Scenario 2
- 22.3.3. Scenario 3
- 22.3.4. Scenario 4
23. TOTAL COST OF OWNERSHIP FOR CELL THERAPY MANUFACTURING ORGANIZATIONS
- 23.1. Chapter Overview
- 23.2. Key Parameters
- 23.3. Assumptions and Methodology
- 23.4. Sample Dataset for the Estimation of Total Cost of Ownership
- 23.5. Total Cost of Ownership for Mid-sized Cell Therapy Manufacturing Organizations, Y0-Y20
- 23.6. Total Cost of Ownership for Mid-sized Cell Therapy Manufacturing Organizations: Analysis by CAPEX and OPEX, Y0 and Y20
- 23.6.1. Total Cost of Ownership for Mid-sized Cell Therapy Manufacturing Organizations: Analysis by CAPEX, Y0
- 23.6.2. Total Cost of Ownership for Mid-sized Cell Therapy Manufacturing Organizations: Analysis by OPEX, Y1-Y20
24. SWOT ANALYSIS
- 24.1. Chapter Overview
- 24.2. Strengths
- 24.3. Weaknesses
- 24.4. Opportunities
- 24.5. Threats
- 24.6. Comparison of SWOT Factors
25. SURVEY ANALYSIS
- 25.1. Chapter Overview
- 25.2. Analysis by Designation of Respondents
- 25.3. Analysis by Type of Cell Therapy
- 25.4. Analysis by Scale of Operation
- 25.5. Analysis by Source of Cells
- 25.6. Analysis by Type of Cell Culture System Used
- 25.7. Analysis by Availability of Fill / Finish Services
26. GLOBAL CELL THERAPY MANUFACTURING MARKET
- 26.1. Chapter Overview
- 26.2. Assumptions and Methodology
- 26.3. Global Cell Therapy Manufacturing Market, Historical Trends (since 2023) and Forecasted Estimates (till 2035)
- 26.4. Roots Analysis Perspective on Market Growth
- 26.5. Scenario Analysis
- 26.5.1. Conservative Scenario
- 26.5.2. Optimistic Scenario
- 26.6. Key Market Segmentations
27. CELL THERAPY MANUFACTURING MARKET, BY TYPE OF CELL THERAPY
- 27.1. Chapter Overview
- 27.2. Key Assumptions and Methodology
- 27.3. Cell Therapy Manufacturing Market: Distribution by Type of Cell Therapy
- 27.3.1. Cell Therapy Manufacturing Market for CAR-T Cell Therapies, Historical Trends (since 2023) and Forecasted Estimates (till 2035)
- 27.3.2. Cell Therapy Manufacturing Market for Stem Cell Therapies, Historical Trends (since 2023) and Forecasted Estimates (till 2035)
- 27.3.3. Cell Therapy Manufacturing Market for TCR Cell Therapies, Historical Trends (since 2023) and Forecasted Estimates (till 2035)
- 27.3.4. Cell Therapy Manufacturing Market for TIL Cell Therapies, Historical Trends (since 2023) and Forecasted Estimates (till 2035)
- 27.3.5. Cell Therapy Manufacturing Market for Dendritic Cell Therapies, Historical Trends (since 2023) and Forecasted Estimates (till 2035)
- 27.3.6. Cell Therapy Manufacturing Market for Other Cell Therapies, Historical Trends (since 2023) and Forecasted Estimates (till 2035)
- 27.4. Data Triangulation and Validation
28. CELL THERAPY MANUFACTURING MARKET, BY SOURCE OF CELLS
- 28.1. Chapter Overview
- 28.2. Key Assumptions and Methodology
- 28.3. Cell Therapy Manufacturing Market: Distribution by Source of Cells
- 28.3.1. Cell Therapy Manufacturing Market for Autologous Cells, Historical Trends (since 2023) and Forecasted Estimates (till 2035)
- 28.3.2. Cell Therapy Manufacturing Market for Allogeneic Cells, Historical Trends (since 2023) and Forecasted Estimates (till 2035)
- 28.3.3. Cell Therapy Manufacturing Market for Other Cells, Historical Trends (since 2023) and Forecasted Estimates (till 2035)
- 28.4. Data Triangulation and Validation
29. CELL THERAPY MANUFACTURING MARKET, BY SCALE OF OPERATION
- 29.1. Chapter Overview
- 29.2. Key Assumptions and Methodology
- 29.3. Cell Therapy Manufacturing Market: Distribution by Scale of Operation
- 29.3.1. Cell Therapy Manufacturing Market for Clinical Scale, Historical Trends (since 2023) and Forecasted Estimates (till 2035)
- 29.3.2. Cell Therapy Manufacturing Market for Commercial Scale, Historical Trends (since 2023) and Forecasted Estimates (till 2035)
30. CELL THERAPY MANUFACTURING MARKET, BY TYPE OF MANUFACTURER
- 30.1. Chapter Overview
- 30.2. Key Assumptions and Methodology
- 30.3. Cell Therapy Manufacturing Market: Distribution by Type of Manufacturer
- 30.3.1. Cell Therapy Manufacturing Market for Contract Manufacturing Organizations, Historical Trends (since 2023) and Forecasted Estimates (till 2035)
- 30.3.2. Cell Therapy Manufacturing Market for In-House Manufacturers, Historical Trends (since 2023) and Forecasted Estimates (till 2035)
- 30.4. Data Triangulation and Validation
31. CELL THERAPY MANUFACTURING MARKET, BY GEOGRAPHY
- 31.1. Chapter Overview
- 31.2. Key Assumptions and Methodology
- 31.3. Cell Therapy Manufacturing Market: Distribution by Geography
- 31.3.1. Clinical Cell Therapy Manufacturing Market
- 31.3.1.1. Clinical Cell Therapy Manufacturing Market in North America, Historical Trends (since 2023) and Forecasted Estimates (till 2035)
- 31.3.1.1.1. Clinical Cell Therapy Manufacturing Market in the US, Historical Trends (since 2023) and Forecasted Estimates (till 2035)
- 31.3.1.1.2. Clinical Cell Therapy Manufacturing Market in Canada, Historical Trends (since 2023) and Forecasted Estimates (till 2035)
- 31.3.1.2. Clinical Cell Therapy Manufacturing Market in Europe, Historical Trends (since 2023) and Forecasted Estimates (till 2035)
- 31.3.1.2.1. Clinical Cell Therapy Manufacturing Market in Spain, Historical Trends (since 2023) and Forecasted Estimates (till 2035)
- 31.3.1.2.2. Clinical Cell Therapy Manufacturing Market in France, Historical Trends (since 2023) and Forecasted Estimates (till 2035)
- 31.3.1.2.3. Clinical Cell Therapy Manufacturing Market in Germany, Historical Trends (since 2023) and Forecasted Estimates (till 2035)
- 31.3.1.2.4. Clinical Cell Therapy Manufacturing Market in the UK, Historical Trends (since 2023) and Forecasted Estimates (till 2035)
- 31.3.1.2.5. Clinical Cell Therapy Manufacturing Market in Italy, Historical Trends (since 2023) and Forecasted Estimates (till 2035)
- 31.3.1.3. Clinical Cell Therapy Manufacturing Market in Asia-Pacific and Rest of the World, Historical Trends (since 2023) and Forecasted Estimates (till 2035)
- 31.3.1.3.1. Clinical Cell Therapy Manufacturing Market in China, Historical Trends (since 2023) and Forecasted Estimates (till 2035)
- 31.3.1.3.2. Clinical Cell Therapy Manufacturing Market in Singapore, Historical Trends (since 2023) and Forecasted Estimates (till 2035)
- 31.3.1.3.3. Clinical Cell Therapy Manufacturing Market in South Korea, Historical Trends (since 2023) and Forecasted Estimates (till 2035)
- 31.3.1.3.4. Clinical Cell Therapy Manufacturing Market in Israel, Historical Trends (since 2023) and Forecasted Estimates (till 2035)
- 31.3.1.3.5. Clinical Cell Therapy Manufacturing Market in Japan, Historical Trends (since 2023) and Forecasted Estimates (till 2035)
- 31.3.1.3.6. Clinical Cell Therapy Manufacturing Market in Taiwan, Historical Trends (since 2023) and Forecasted Estimates (till 2035)
- 31.3.1.3.7. Clinical Cell Therapy Manufacturing Market in Brazil, Historical Trends (since 2023) and Forecasted Estimates (till 2035)
- 31.3.1.3.8. Clinical Cell Therapy Manufacturing Market in Argentina, Historical Trends (since 2023) and Forecasted Estimates (till 2035)
- 31.3.1.3.9. Clinical Cell Therapy Manufacturing Market in South Africa, Historical Trends (since 2023) and Forecasted Estimates (till 2035)
- 31.3.1.1. Clinical Cell Therapy Manufacturing Market in North America, Historical Trends (since 2023) and Forecasted Estimates (till 2035)
- 31.3.2. Commercial Cell Therapy Manufacturing Market
- 31.3.2.1. Commercial Cell Therapy Manufacturing Market in North America, Historical Trends (since 2023) and Forecasted Estimates (till 2035)
- 31.3.2.1.1. Commercial Cell Therapy Manufacturing Market in the US, Historical Trends (since 2023) and Forecasted Estimates (till 2035)
- 31.3.2.1.2. Commercial Cell Therapy Manufacturing Market in Canada, Historical Trends (since 2023) and Forecasted Estimates (till 2035)
- 31.3.2.2. Commercial Cell Therapy Manufacturing Market in Europe, Historical Trends (since 2023) and Forecasted Estimates (till 2035)
- 31.3.2.2.1. Commercial Cell Therapy Manufacturing Market in Germany, Historical Trends (since 2023) and Forecasted Estimates (till 2035)
- 31.3.2.2.2. Commercial Cell Therapy Manufacturing Market in France, Historical Trends (since 2023) and Forecasted Estimates (till 2035)
- 31.3.2.2.3. Commercial Cell Therapy Manufacturing Market in the UK, Historical Trends (since 2023) and Forecasted Estimates (till 2035)
- 31.3.2.2.4. Commercial Cell Therapy Manufacturing Market in Italy, Historical Trends (since 2023) and Forecasted Estimates (till 2035)
- 31.3.2.2.5. Commercial Cell Therapy Manufacturing Market in Spain, Historical Trends (since 2023) and Forecasted Estimates (till 2035)
- 31.3.2.2.6. Commercial Cell Therapy Manufacturing Market in Rest of Europe, Historical Trends (since 2023) and Forecasted Estimates (till 2035)
- 31.3.2.3. Commercial Cell Therapy Manufacturing Market in Asia-Pacific and Rest of the World, Historical Trends (since 2023) and Forecasted Estimates (till 2035)
- 31.3.2.3.1. Commercial Cell Therapy Manufacturing Market in China, Historical Trends (since 2023) and Forecasted Estimates (till 2035)
- 31.3.2.3.2. Commercial Cell Therapy Manufacturing Market in Japan, Historical Trends (since 2023) and Forecasted Estimates (till 2035)
- 31.3.2.3.3. Commercial Cell Therapy Manufacturing Market in Australia, Historical Trends (since 2023) and Forecasted Estimates (2025-2035)
- 31.3.2.3.4. Commercial Cell Therapy Manufacturing Market in India, Historical Trends (since 2023) and Forecasted Estimates (till 2035)
- 31.3.2.3.5. Commercial Cell Therapy Manufacturing Market in South Korea, Historical Trends (since 2023) and Forecasted Estimates (till 2035)
- 31.3.2.3.6. Commercial Cell Therapy Manufacturing Market in Brazil, Historical Trends (since 2024) and Forecasted Estimates (till 2035)
- 31.3.2.1. Commercial Cell Therapy Manufacturing Market in North America, Historical Trends (since 2023) and Forecasted Estimates (till 2035)
- 31.3.1. Clinical Cell Therapy Manufacturing Market
- 31.4. Penetration Growth (P-G) Matrix
- 31.5. Market Dynamics Assessment
32. CELL THERAPY MANUFACTURING MARKET OPPORTUNITY ANALYSIS: NORTH AMERICA
- 32.1. Cell Therapy Manufacturing Market in North America: Distribution by Type of Cell therapy
- 32.1.1. Cell Therapy Manufacturing Market in North America for CAR-T Cell Therapies, Historical Trends (since 2022) and Forecasted Estimates (till 2035)
- 32.1.2. Cell Therapy Manufacturing Market in North America for Stem Cell Therapies, Historical Trends (since 2022) and Forecasted Estimates (till 2035)
- 32.1.3. Cell Therapy Manufacturing Market in North America for TCR Cell Therapies, Historical Trends (since 2022) and Forecasted Estimates (till 2035)
- 32.1.4. Cell Therapy Manufacturing Market in North America for TIL Cell Therapies, Historical Trends (since 2022) and Forecasted Estimates (till 2035)
- 32.1.5. Cell Therapy Manufacturing Market in North America for Dendritic Cell Therapies, Historical Trends (since 2022) and Forecasted Estimates (till 2035)
- 32.1.6. Cell Therapy Manufacturing Market in North America for Other Cell Therapies, Historical Trends (since 2022) and Forecasted Estimates (till 2035)
- 32.2. Cell Therapy Manufacturing Market in North America: Distribution by Source of Cells
- 32.2.1. Cell Therapy Manufacturing Market in North America for Autologous Cells, Historical Trends (since 2022) and Forecasted Estimates (till 2035)
- 32.2.2. Cell Therapy Manufacturing Market in North America for Allogeneic Cells, Historical Trends (since 2022) and Forecasted Estimates (till 2035)
- 32.2.3. Cell Therapy Manufacturing Market in North America for Other Cells, Historical Trends (since 2022) and Forecasted Estimates (till 2035)
- 32.3. Cell Therapy Manufacturing Market in North America: Distribution by Scale of Operation
- 32.3.1. Cell Therapy Manufacturing Market in North America for Clinical Scale, Historical Trends (since 2022) and Forecasted Estimates (till 2035)
- 32.3.2. Cell Therapy Manufacturing Market in North America for Commercial Scale, Historical Trends (since 2022) and Forecasted Estimates (till 2035)
- 32.4. Cell Therapy Manufacturing Market in North America: Distribution by Type of Manufacturer
- 32.4.1. Cell Therapy Manufacturing Market in North America for Contract Manufacturing Organizations, Historical Trends (since 2022) and Forecasted Estimates (till 2035)
- 32.4.2. Cell Therapy Manufacturing Market in North America for In-House Manufacturers, Historical Trends (since 2022) and Forecasted Estimates (till 2035)
33. CELL THERAPY MANUFACTURING MARKET OPPORTUNITY ANALYSIS: EUROPE
- 33.1. Cell Therapy Manufacturing Market in Europe: Distribution by Type of Cell therapy
- 33.1.1. Cell Therapy Manufacturing Market in Europe for CAR-T Cell Therapies, Historical Trends (since 2022) and Forecasted Estimates (till 2035)
- 33.1.2. Cell Therapy Manufacturing Market in Europe for Stem Cell Therapies, Historical Trends (since 2022) and Forecasted Estimates (till 2035)
- 33.1.3. Cell Therapy Manufacturing Market in Europe for TCR Cell Therapies, Historical Trends (since 2022) and Forecasted Estimates (till 2035)
- 33.1.4. Cell Therapy Manufacturing Market in Europe for TIL Cell Therapies, Historical Trends (since 2022) and Forecasted Estimates (till 2035)
- 33.1.5. Cell Therapy Manufacturing Market in Europe for Dendritic Cell Therapies, Historical Trends (since 2022) and Forecasted Estimates (till 2035)
- 33.1.6. Cell Therapy Manufacturing Market in Europe for Other Cell Therapies, Historical Trends (since 2022) and Forecasted Estimates (till 2035)
- 33.2. Cell Therapy Manufacturing Market in Europe: Distribution by Source of Cells
- 33.2.1. Cell Therapy Manufacturing Market in Europe for Autologous Cells, Historical Trends (since 2022) and Forecasted Estimates (till 2035)
- 33.2.2. Cell Therapy Manufacturing Market in Europe for Allogeneic Cells, Historical Trends (since 2022) and Forecasted Estimates (till 2035)
- 33.2.3. Cell Therapy Manufacturing Market in Europe for Other Cells, Historical Trends (since 2022) and Forecasted Estimates (till 2035)
- 33.3. Cell Therapy Manufacturing Market in Europe: Distribution by Scale of Operation
- 33.3.1. Cell Therapy Manufacturing Market in Europe for Clinical Scale, Historical Trends (since 2022) and Forecasted Estimates (till 2035)
- 33.3.2. Cell Therapy Manufacturing Market in Europe for Commercial Scale, Historical Trends (since 2022) and Forecasted Estimates (till 2035)
- 33.4. Cell Therapy Manufacturing Market in Europe: Distribution by Type of Manufacturer
- 33.4.1. Cell Therapy Manufacturing Market in Europe for Contract Manufacturing Organizations, Historical Trends (since 2022) and Forecasted Estimates (till 2035)
- 33.4.2. Cell Therapy Manufacturing Market in Europe for In-House Manufacturers, Historical Trends (since 2022) and Forecasted Estimates (till 2035)
34. CELL THERAPY MANUFACTURING MARKET OPPORTUNITY ANALYSIS: ASIA-PACIFIC AND REST OF THE WORLD
- 34.1. Cell Therapy Manufacturing Market in Asia-Pacific and Rest of the World: Distribution by Type of Cell therapy
- 34.1.1. Cell Therapy Manufacturing Market in Asia-Pacific and Rest of the World for CAR-T Cell Therapies, Historical Trends (since 2022) and Forecasted Estimates (till 2035)
- 34.1.2. Cell Therapy Manufacturing Market in Asia-Pacific and Rest of the World for Stem Cell Therapies, Historical Trends (since 2022) and Forecasted Estimates (till 2035)
- 34.1.3. Cell Therapy Manufacturing Market in Asia-Pacific and Rest of the World for TCR Cell Therapies, Historical Trends (since 2022) and Forecasted Estimates (till 2035)
- 34.1.4. Cell Therapy Manufacturing Market in Asia-Pacific and Rest of the World for TIL Cell Therapies, Historical Trends (since 2022) and Forecasted Estimates (till 2035)
- 34.1.5. Cell Therapy Manufacturing Market in Asia-Pacific and Rest of the World for Dendritic Cell Therapies, Historical Trends (since 2022) and Forecasted Estimates (till 2035)
- 34.1.6. Cell Therapy Manufacturing Market in Asia-Pacific and Rest of the World for Other Cell Therapies, Historical Trends (since 2022) and Forecasted Estimates (till 2035)
- 34.2. Cell Therapy Manufacturing Market in Asia-Pacific and Rest of the World: Distribution by Source of Cells
- 34.2.1. Cell Therapy Manufacturing Market in Asia-Pacific and Rest of the World for Autologous Cells, Historical Trends (since 2022) and Forecasted Estimates (till 2035)
- 34.2.2. Cell Therapy Manufacturing Market in Asia-Pacific and Rest of the World for Allogeneic Cells, Historical Trends (since 2022) and Forecasted Estimates (till 2035)
- 34.2.3. Cell Therapy Manufacturing Market in Asia-Pacific and Rest of the World for Other Cells, Historical Trends (since 2022) and Forecasted Estimates (till 2035)
- 34.3. Cell Therapy Manufacturing Market in Asia-Pacific and Rest of the World: Distribution by Scale of Operation
- 34.3.1. Cell Therapy Manufacturing Market in Asia-Pacific and Rest of the World for Clinical Scale, Historical Trends (since 2022) and Forecasted Estimates (till 2035)
- 34.3.2. Cell Therapy Manufacturing Market in Asia-Pacific and Rest of the World for Commercial Scale, Historical Trends (since 2022) and Forecasted Estimates (till 2035)
- 34.4. Cell Therapy Manufacturing Market in Asia-Pacific and Rest of the World: Distribution by Type of Manufacturer
- 34.4.1. Cell Therapy Manufacturing Market in Asia-Pacific and Rest of the World for Contract Manufacturing Organizations, Historical Trends (since 2022) and Forecasted Estimates (till 2035)
- 34.4.2. Cell Therapy Manufacturing Market in Asia-Pacific and Rest of the World for In-House Manufacturers, Historical Trends (since 2022) and Forecasted Estimates (till 2035)
- *Detailed information on Chapters 32-34 is available in the Excel Data Packs shared along with the report**
35. CONCLUDING REMARKS
36. EXECUTIVE INSIGHTS
- 36.1. Chapter Overview
- 36.2. Company A (Mid-sized Company, Australia)
- 36.2.1. Company Snapshot
- 36.2.2. Interview Transcript: Marketing Manager, Cell Therapy
- 36.3. Company B (UK)
- 36.3.1. Company Snapshot
- 36.3.2. Interview Transcript: Director
- 36.4. Company C (Small Company, Belgium)
- 36.4.1. Company Snapshot
- 36.4.2. Interview Transcript: Marketing Director
- 36.5. Company D (Large Company, Poland)
- 36.5.1. Company Snapshot
- 36.5.2. Interview Transcript: Management Board Vice-President
- 36.6. Company E (Small Company, US)
- 36.6.1. Company Snapshot
- 36.6.2. Interview Transcript: Senior Director of Sales Advanced Therapies; Vice President of Marketing
- 36.7. Company F (Mid-sized Company, Japan)
- 36.7.1. Company Snapshot
- 36.7.2. Interview Transcript: Business Administration Department Manager
- 36.8. Company G (Small Company, Netherlands)
- 36.8.1. Company Snapshot
- 36.8.2. Interview Transcript: Chief Business Officer
- 36.9. Company H (US)
- 36.9.1. Company Snapshot
- 36.9.2. Interview Transcript: Director of Finance and Facility Operations
- 36.10. Company I (Very Large Company, Japan)
- 36.10.1. Company Snapshot
- 36.10.2. Interview Transcript: Senior Director
- 36.11. Company J (Mid-sized Company, UK)
- 36.11.1. Company Snapshot
- 36.11.2. Interview Transcript: Chief Executive Officer
- 36.12. Company K (Large Company, US)
- 36.12.1. Company Snapshot
- 36.12.2. Interview Transcript: Former Chief Technical Officer
- 36.13. Company L (Small Company, Netherlands)
- 36.13.1. Company Snapshot
- 36.13.2. Interview Transcript: Former Chief Executive Officer,
- 36.14. Company M (Small Company, France)
- 36.14.1. Company Snapshot
- 36.14.2. Interview Transcript: Former General Manager
- 36.15. Company N (Large Company, China)
- 36.15.1. Company Snapshot
- 36.15.2. Interview Transcript: Chief Executive Officer
- 36.16. Company O (Small Company, Israel)
- 36.16.1. Company Snapshot
- 36.16.2. Interview Transcript: Executive Vice President Research and Development
- 36.17. Company P (Mid-sized Company, UK)
- 36.17.1. Company Snapshot
- 36.17.2. Interview Transcript: Former Business Development Manager
- 36.18. Company Q (US)
- 36.18.1. Company Snapshot
- 36.18.2. Interview Transcript: Professor and American Red Cross Chair in Transfusion Medicine
- 36.19. Company R (Small Company, Singapore)
- 36.19.1. Company Snapshot
- 36.19.2. Interview Transcript: Former Co-Founder and Chief Executive Officer
- 36.20. Company S (Mid-sized Company, Canada)
- 36.20.1. Company Snapshot
- 36.20.2. Interview Transcript: Former Manager, Business Development and Operations-cGMP Manufacturing Unit
- 36.21. Company T (Small Company, US)
- 36.21.1. Company Snapshot
- 36.21.2. Interview Transcript: Manager of Business Development
- 36.22. Company U (Mid-sized Company, France)
- 36.22.1. Company Snapshot
- 36.22.2. Interview Transcript: Former Department Leader, Cell Therapy Innovation and Development
- 36.23. Company V (Mid-sized Company, Australia)
- 36.23.1. Company Snapshot
- 36.23.2. Interview Transcript: Former Chief Executive Officer
- 36.24. Company W (Small Company, Netherlands)
- 36.24.1. Company Snapshot
- 36.24.2. Interview Transcript: Chief Executive Officer
37. APPENDIX I: TABULATED DATA
38. APPENDIX II: LIST OF COMPANIES AND ORGANIZATIONS
List of Tables
- Table 6.1 Cell-based Therapies: Applications
- Table 6.2 Differences between Cell Therapy and Biotechnological Products
- Table 6.3 Cell-based Therapies: Commercialized Products
- Table 6.4 Assessment of Cell Therapy Manufacturing Steps
- Table 6.5 Advantages and Disadvantages of Centralized and Decentralized Manufacturing Models
- Table 7.1 Industry Players: Information on Year of Establishment, Company Size, Location of Headquarters, Number of Manufacturing Facilities and Location of Manufacturing Facility
- Table 7.2 Industry Players: Information on Type of Immune Cell Offered
- Table 7.3 Industry Players: Information on Source of Cells and Scale of Operation
- Table 7.4 Industry Players: Information on Type of Additional Service Offered
- Table 8.1 Non-Industry Players: Information on Year of Establishment, Location of Headquarters, Number of Manufacturing Facilities and Location of Manufacturing Facility
- Table 8.2 Non-Industry Players: Information on Type of Immune Cell Offered
- Table 8.3 Non-Industry Players: Information on Source of Cell and Scale of Operation
- Table 8.4 Non-Industry Players: Information on Type of Additional Service Offered
- Table 9.1 Cell Therapy Manufacturing (Industry Players): Regulatory Authorities
- Table 9.2 Cell Therapy Manufacturing (Non-Industry Players): Regulatory Authorities
- Table 9.3 Summary of Guidelines for Early-Stage Manufacturing of Cell Therapies
- Table 10.1 Cell Therapy Manufacturing: Roadmap for the US
- Table 10.2 Cell Processing: Challenges and Strategies
- Table 10.3 Cell Preservation, Distribution and Handling: Challenges and Strategies
- Table 10.4 Process Monitoring and Quality Control: Challenges and Strategies
- Table 10.5 Standardization and Regulatory Support: Challenges and Strategies
- Table 10.6 Workforce Development: Challenges and Strategies
- Table 10.7 Supply Chain and Logistics: Challenges and Strategies
- Table 10.8 Cell Therapy Manufacturing: Roadmap for the Asia Pacific Economic Cooperation (APEC)
- Table 11.1 Cell Therapy Manufacturing: List of Automated and Closed Cell Therapy Processing Systems
- Table 12.1 Cell Therapy Manufacturing Industry Players: List of Companies Profiled
- Table 12.2 Advanced Therapies: Company Snapshot
- Table 12.3 Advanced Therapies: Information on Manufacturing Facilities and Capabilities
- Table 12.4 Advanced Therapies: Recent Developments and Future Outlook
- Table 12.5 AGC Biologics: Company Snapshot
- Table 12.6 AGC Biologics: Information on Manufacturing Facilities and Capabilities
- Table 12.7 AGC Biologics: Recent Developments and Future Outlook
- Table 12.8 Catalent: Company Snapshot
- Table 12.9 Catalent: Information on Manufacturing Facilities and Capabilities
- Table 12.10 Catalent: Recent Developments and Future Outlook
- Table 12.11 Charles River Laboratories: Company Snapshot
- Table 12.12 Charles River Laboratories: Information on Manufacturing Facilities and Capabilities
- Table 12.13 Charles River Laboratories: Recent Developments and Future Outlook
- Table 12.14 ImmunityBio: Company Snapshot
- Table 12.15 ImmunityBio: Information on Manufacturing Facilities and Capabilities
- Table 12.16 ImmunityBio: Recent Developments and Future Outlook
- Table 12.17 Merck Millipore: Company Snapshot
- Table 12.18 Merck Millipore: Information on Manufacturing Facilities and Capabilities
- Table 12.19 Merck Millipore: Recent Developments and Future Outlook
- Table 12.20 Minaris Advanced Therapies: Company Snapshot
- Table 12.21 Minaris Advanced Therapies: Information on Manufacturing Facilities and Capabilities
- Table 12.22 Minaris Advanced Therapies: Recent Developments and Future Outlook
- Table 12.23 Resilience: Company Snapshot
- Table 12.24 Resilience: Information on Manufacturing Facilities and Capabilities
- Table 12.25 Resilience: Recent Developments and Future Outlook
- Table 12.26 SK pharmteco (Subsidiary of SK Inc.): Company Snapshot
- Table 12.27 SK pharmteco (Subsidiary of SK Inc.): Information on Manufacturing Facilities and Capabilities
- Table 12.28 SK pharmteco (Subsidiary of SK Inc.): Recent Developments and Future Outlook
- Table 12.29 Thermo Fisher Scientific: Company Snapshot
- Table 12.30 Thermo Fisher Scientific: Information on Manufacturing Facilities and Capabilities
- Table 12.31 Thermo Fisher Scientific: Recent Developments and Future Outlook
- Table 13.1 Cell Therapy Manufacturing (Non-Industry Players): List of Organizations Profiled
- Table 13.2 City of Hope: Overview
- Table 13.3 City of Hope: Service Portfolio
- Table 13.4 Clinical Cell and Vaccine Production Facility (CVPF): Overview
- Table 13.5 Clinical Cell and Vaccine Production Facility (CVPF): Service Portfolio
- Table 13.6 Fraunhofer Institute for Cell Therapy and Immunology: Overview
- Table 13.7 Fraunhofer Institute for Cell Therapy and Immunology: Service Portfolio
- Table 13.8 Newcastle Advanced Therapies: Overview
- Table 13.9 Newcastle Advanced Therapies: Service Portfolio
- Table 13.10 NHS Blood and Transplant: Overview
- Table 13.11 NHS Blood and Transplant: Service Portfolio
- Table 13.12 Rayne Cell Therapy Suite (King's College London): Overview
- Table 13.13 Rayne Cell Therapy Suite (King's College London): Service Portfolio
- Table 13.14 Scottish National Blood Transfusion Service (SNBTS) Cellular Therapy Facility: Overview
- Table 13.15 Scottish National Blood Transfusion Service (SNBTS) Cellular Therapy Facility: Service Portfolio
- Table 14.1 Cell Therapy Manufacturing: List of Non-Profit Organizations
- Table 14.2 CellCAN: Overview
- Table 14.3 Cell Therapy Manufacturing Cooperative Research Center: Overview
- Table 14.4 National Cell Manufacturing Consortium: Overview
- Table 14.5 California's Institute of Regenerative Medicine: Overview
- Table 16.1 Cell Therapy Manufacturing: List of Partnerships and Collaborations
- Table 16.2 Partnerships and Collaborations: Information on Type of Immune Cell Offered and Scale of Operation
- Table 16.3 Partnerships and Collaborations: Information on Location of Headquarters (Country and Region) and Type of Agreement (Country and Region)
- Table 17.1 Cell Therapy Manufacturing: List of Expansions
- Table 17.2 Cell Therapy Manufacturing: Type of Immune Cell Offered and Scale of Operation
- Table 18.1 List of Top 10 Big Pharma Players
- Table 18.2 Big Pharma Players: List of Cell Therapy Manufacturing Focused Initiatives, Since 2021
- Table 18.3 Big Pharma Initiatives: Information on Type of Immune Cell Offered and Scale of Operation
- Table 19.1 Average Installed Cell Therapy Manufacturing Capacity (Number of Cleanrooms): Sample Data Set for Industry Players
- Table 19.2 Average Installed Cell Therapy Manufacturing Capacity (Cleanroom Area): Sample Data Set for Industry Players
- Table 19.3 Global Installed capacity of industry players for cell therapy manufacturing (Number of Cleanrooms): Distribution by Company Size
- Table 19.4 Global Installed capacity of industry players for cell therapy manufacturing (Cleanroom Area): Distribution by Company Size
- Table 19.5 Median Installed Cell Therapy Manufacturing Capacity (Number of Cleanrooms): Data Set for Non-Industry Players
- Table 19.6 Median Installed Cell Therapy Manufacturing Capacity (Cleanroom Area): Dat Set for Non-Industry Players
- Table 21.1 Costs Associated with Manufacturing Stem Cell Therapies
- Table 21.2 Pricing Model: Price of Marketed Drugs (Antibody Drug Conjugates and Monoclonal Antibodies)
- Table 21.3 T-cell Immunotherapies: Expert Opinions on Pricing
- Table 21.4 CAR-T Cell Therapies: Reimbursement Landscape
- Table 23.1 Total Cost of Ownership for Mid-sized Cell Therapy Manufacturing Organizations, Y0-Y20 (USD Million)
- Table 23.2 Total Cost of Ownership: Sample Dataset
- Table 25.1 Survey Insights: Overview of Respondents
- Table 25.2 Survey Insights: Designations and Seniority Levels
- Table 25.3 Survey Insights: Type of Cell Therapy
- Table 25.4 Survey Insights: Scale of Operation
- Table 25.5 Survey Insights: Source of Cells
- Table 25.6 Survey Insights: Cell Culture System
- Table 25.7 Survey Insights: Availability of Fill / Finish Services
- Table 37.1 Industry Players: Distribution by Year of Establishment
- Table 37.2 Industry Players: Distribution by Company Size
- Table 37.3 Industry Players: Distribution by Location of Headquarters (Region)
- Table 37.4 Industry Players: Distribution by Location of Headquarters (Country)
- Table 37.5 Industry Players: Distribution by Company Size and Location of Headquarters (Region)
- Table 37.6 Industry Players: Distribution by Location of Manufacturing Facility (Region)
- Table 37.7 Industry Players: Distribution by Location of Manufacturing Facility (Country)
- Table 37.8 Industry Players: Distribution by Type of Immune Cell Offered
- Table 37.9 Industry Players: Distribution by Source of Cells
- Table 37.10 Industry Players: Distribution by Scale of Operation
- Table 37.11 Industry Players: Distribution by Type of Additional Service Offered
- Table 37.12 Non-Industry Players: Distribution by Year of Establishment
- Table 37.13 Non-Industry Players: Distribution by Location of Headquarters (Region)
- Table 37.14 Non-Industry Players: Distribution by Location of Headquarters (Country)
- Table 37.15 Non-Industry Players: Distribution by Location of Manufacturing Facility (Region)
- Table 37.16 Non-Industry Players: Distribution by Location of Manufacturing Facility (Country)
- Table 37.17 Non-Industry Players: Distribution by Type of Immune Cell Offered
- Table 37.18 Non-Industry Players: Distribution by Source of Cell
- Table 37.19 Non-Industry Players: Distribution by Scale of Operation
- Table 37.20 Non-Industry Players: Distribution by Type of Additional Service Offered
- Table 37.21 Cell Therapy Manufacturing (Industry Players): Distribution by Regulatory Authorities / Certifications
- Table 37.22 Cell Therapy Manufacturing (Non-Industry Players): Distribution by Regulatory Authorities / Certifications
- Table 37.23 WuXi AppTec (parent company of Advanced Therapies): Annual Revenues, FY 2022 - H1 FY 2025 (RMB Billion)
- Table 37.24 AGC Biologics: Annual Revenues, FY 2022 - H1 FY 2025 (JPY Billion)
- Table 37.25 Catalent: Annual Revenues, FY 2021 - Q1 FY 2025 (USD Billion)
- Table 37.26 Charles River Laboratories: Annual Revenues, FY 2022- H1 FY 2025 (USD Billion)
- Table 37.27 ImmunityBio: Annual Revenues, FY 2023- H1 FY 2025 (USD Million)
- Table 37.28 Merck KGaA (Parent company of Merck Millipore): Annual Revenues, FY 2022- H1 FY 2025 (EUR Billion)
- Table 37.29 Thermo Fisher Scientific: Annual Revenues, FY 2022 - 9M FY 2025 (JPY Billion)
- Table 37.30 Evotec: Annual Revenues, FY 2022 - H1 FY 2025 (EUR Million)
- Table 37.31 Lonza: Annual Revenues, FY 2022 - H1 FY 2025 (CHF Billion)
- Table 37.32 Sartorius: Annual Revenues, FY 2022 - 9M FY 2025 (EUR Billion)
- Table 37.33 Astellas Pharma: Annual Revenues, FY 2022 - Q1 FY 2025 (YEN Billion)
- Table 37.34 Pharmaron: Annual Revenues, FY 2022 - H1 FY 2025 (RMB Billion)
- Table 37.35 Takara Bio: Annual Revenues, FY 2023 - Q1 FY 2026 (YEN Billion)
- Table 37.36 Clinical Trial Analysis: Distribution by Trial Registration Year, Since 2021
- Table 37.37 Clinical Trial Analysis: Distribution by Trial Registration Year and Enrolled Patient Population, Since 2021
- Table 37.38 Clinical Trial Analysis: Distribution by Trial Status
- Table 37.39 Clinical Trial Analysis: Distribution by Trial Registration Year and Trial Status
- Table 37.40 Clinical Trial Analysis: Distribution by Trial Phase
- Table 37.41 Clinical Trial Analysis: Distribution of Enrolled Patient Population by Trial Phase
- Table 37.42 Clinical Trial Analysis: Distribution by Patient Gender
- Table 37.43 Clinical Trial Analysis: Distribution by Type of Allocation
- Table 37.44 Clinical Trial Analysis: Distribution by Type of Intervention Model
- Table 37.45 Clinical Trial Analysis: Distribution by Type of Masking
- Table 37.46 Clinical Trial Analysis: Distribution by Type of Sponsor / Collaborator
- Table 37.47 Most Active Industry Players: Distribution by Number of Registered Trials
- Table 37.48 Most Active Non-Industry Players: Distribution by Number of Registered Trials
- Table 37.49 Clinical Trial Analysis: Distribution of Clinical Trials by Geography
- Table 37.50 Clinical Trial Analysis: Distribution of Clinical Trials by Trial Status and Geography
- Table 37.51 Clinical Trial Analysis: Distribution of Enrolled Patient Population by Trial Status and Geography
- Table 37.52 Partnerships and Collaborations: Cumulative Year-wise Trend, Since 2021
- Table 37.53 Partnerships and Collaborations: Distribution by Type of Partnership
- Table 37.54 Partnerships and Collaborations: Distribution by Year and Type of Partnership
- Table 37.55 Partnerships and Collaborations: Distribution by Type of Immune Cell
- Table 37.56 Partnerships and Collaborations: Distribution by Scale of Operation
- Table 37.57 Most Active Players: Distribution by Number of Partnerships
- Table 37.58 Partnerships and Collaborations: Local and International Agreements
- Table 37.59 Partnerships and Collaborations: Intracontinental and Intercontinental Agreements
- Table 37.60 Recent Expansions: Cumulative Year-wise Trend, Since 2021
- Table 37.61 Recent Expansions: Distribution by Type of Expansion
- Table 37.62 Recent Expansions: Distribution by Year and Type of Expansion
- Table 37.63 Recent Expansions: Distribution by Location of Expanded Facility (Region)
- Table 37.64 Recent Expansions: Distribution by Location of Expanded Facility (Country)
- Table 37.65 Recent Expansions: Distribution by Type of Expansion and Location of Headquarters (Country)
- Table 37.66 Recent Expansions: Distribution by Type of Immune Cell
- Table 37.67 Recent Expansions: Distribution by Type of Expansion and Type of Immune Cell
- Table 37.68 Recent Expansions: Distribution by Scale of Operation
- Table 37.69 Most Active Players: Distribution by Number of Expansions
- Table 37.70 Most Active Players: Distribution by Area of Expansion (in sq ft)
- Table 37.71 Big Pharma Initiatives: Distribution by Year of Initiative
- Table 37.72 Big Pharma Initiatives: Distribution by Type of Initiative
- Table 37.73 Big Pharma Initiatives: Distribution by Year and Type of Initiative
- Table 37.74 Big Pharma Initiatives: Distribution of Big Pharma Players by Number of Initiatives
- Table 37.75 Big Pharma Initiatives: Distribution by Type of Partnership
- Table 37.76 Big Pharma Initiatives: Distribution of Big Pharma Players by Number of Partnerships
- Table 37.77 Big Pharma Initiatives: Distribution by Type of Facility Expansion
- Table 37.78 Big Pharma Initiatives: Distribution of Big Pharma Players by Number of Facility Expansion
- Table 37.79 Big Pharma Initiatives: Distribution of Big Pharma Players by Region of Facility Expansion
- Table 37.80 Big Pharma Initiatives: Distribution of Big Pharma Players by Number of Mergers and Acquisitions
- Table 37.81 Big Pharma Initiatives: Distribution of Big Pharma Players by Number of Funding and Investment
- Table 37.82 Big Pharma Initiatives: Distribution by Type of Immune Cell
- Table 37.83 Big Pharma Initiatives: Distribution by Scale of Operation
- Table 37.84 Big Pharma Initiatives: Distribution of Big Pharma Players by Scale of Operation
- Table 37.85 Big Pharma Initiatives Summary
- Table 37.86 Global Installed Capacity of Industry Players for Cell Therapy Manufacturing: Distribution by Range of Installed Capacity
- Table 37.87 Global Installed Cell Therapy Manufacturing Capacity of Industry Players (Number of Cleanrooms): Distribution by Company Size
- Table 37.88 Global Installed Cell Therapy Manufacturing Capacity of Industry Players (Number of Cleanrooms): Distribution by Scale of Operation
- Table 37.89 Global Installed Cell Therapy Manufacturing Capacity of Industry Players (Number of Cleanrooms): Distribution by Location of Manufacturing Facility
- Table 37.90 Global Installed Cell Therapy Manufacturing Capacity of Industry Players (Number of Cleanrooms): Distribution by Company Size and Location of Manufacturing Facility
- Table 37.91 Global Installed Cell Therapy Manufacturing Capacity of Industry Players (Number of Cleanrooms): Distribution by Scale of Operation and Location of Manufacturing Facility
- Table 37.92 Global Installed Capacity of Industry Players for Cell Therapy Manufacturing (Cleanroom Area, sq. ft.): Distribution by Company Size and Range of Installed Capacity
- Table 37.93 Global Installed Cell Therapy Manufacturing Capacity of Industry Players (Cleanroom Area): Distribution by Company Size
- Table 37.94 Global Installed Cell Therapy Manufacturing Capacity of Industry Players (Cleanroom Area): Distribution by Scale of Operation
- Table 37.95 Global Installed Cell Therapy Manufacturing Capacity of Industry Players (Cleanroom Area): Distribution by Location of Manufacturing Facility
- Table 37.96 Global Installed Cell Therapy Manufacturing Capacity of Industry Players (Cleanroom Area): Distribution by Company Size and Location of Manufacturing Facility
- Table 37.97 Global Installed Cell Therapy Manufacturing Capacity of Industry Players (Cleanroom Area): Distribution by Scale of Operation and Location of Manufacturing Facility
- Table 37.98 Global Installed Capacity of Non-Industry Players for Cell Therapy Manufacturing: Distribution by Range of Number of Cleanrooms
- Table 37.99 Global Installed Cell Therapy Manufacturing Capacity of Non-Industry Players (Number of Cleanrooms): Distribution by Scale of Operation
- Table 37.100 Global Installed Cell Therapy Manufacturing Capacity of Non-Industry Players (Number of Cleanrooms): Distribution by Location of Manufacturing Facility
- Table 37.101 Global Installed Cell Therapy Manufacturing Capacity of Non-Industry Players (Cleanroom Area): Distribution by Range of Installed Capacity
- Table 37.102 Global Installed Cell Therapy Manufacturing Capacity of Non-Industry Players (Cleanroom Area): Distribution by Scale of Operation
- Table 37.103 Global Installed Cell Therapy Manufacturing Capacity of Non-Industry Players (Cleanroom Area): Distribution by Location of Manufacturing Facility
- Table 37.104 Global Demand for Cell Therapy Manufacturing, Historical Trends (since 2023) and Forecasted Estimates (till 2035) (Number of Patients)
- Table 37.105 Global Demand for Cell Therapy Manufacturing, Historical Trends (since 2023) and Forecasted Estimates (till 2035) (in terms of Number of Cells in Billion)
- Table 37.106 Global Clinical Demand for Cell Therapy Manufacturing, Historical Trends (since 2023) and Forecasted Estimates (till 2035) (in terms of Number of Patients)
- Table 37.107 Clinical Demand for Cell Therapy Manufacturing: Distribution by Type of Cell Therapy, Historical Trends (since 2023) and Forecasted Estimates (till 2035) (in terms of Number of Patients)
- Table 37.108 Clinical Demand for Cell Therapy Manufacturing: Distribution by Geography, Historical Trends (since 2023) and Forecasted Estimates (till 2035) (in terms of Number of Patients)
- Table 37.109 Global Commercial Demand for Cell Therapy Manufacturing, Historical Trends (since 2023) and Forecasted Estimates (till 2035) (in terms of Number of Patients)
- Table 37.110 Commercial Demand for Cell Therapy Manufacturing: Distribution by Type of Cell Therapy, Historical Trends (since 2023) and Forecasted Estimates (till 2035) (in terms of Number of Patients)
- Table 37.111 Commercial Demand for Cell Therapy Manufacturing: Distribution by Geography, Historical Trends (since 2023) and Forecasted Estimates (till 2035) (in terms of Number of Patients)
- Table 37.112 Global Cell Therapy Manufacturing Market, Historical Trends (since 2023) and Forecasted Estimates (till 2035) (USD Million)
- Table 37.113 Global Cell Therapy Manufacturing Market, Forecasted Estimates (till 2035), Conservative Scenario (USD Million)
- Table 37.114 Global Cell Therapy Manufacturing Market, Forecasted Estimates (till 2035), Optimistic Scenario (USD Million)
- Table 37.115 Cell Therapy Manufacturing Market: Distribution by Type of Cell Therapy
- Table 37.116 Cell Therapy Manufacturing Market for CAR-T Cell Therapies, Historical Trends (since 2023) and Forecasted Estimates (till 2035) (USD Million)
- Table 37.117 Cell Therapy Manufacturing Market for Stem Cell Therapies, Historical Trends (since 2023) and Forecasted Estimates (till 2035) (USD Million)
- Table 37.118 Cell Therapy Manufacturing Market for TCR Cell Therapies, Historical Trends (since 2023) and Forecasted Estimates (till 2035) (USD Million)
- Table 37.119 Cell Therapy Manufacturing Market for TIL Cell Therapies, Historical Trends (since 2023) and Forecasted Estimates (till 2035) (USD Million)
- Table 37.120 Cell Therapy Manufacturing Market for Dendritic Cell Therapies, Historical Trends (since 2023) and Forecasted Estimates (till 2035) (USD Million)
- Table 37.121 Cell Therapy Manufacturing Market for Other Cell Therapies, Historical Trends (since 2023) and Forecasted Estimates (till 2035) (USD Million)
- Table 37.122 Cell Therapy Manufacturing Market: Distribution by Source of Cells
- Table 37.123 Cell Therapy Manufacturing Market for Autologous Cells, Historical Trends (since 2023) and Forecasted Estimates (till 2035) (USD Million)
- Table 37.124 Cell Therapy Manufacturing Market for Allogeneic Cells, Historical Trends (since 2023) and Forecasted Estimates (till 2035) (USD Million)
- Table 37.125 Cell Therapy Manufacturing Market for Other Cells, Historical Trends (since 2023) and Forecasted Estimates (till 2035) (USD Million)
- Table 37.126 Cell Therapy Manufacturing Market: Distribution by Scale of Operation
- Table 37.127 Cell Therapy Manufacturing Market for Clinical Scale, Historical Trends (since 2023) and Forecasted Estimates (till 2035) (USD Million)
- Table 37.128 Cell Therapy Manufacturing Market for Commercial Scale, Historical Trends (since 2023) and Forecasted Estimates (till 2035) (USD Million)
- Table 37.129 Cell Therapy Manufacturing Market: Distribution by Type of Manufacturer
- Table 37.130 Cell Therapy Manufacturing Market for Contract Manufacturing Organizations, Historical Trends (since 2023) and Forecasted Estimates (till 2035) (USD Million)
- Table 37.131 Cell Therapy Manufacturing Market for In-House Manufacturers, Historical Trends (since 2023) and Forecasted Estimates (till 2035) (USD Million)
- Table 37.132 Cell Therapy Manufacturing Market: Distribution by Geography
- Table 37.133 Clinical Cell Therapy Manufacturing Market in North America, Historical Trends (since 2023) and Forecasted Estimates (till 2035) (USD Million)
- Table 37.134 Clinical Cell Therapy Manufacturing Market in the US, Historical Trends (since 2023) and Forecasted Estimates (till 2035) (USD Million)
- Table 37.135 Clinical Cell Therapy Manufacturing Market in Canada, Historical Trends (since 2023) and Forecasted Estimates (till 2035) (USD Million)
- Table 37.136 Clinical Cell Therapy Manufacturing Market in Europe, Historical Trends (since 2023) and Forecasted Estimates (till 2035) (USD Million)
- Table 37.137 Clinical Cell Therapy Manufacturing Market in Spain, Historical Trends (since 2023) and Forecasted Estimates (till 2035) (USD Million)
- Table 37.138 Clinical Cell Therapy Manufacturing Market in France, Historical Trends (since 2023) and Forecasted Estimates (till 2035) (USD Million)
- Table 37.139 Clinical Cell Therapy Manufacturing Market in Germany, Historical Trends (since 2023) and Forecasted Estimates (till 2035) (USD Million)
- Table 37.140 Clinical Cell Therapy Manufacturing Market in the UK, Historical Trends (since 2023) and Forecasted Estimates (till 2035) (USD Million)
- Table 37.141 Clinical Cell Therapy Manufacturing Market in Italy, Historical Trends (since 2023) and Forecasted Estimates (till 2035) (USD Million)
- Table 37.142 Clinical Cell Therapy Manufacturing Market in Asia-Pacific and Rest of the World, Historical Trends (since 2023) and Forecasted Estimates (till 2035) (USD Million)
- Table 37.143 Clinical Cell Therapy Manufacturing Market in China, Historical Trends (since 2023) and Forecasted Estimates (till 2035) (USD Million)
- Table 37.144 Clinical Cell Therapy Manufacturing Market in Singapore, Historical Trends (since 2023) and Forecasted Estimates (till 2035) (USD Million)
- Table 37.145 Clinical Cell Therapy Manufacturing Market in South Korea, Historical Trends (since 2023) and Forecasted Estimates (till 2035) (USD Million)
- Table 37.146 Clinical Cell Therapy Manufacturing Market in Israel, Historical Trends (since 2023) and Forecasted Estimates (till 2035) (USD Million)
- Table 37.147 Clinical Cell Therapy Manufacturing Market in Japan, Historical Trends (since 2023) and Forecasted Estimates (till 2035) (USD Million)
- Table 37.148 Clinical Cell Therapy Manufacturing Market in Taiwan, Historical Trends (since 2023) and Forecasted Estimates (till 2035) (USD Million)
- Table 37.149 Clinical Cell Therapy Manufacturing Market in Brazil, Historical Trends (since 2023) and Forecasted Estimates (till 2035) (USD Million)
- Table 37.150 Clinical Cell Therapy Manufacturing Market in Argentina, Historical Trends (since 2023) and Forecasted Estimates (till 2035) (USD Million)
- Table 37.151 Clinical Cell Therapy Manufacturing Market in South Africa, Historical Trends (since 2023) and Forecasted Estimates (till 2035) (USD Million)
- Table 37.152 Commercial Cell Therapy Manufacturing Market in North America, Historical Trends (since 2023) and Forecasted Estimates (till 2035) (USD Million)
- Table 37.153 Commercial Cell Therapy Manufacturing Market in the US, Historical Trends (since 2023) and Forecasted Estimates (till 2035) (USD Million)
- Table 37.154 Commercial Cell Therapy Manufacturing Market in Canada, Historical Trends (since 2023) and Forecasted Estimates (till 2035) (USD Million)
- Table 37.155 Commercial Cell Therapy Manufacturing Market in Europe, Historical Trends (since 2023) and Forecasted Estimates (till 2035) (USD Million)
- Table 37.156 Commercial Cell Therapy Manufacturing Market in Germany, Historical Trends (since 2023) and Forecasted Estimates (till 2035) (USD Million)
- Table 37.157 Commercial Cell Therapy Manufacturing Market in France, Historical Trends (since 2023) and Forecasted Estimates (till 2035) (USD Million)
- Table 37.158 Commercial Cell Therapy Manufacturing Market in the UK, Historical Trends (since 2023) and Forecasted Estimates (till 2035) (USD Million)
- Table 37.159 Commercial Cell Therapy Manufacturing Market in Italy, Historical Trends (since 2023) and Forecasted Estimates (till 2035) (USD Million)
- Table 37.160 Commercial Cell Therapy Manufacturing Market in Spain, Historical Trends (since 2023) and Forecasted Estimates (till 2035) (USD Million)
- Table 37.161 Commercial Cell Therapy Manufacturing Market in Rest of Europe, Historical Trends (since 2023) and Forecasted Estimates (till 2035) (USD Million)
- Table 37.162 Commercial Cell Therapy Manufacturing Market in Asia-Pacific and Rest of the World, Historical Trends (since 2023) and Forecasted Estimates (till 2035) (USD Million)
- Table 37.163 Commercial Cell Therapy Manufacturing Market in China, Historical Trends (since 2023) and Forecasted Estimates (till 2035) (USD Million)
- Table 37.164 Commercial Cell Therapy Manufacturing Market in Japan, Historical Trends (since 2023) and Forecasted Estimates (till 2035) (USD Million)
- Table 37.165 Commercial Cell Therapy Manufacturing Market in Australia, Historical Trends (since 2023) and Forecasted Estimates (till 2035) (USD Million)
- Table 37.166 Commercial Cell Therapy Manufacturing Market in India, Historical Trends (since 2023) and Forecasted Estimates (till 2035) (USD Million)
- Table 37.167 Commercial Cell Therapy Manufacturing Market in South Korea, Historical Trends (since 2023) and Forecasted Estimates (till 2035) (USD Million)
- Table 37.168 Commercial Cell Therapy Manufacturing Market in Brazil, Historical Trends (since 2024) and Forecasted Estimates (till 2035) (USD Million)
List of Figures
- Figure 2.1 Research Methodology: Project Methodology
- Figure 2.2 Research Methodology: Data Sources for Secondary Research
- Figure 2.3 Research Methodology: Robust Quality Control
- Figure 3.1 Market Dynamics: Forecast Methodology
- Figure 3.2 Market Dynamics: Market Assessment Framework
- Figure 4.1 Lessons Learnt from Past Recessions
- Figure 5.1 Executive Summary: Market Landscape
- Figure 5.2 Executive Summary: Market Trends (I / II)
- Figure 5.3 Executive Summary: Market Trends (II / II)
- Figure 5.4 Executive Summary: Market Forecast and Opportunity Analysis
- Figure 6.1 Classification of Advanced Therapy Medicinal Products (ATMPs)
- Figure 6.2 Decentralized Manufacturing: Process Model
- Figure 6.3 Cell Therapy Manufacturing: Type of Manufacturer
- Figure 6.4 Cell Therapies: Challenges and Drivers
- Figure 6.5 Cell Therapies: Potency as a Critical Quality Attribute
- Figure 6.6 Cell Therapy Manufacturing: Supply Chain Model
- Figure 7.1 Industry Players: Distribution by Year of Establishment
- Figure 7.2 Industry Players: Distribution by Company Size
- Figure 7.3 Industry Players: Distribution by Location of Headquarters (Region)
- Figure 7.4 Industry Players: Distribution by Location of Headquarters (Country)
- Figure 7.5 Industry Players: Distribution by Company Size and Location of Headquarters (Region)
- Figure 7.6 Industry Players: Distribution by Location of Manufacturing Facility (Region)
- Figure 7.7 Industry Players: Distribution by Location of Manufacturing Facility (Country)
- Figure 7.8 Industry Players: Distribution by Type of Immune Cell Offered
- Figure 7.9 Industry Players: Distribution by Source of Cells
- Figure 7.10 Industry Players: Distribution by Scale of Operation
- Figure 7.11 Industry Players: Distribution by Type of Additional Service Offered
- Figure 8.1 Non-Industry Players: Distribution by Year of Establishment
- Figure 8.2 Non-Industry Players: Distribution by Location of Headquarters (Region)
- Figure 8.3 Non-Industry Players: Distribution by Location of Headquarters (Country)
- Figure 8.4 Non-Industry Players: Distribution by Location of Manufacturing Facility (Region)
- Figure 8.5 Non-Industry Players: Distribution by Location of Manufacturing Facility (Country)
- Figure 8.6 Non-Industry Players: Distribution by Type of Immune Cell Offered
- Figure 8.7 Non-Industry Players: Distribution by Source of Cell
- Figure 8.8 Non-Industry Players: Distribution by Scale of Operation
- Figure 8.9 Non-Industry Players: Distribution by Type of Additional Service Offered
- Figure 9.1 Cell Therapy Manufacturing (Industry Players): Distribution by Regulatory Authorities / Certifications
- Figure 9.2 Cell Therapy Manufacturing (Non-Industry Players): Distribution by Regulatory Authorities / Certifications
- Figure 11.1 Key Considerations for Automating Cell Therapy Manufacturing Process
- Figure 11.2 Requirements to Implement Closed Systems in Cell Therapy Manufacturing Processes
- Figure 11.3 Functions of Automated and Closed Systems at Each Step of the Cell Therapy Manufacturing Process
- Figure 11.4 Advantages and Disadvantages of Single-Use System
- Figure 11.5 Growth Drivers and Roadblocks to the Automated and Closed Systems
- Figure 11.6 Cell Therapy Manufacturing: Roadmap for Developing an Automated Device
- Figure 11.7 Cell Therapy Manufacturing: Comparison Between Manual and Automated Processes
- Figure 11.8 Cell Therapy Manufacturing: Comparative Analysis of Manual and Automated Processes Based on Affiliated Costs
- Figure 12.1 WuXi AppTec (parent company of Advanced Therapies): Annual Revenues, FY 2022 - H1 FY 2025 (RMB Billion)
- Figure 12.2 AGC Biologics: Annual Revenues, FY 2022 - H1 FY 2025 (JPY Billion)
- Figure 12.3 Catalent: Annual Revenues, FY 2021 - Q1 FY 2025 (USD Billion)
- Figure 12.4 Charles River Laboratories: Annual Revenues, FY 2022- H1 FY 2025 (USD Billion)
- Figure 12.5 ImmunityBio: Annual Revenues, FY 2023- H1 FY 2025 (USD Million)
- Figure 12.6 Merck KGaA (Parent company of Merck Millipore): Annual Revenues, FY 2022- H1 FY 2025 (EUR Billion)
- Figure 12.7 Thermo Fisher Scientific: Annual Revenues, FY 2022 - 9M FY 2025 (JPY Billion)
- Figure 12.8 Evotec: Annual Revenues, FY 2022 - H1 FY 2025 (EUR Million)
- Figure 12.9 Lonza: Annual Revenues, FY 2022 - H1 FY 2025 (CHF Billion)
- Figure 12.10 Sartorius: Annual Revenues, FY 2022 - 9M FY 2025 (EUR Billion)
- Figure 12.11 Astellas Pharma: Annual Revenues, FY 2022 - Q1 FY 2025 (YEN Billion)
- Figure 12.12 Pharmaron: Annual Revenues, FY 2022 - H1 FY 2025 (RMB Billion)
- Figure 12.13 Takara Bio: Annual Revenues, FY 2023 - Q1 FY 2026 (YEN Billion)
- Figure 13.1 City of Hope: Type of Additional Service Offered
- Figure 13.2 Clinical Cell and Vaccine Production Facility (CVPF): Type of Additional Service Offered
- Figure 13.3 Fraunhofer Institute for Cell Therapy and Immunology: Type of Additional Service Offered
- Figure 13.4 Newcastle Advanced Therapies: Type of Additional Service Offered
- Figure 13.5 NHS Blood and Transplant: Type of Additional Service Offered
- Figure 13.6 Rayne Cell Therapy Suite (King's College London): Type of Additional Service Offered
- Figure 13.7 Scottish National Blood Transfusion Service (SNBTS) Cellular Therapy Facility: Type of Additional Service Offered
- Figure 15.1 Clinical Trial Analysis: Distribution by Trial Registration Year, Since 2021
- Figure 15.2 Clinical Trial Analysis: Distribution by Trial Registration Year and Enrolled Patient Population, Since 2021
- Figure 15.3 Clinical Trial Analysis: Distribution by Trial Status
- Figure 15.4 Clinical Trial Analysis: Distribution by Trial Registration Year and Trial Status
- Figure 15.5 Clinical Trial Analysis: Distribution by Trial Phase
- Figure 15.6 Clinical Trial Analysis: Distribution of Enrolled Patient Population by Trial Phase
- Figure 15.7 Clinical Trial Analysis: Distribution by Patient Gender
- Figure 15.8 Clinical Trial Analysis: Distribution by Type of Allocation
- Figure 15.9 Clinical Trial Analysis: Distribution by Type of Intervention Model
- Figure 15.10 Clinical Trial Analysis: Distribution by Type of Masking
- Figure 15.11 Clinical Trial Analysis: Distribution by Type of Sponsor / Collaborator
- Figure 15.12 Most Active Industry Players: Distribution by Number of Registered Trials
- Figure 15.13 Most Active Non-Industry Players: Distribution by Number of Registered Trials
- Figure 15.14 Clinical Trial Analysis: Distribution of Clinical Trials by Geography
- Figure 15.15 Clinical Trial Analysis: Distribution of Clinical Trials by Trial Status and Geography
- Figure 15.16 Clinical Trial Analysis: Distribution of Enrolled Patient Population by Trial Status and Geography
- Figure 16.1 Partnerships and Collaborations: Cumulative Year-wise Trend, Since 2021
- Figure 16.2 Partnerships and Collaborations: Distribution by Type of Partnership
- Figure 16.3 Partnerships and Collaborations: Distribution by Year and Type of Partnership
- Figure 16.4 Partnerships and Collaborations: Distribution by Type of Immune Cell
- Figure 16.5 Partnerships and Collaborations: Distribution by Scale of Operation
- Figure 16.6 Most Active Players: Distribution by Number of Partnerships
- Figure 16.7 Partnerships and Collaborations: Local and International Agreements
- Figure 16.8 Partnerships and Collaborations: Intracontinental and Intercontinental Agreements
- Figure 17.1 Recent Expansions: Cumulative Year-wise Trend, Since 2021
- Figure 17.2 Recent Expansions: Distribution by Type of Expansion
- Figure 17.3 Recent Expansions: Distribution by Year and Type of Expansion
- Figure 17.4 Recent Expansions: Distribution by Location of Expanded Facility (Region)
- Figure 17.5 Recent Expansions: Distribution by Location of Expanded Facility (Country)
- Figure 17.6 Recent Expansions: Distribution by Type of Expansion and Location of Headquarters (Country)
- Figure 17.7 Recent Expansions: Distribution by Type of Immune Cell
- Figure 17.8 Recent Expansions: Distribution by Type of Expansion and Type of Immune Cell
- Figure 17.9 Recent Expansions: Distribution by Scale of Operation
- Figure 17.10 Most Active Players: Distribution by Number of Expansions
- Figure 17.11 Most Active Players: Distribution by Area of Expansion (in sq ft)
- Figure 18.1 Big Pharma Initiatives: Distribution by Year of Initiative
- Figure 18.2 Big Pharma Initiatives: Distribution by Type of Initiative
- Figure 18.3 Big Pharma Initiatives: Distribution by Year and Type of Initiative
- Figure 18.4 Big Pharma Initiatives: Distribution of Big Pharma Players by Number of Initiatives
- Figure 18.5 Big Pharma Initiatives: Distribution by Type of Partnership
- Figure 18.6 Big Pharma Initiatives: Distribution of Big Pharma Players by Number of Partnerships
- Figure 18.7 Big Pharma Initiatives: Distribution by Type of Facility Expansion
- Figure 18.8 Big Pharma Initiatives: Distribution of Big Pharma Players by Number of Facility Expansion
- Figure 18.9 Big Pharma Initiatives: Distribution of Big Pharma Players by Region of Facility Expansion
- Figure 18.10 Big Pharma Initiatives: Distribution of Big Pharma Players by Number of Mergers and Acquisitions
- Figure 18.11 Big Pharma Initiatives: Distribution of Big Pharma Players by Number of Funding and Investment
- Figure 18.12 Big Pharma Initiatives: Distribution by Type of Immune Cell
- Figure 18.13 Big Pharma Initiatives: Distribution by Scale of Operation
- Figure 18.14 Big Pharma Initiatives: Distribution of Big Pharma Players by Scale of Operation
- Figure 18.15 Big Pharma Initiatives Summary
- Figure 19.1 Global Installed Capacity of Industry Players for Cell Therapy Manufacturing: Distribution by Range of Installed Capacity
- Figure 19.2 Global Installed Cell Therapy Manufacturing Capacity of Industry Players (Number of Cleanrooms): Distribution by Company Size
- Figure 19.3 Global Installed Cell Therapy Manufacturing Capacity of Industry Players (Number of Cleanrooms): Distribution by Scale of Operation
- Figure 19.4 Global Installed Cell Therapy Manufacturing Capacity of Industry Players (Number of Cleanrooms): Distribution by Location of Manufacturing Facility
- Figure 19.5 Global Installed Cell Therapy Manufacturing Capacity of Industry Players (Number of Cleanrooms): Distribution by Company Size and Location of Manufacturing Facility
- Figure 19.6 Global Installed Cell Therapy Manufacturing Capacity of Industry Players (Number of Cleanrooms): Distribution by Scale of Operation and Location of Manufacturing Facility
- Figure 19.7 Global Installed Capacity of Industry Players for Cell Therapy Manufacturing (Cleanroom Area, sq. ft.): Distribution by Company Size and Range of Installed Capacity
- Figure 19.8 Global Installed Cell Therapy Manufacturing Capacity of Industry Players (Cleanroom Area): Distribution by Company Size
- Figure 19.9 Global Installed Cell Therapy Manufacturing Capacity of Industry Players (Cleanroom Area): Distribution by Scale of Operation
- Figure 19.10 Global Installed Cell Therapy Manufacturing Capacity of Industry Players (Cleanroom Area): Distribution by Location of Manufacturing Facility
- Figure 19.11 Global Installed Cell Therapy Manufacturing Capacity of Industry Players (Cleanroom Area): Distribution by Company Size and Location of Manufacturing Facility
- Figure 19.12 Global Installed Cell Therapy Manufacturing Capacity of Industry Players (Cleanroom Area): Distribution by Scale of Operation and Location of Manufacturing Facility
- Figure 19.13 Global Installed Capacity of Non-Industry Players for Cell Therapy Manufacturing: Distribution by Range of Number of Cleanrooms
- Figure 19.14 Global Installed Cell Therapy Manufacturing Capacity of Non-Industry Players (Number of Cleanrooms): Distribution by Scale of Operation
- Figure 19.15 Global Installed Cell Therapy Manufacturing Capacity of Non-Industry Players (Number of Cleanrooms): Distribution by Location of Manufacturing Facility
- Figure 19.16 Global Installed Cell Therapy Manufacturing Capacity of Non-Industry Players (Cleanroom Area): Distribution by Range of Installed Capacity
- Figure 19.17 Global Installed Cell Therapy Manufacturing Capacity of Non-Industry Players (Cleanroom Area): Distribution by Scale of Operation
- Figure 19.18 Global Installed Cell Therapy Manufacturing Capacity of Non-Industry Players (Cleanroom Area): Distribution by Location of Manufacturing Facility
- Figure 20.1 Global Demand for Cell Therapy Manufacturing, Historical Trends (since 2023) and Forecasted Estimates (till 2035) (Number of Patients)
- Figure 20.2 Global Demand for Cell Therapy Manufacturing, Historical Trends (since 2023) and Forecasted Estimates (till 2035) (in terms of Number of Cells in Billion)
- Figure 20.3 Global Clinical Demand for Cell Therapy Manufacturing, Historical Trends (since 2023) and Forecasted Estimates (till 2035) (in terms of Number of Patients)
- Figure 20.4 Clinical Demand for Cell Therapy Manufacturing: Distribution by Type of Cell Therapy, Historical Trends (since 2023) and Forecasted Estimates (till 2035) (in terms of Number of Patients)
- Figure 20.5 Clinical Demand for Cell Therapy Manufacturing: Distribution by Geography, Historical Trends (since 2023) and Forecasted Estimates (till 2035) (in terms of Number of Patients)
- Figure 20.6 Global Commercial Demand for Cell Therapy Manufacturing, Historical Trends (since 2023) and Forecasted Estimates (till 2035) (in terms of Number of Patients)
- Figure 20.7 Commercial Demand for Cell Therapy Manufacturing: Distribution by Type of Cell Therapy, Historical Trends (since 2023) and Forecasted Estimates (till 2035) (in terms of Number of Patients)
- Figure 20.8 Commercial Demand for Cell Therapy Manufacturing: Distribution by Geography, Historical Trends (since 2023) and Forecasted Estimates (till 2035) (in terms of Number of Patients)
- Figure 21.1 Targeted Therapies: Pricing Model Based on Patient Segment
- Figure 22.1 Make versus Buy Decision Making Framework
- Figure 22.2 Make versus Buy Decision Making: Possible Scenario Descriptions
- Figure 23.1 Total Cost of Ownership: Capital Expenditures (CAPEX)
- Figure 23.2 Total Cost of Ownership: Operational Expenditures (OPEX)
- Figure 23.3 Total Cost of Ownership for Mid-sized Cell Therapy Manufacturing Organizations, Y0-Y20 (USD Million)
- Figure 23.4 Total Cost of Ownership for Mid-sized Cell Therapy Manufacturing Organizations: Distribution by CAPEX and OPEX, Y0 and Y20 (USD Million)
- Figure 23.5 Total Cost of Ownership for Mid-sized Cell Therapy Manufacturing Organizations, Y0: Distribution by CAPEX (USD Million)
- Figure 23.6 Total Cost of Ownership for Mid-sized Cell Therapy Manufacturing Organizations, Y1-Y20: Distribution by OPEX (USD Million)
- Figure 24.1 Cell Therapy Manufacturing: SWOT Analysis
- Figure 24.2 Comparison of SWOT Factors: Harvey Ball Analysis
- Figure 25.1 Survey Insights: Distribution of Respondents by Type of Organization
- Figure 25.2 Survey Insights: Distribution of Respondents by Location of Manufacturing Facility
- Figure 25.3 Survey Insights: Distribution by Designation and Seniority of Respondents
- Figure 25.4 Survey Insights: Distribution by Type of Cell Therapy
- Figure 25.5 Survey Insights: Distribution by Scale of Operation
- Figure 25.6 Survey Insights: Distribution by Source of Cells
- Figure 25.7 Survey Insights: Distribution by Cell Culture System
- Figure 26.1 Global Cell Therapy Manufacturing Market, Historical Trends (since 2023) and Forecasted Estimates (till 2035) (USD Million)
- Figure 26.2 Global Cell Therapy Manufacturing Market, Forecasted Estimates (till 2035), Conservative Scenario (USD Million)
- Figure 26.3 Global Cell Therapy Manufacturing Market, Forecasted Estimates (till 2035), Optimistic Scenario (USD Million)
- Figure 27.1 Cell Therapy Manufacturing Market: Distribution by Type of Cell Therapy
- Figure 27.2 Cell Therapy Manufacturing Market for CAR-T Cell Therapies, Historical Trends (since 2023) and Forecasted Estimates (till 2035) (USD Million)
- Figure 27.3 Cell Therapy Manufacturing Market for Stem Cell Therapies, Historical Trends (since 2023) and Forecasted Estimates (till 2035) (USD Million)
- Figure 27.4 Cell Therapy Manufacturing Market for TCR Cell Therapies, Historical Trends (since 2023) and Forecasted Estimates (till 2035) (USD Million)
- Figure 27.5 Cell Therapy Manufacturing Market for TIL Cell Therapies, Historical Trends (since 2023) and Forecasted Estimates (till 2035) (USD Million)
- Figure 27.6 Cell Therapy Manufacturing Market for Dendritic Cell Therapies, Historical Trends (since 2023) and Forecasted Estimates (till 2035) (USD Million)
- Figure 27.7 Cell Therapy Manufacturing Market for Other Cell Therapies, Historical Trends (since 2023) and Forecasted Estimates (till 2035) (USD Million)
- Figure 28.1 Cell Therapy Manufacturing Market: Distribution by Source of Cells
- Figure 28.2 Cell Therapy Manufacturing Market for Autologous Cells, Historical Trends (since 2023) and Forecasted Estimates (till 2035) (USD Million)
- Figure 28.3 Cell Therapy Manufacturing Market for Allogeneic Cells, Historical Trends (since 2023) and Forecasted Estimates (till 2035) (USD Million)
- Figure 28.4 Cell Therapy Manufacturing Market for Other Cells, Historical Trends (since 2023) and Forecasted Estimates (till 2035) (USD Million)
- Figure 29.1 Cell Therapy Manufacturing Market: Distribution by Scale of Operation
- Figure 29.2 Cell Therapy Manufacturing Market for Clinical Scale, Historical Trends (since 2023) and Forecasted Estimates (till 2035) (USD Million)
- Figure 29.3 Cell Therapy Manufacturing Market for Commercial Scale, Historical Trends (since 2023) and Forecasted Estimates (till 2035) (USD Million)
- Figure 30.1 Cell Therapy Manufacturing Market: Distribution by Type of Manufacturer
- Figure 30.2 Cell Therapy Manufacturing Market for Contract Manufacturing Organizations, Historical Trends (since 2023) and Forecasted Estimates (till 2035) (USD Million)
- Figure 30.3 Cell Therapy Manufacturing Market for In-House Manufacturers, Historical Trends (since 2023) and Forecasted Estimates (till 2035) (USD Million)
- Figure 31.1 Cell Therapy Manufacturing Market: Distribution by Geography
- Figure 31.2 Clinical Cell Therapy Manufacturing Market in North America, Historical Trends (since 2023) and Forecasted Estimates (till 2035) (USD Million)
- Figure 31.3 Clinical Cell Therapy Manufacturing Market in the US, Historical Trends (since 2023) and Forecasted Estimates (till 2035) (USD Million)
- Figure 31.4 Clinical Cell Therapy Manufacturing Market in Canada, Historical Trends (since 2023) and Forecasted Estimates (till 2035) (USD Million)
- Figure 31.5 Clinical Cell Therapy Manufacturing Market in Europe, Historical Trends (since 2023) and Forecasted Estimates (till 2035) (USD Million)
- Figure 31.6 Clinical Cell Therapy Manufacturing Market in Spain, Historical Trends (since 2023) and Forecasted Estimates (till 2035) (USD Million)
- Figure 31.7 Clinical Cell Therapy Manufacturing Market in France, Historical Trends (since 2023) and Forecasted Estimates (till 2035) (USD Million)
- Figure 31.8 Clinical Cell Therapy Manufacturing Market in Germany, Historical Trends (since 2023) and Forecasted Estimates (till 2035) (USD Million)
- Figure 31.9 Clinical Cell Therapy Manufacturing Market in the UK, Historical Trends (since 2023) and Forecasted Estimates (till 2035) (USD Million)
- Figure 31.10 Clinical Cell Therapy Manufacturing Market in Italy, Historical Trends (since 2023) and Forecasted Estimates (till 2035) (USD Million)
- Figure 31.11 Clinical Cell Therapy Manufacturing Market in Asia-Pacific and Rest of the World, Historical Trends (since 2023) and Forecasted Estimates (till 2035) (USD Million)
- Figure 31.12 Clinical Cell Therapy Manufacturing Market in China, Historical Trends (since 2023) and Forecasted Estimates (till 2035) (USD Million)
- Figure 31.13 Clinical Cell Therapy Manufacturing Market in Singapore, Historical Trends (since 2023) and Forecasted Estimates (till 2035) (USD Million)
- Figure 31.14 Clinical Cell Therapy Manufacturing Market in South Korea, Historical Trends (since 2023) and Forecasted Estimates (till 2035) (USD Million)
- Figure 31.15 Clinical Cell Therapy Manufacturing Market in Israel, Historical Trends (since 2023) and Forecasted Estimates (till 2035) (USD Million)
- Figure 31.16 Clinical Cell Therapy Manufacturing Market in Japan, Historical Trends (since 2023) and Forecasted Estimates (till 2035) (USD Million)
- Figure 31.17 Clinical Cell Therapy Manufacturing Market in Taiwan, Historical Trends (since 2023) and Forecasted Estimates (till 2035) (USD Million)
- Figure 31.18 Clinical Cell Therapy Manufacturing Market in Brazil, Historical Trends (since 2023) and Forecasted Estimates (till 2035) (USD Million)
- Figure 31.19 Clinical Cell Therapy Manufacturing Market in Argentina, Historical Trends (since 2023) and Forecasted Estimates (till 2035) (USD Million)
- Figure 31.20 Clinical Cell Therapy Manufacturing Market in South Africa, Historical Trends (since 2023) and Forecasted Estimates (till 2035) (USD Million)
- Figure 31.21 Commercial Cell Therapy Manufacturing Market in North America, Historical Trends (since 2023) and Forecasted Estimates (till 2035) (USD Million)
- Figure 31.22 Commercial Cell Therapy Manufacturing Market in the US, Historical Trends (since 2023) and Forecasted Estimates (till 2035) (USD Million)
- Figure 31.23 Commercial Cell Therapy Manufacturing Market in Canada, Historical Trends (since 2023) and Forecasted Estimates (till 2035) (USD Million)
- Figure 31.24 Commercial Cell Therapy Manufacturing Market in Europe, Historical Trends (since 2023) and Forecasted Estimates (till 2035) (USD Million)
- Figure 31.25 Commercial Cell Therapy Manufacturing Market in Germany, Historical Trends (since 2023) and Forecasted Estimates (till 2035) (USD Million)
- Figure 31.26 Commercial Cell Therapy Manufacturing Market in France, Historical Trends (since 2023) and Forecasted Estimates (till 2035) (USD Million)
- Figure 31.27 Commercial Cell Therapy Manufacturing Market in the UK, Historical Trends (since 2023) and Forecasted Estimates (till 2035) (USD Million)
- Figure 31.28 Commercial Cell Therapy Manufacturing Market in Italy, Historical Trends (since 2023) and Forecasted Estimates (till 2035) (USD Million)
- Figure 31.29 Commercial Cell Therapy Manufacturing Market in Spain, Historical Trends (since 2023) and Forecasted Estimates (till 2035) (USD Million)
- Figure 31.30 Commercial Cell Therapy Manufacturing Market in Rest of Europe, Historical Trends (since 2023) and Forecasted Estimates (till 2035) (USD Million)
- Figure 31.31 Commercial Cell Therapy Manufacturing Market in Asia-Pacific and Rest of the World, Historical Trends (since 2023) and Forecasted Estimates (till 2035) (USD Million)
- Figure 31.32 Commercial Cell Therapy Manufacturing Market in China, Historical Trends (since 2023) and Forecasted Estimates (till 2035) (USD Million)
- Figure 31.33 Commercial Cell Therapy Manufacturing Market in Japan, Historical Trends (since 2023) and Forecasted Estimates (till 2035) (USD Million)
- Figure 31.34 Commercial Cell Therapy Manufacturing Market in Australia, Historical Trends (since 2023) and Forecasted Estimates (till 2035) (USD Million)
- Figure 31.35 Commercial Cell Therapy Manufacturing Market in India, Historical Trends (since 2023) and Forecasted Estimates (till 2035) (USD Million)
- Figure 31.36 Commercial Cell Therapy Manufacturing Market in South Korea, Historical Trends (since 2023) and Forecasted Estimates (till 2035) (USD Million)
- Figure 31.37 Commercial Cell Therapy Manufacturing Market in Brazil, Historical Trends (since 2024) and Forecasted Estimates (till 2035) (USD Million)
- Figure 35.1 Conclusion: Market Landscape (Industry Players)
- Figure 35.2 Conclusion: Market Landscape (Non-Industry Players)
- Figure 35.3 Conclusion: Clinical Trial Analysis
- Figure 35.4 Conclusion: Partnerships and Collaborations
- Figure 35.5 Conclusion: Recent Expansions
- Figure 35.6 Conclusion: Big Pharma Initiatives
- Figure 35.7 Conclusion: Capacity Analysis
- Figure 35.8 Conclusion: Demand Analysis
- Figure 35.9 Conclusion: Total Cost of Ownership
- Figure 35.10 Conclusion: Market Sizing and Opportunity Analysis


