


 |
市場調查報告書
商品編碼
1891252
下一代定序試劑盒市場:產業趨勢及全球預測(至 2035 年)-按核苷酸類型、最終使用者類型和主要地區劃分NGS Kits Market: Industry Trends and Global Forecasts, Till 2035 - Distribution by Type of Nucleotide Sequenced, Type of End User and Key Geographical Regions |
||||||
次世代定序 (NGS) 試劑盒市場概述
次世代定序 (NGS) 試劑盒市場今年的市場規模預計為 11 億美元,預計到 2035 年將成長至 115 億美元。
NGS 試劑盒市場概述
市場規模和機會分析基於以下參數進行細分:
核苷酸類型 定序標靶
- DNA
- RNA
最終使用者
- 學術和研究機構
- 製藥和生技公司
- 醫院和診所
- 其他
主要地區
- 北美
- 歐洲
- 亞太地區
- 拉丁美洲
- 中東和北非
- 世界其他地區
次世代定序試劑盒市場 - 成長與趨勢
自從弗雷德里克·桑格於1977年引入基因測序技術以來,基因組數據收集和分析領域取得了顯著進展。 DNA定序方法的改進推動了包括精準醫療和診斷在內的各個醫學研究領域的重大進步。次世代定序(NGS)技術和NGS檢測試劑盒(可進行全基因組和全外顯子定序)的影響特別顯著。這種先進且快速的基因組定序方法顯著降低了成本並縮短了周轉時間。與耗資約 30 億美元的人類基因組計畫相比,目前的技術已顯著降低了個人基因組定序的成本(1,000 美元)。
隨著 NGS 檢測和下一代定序試劑盒市場的持續發展,業內人士預計未來十年內,這一成本將降至 100 美元。值得注意的是,基因組定序成本的降低正推動著全球基因組定序數量的成長。
儘管基因組學領域近年來取得了顯著進展,但核苷酸文庫的建構過程仍面臨許多挑戰。這些挑戰包括需要大量的起始樣本、產量低以及對產品品質的擔憂。此外,手動建立 DNA 和 RNA 文庫的過程耗時費力,需要大量的操作步驟,並且需要昂貴的試劑。因此,製藥業的創新者們正在不斷探索和開發改進 DNA 和 RNA 文庫建構過程的方法。 在眾多替代方案中,新一代定序(NGS)文庫製備試劑盒已成為許多藥物研發公司和學術/研究機構克服傳統DNA和RNA文庫製備方法現有挑戰的可行選擇。這些試劑盒只需少量起始材料,即可產生準確且誤差極小的DNA編碼文庫和RNA文庫。目前,市面上已有超過280種NGS文庫製備試劑盒,相容於多種定序平台,包括Illumina®、Ion Torrent®和華大基因(BGI)NGS平台。值得注意的是,在過去幾年中,與NGS文庫製備試劑盒相關的專利申請和授權數量已超過3,200項,顯示NGS試劑盒市場正持續進行技術創新。在基因治療需求不斷增長以及新型先進NGS技術廣泛應用的推動下,預計NGS文庫製備試劑盒市場在預測期內將保持穩定成長。
NGS試劑盒市場 - 主要發現
本報告深入分析了NGS試劑盒市場的現狀,並指出了該行業的潛在成長機會。主要發現包括:
- 目前,約有60家製造商提供超過280種NGS文庫製備試劑盒,支援多種輸入樣本,包括純化的RNA/DNA和細胞。
- 各利害關係人利用其專業知識,提供各種用於DNA和RNA文庫製備的NGS試劑盒。其中大多數試劑盒相容於小於5 ng的輸入樣本。
- 當前市場格局較為分散,既有新進者,也有老牌企業,而美國被認為是NGS文庫製備試劑盒的創新中心。
- 為了獲得競爭優勢,NGS文庫製備試劑盒供應商目前專注於擴展現有能力並拓寬產品組合。
- 近期已提交或核准超過3250項與NGS文庫製備試劑盒相關的專利,顯示該領域的創新步伐正在加快。
- 大約有70家業內企業聲稱提供基於NGS的成熟服務組合,這些服務利用了第二代和第三代定序技術。
- 預計到2035年,該市場將以顯著的複合年增長率增長,預計市場機會將多元化,涵蓋不同類型的核酸序列、終端用戶和主要地理區域。
NGS試劑盒市場 - 主要細分市場
預計DNA細分市場將佔NGS試劑盒市場的大部分佔有率。
依核酸類型劃分,市場分為DNA和RNA兩大類。今年,DNA細分市場佔了大部分市場佔有率(約70%)。然而,預計RNA細分市場在預測期內將以更高的複合年增長率(5.1%)成長。
預計到 2035 年,醫院和診所將佔 NGS 試劑盒市場最大的佔有率。
依最終用戶劃分,市場可分為醫院和診所、製藥和生技公司、學術研究機構等機構。預計到 2035 年,醫院和診所將佔約 45% 的市場佔有率,其次是製藥和生物技術公司,市佔率約為 30%。
預計北美將推動下一代定序試劑盒市場的成長。
依地理區域劃分,市場可分為北美、歐洲、亞太地區、中東和北非 (MENA)、拉丁美洲以及世界其他地區。 預計到 2035 年,北美將佔最大的市場佔有率,約 40%。
NGS 試劑盒市場代表性公司
- 安捷倫科技
- BioDynami
- Creative Biogene
- New England Biolabs
- PerkinElmer
- 賽默飛世爾科技
- Abcam
- Devyser
- Diagenode
- Lexogen
- 羅氏
- Tecan
- Enzynomics
- MGI
- Takara Bio
- 天根生物
- TransGen Biotech
- Vazym
NGS 試劑盒市場 - 研究範圍
- 市場規模和機會分析:本報告對下一代定序試劑盒進行了詳細分析。 市場分析,重點在於以下關鍵細分市場:[A] 定序目標核苷酸類型,[B] 終端用戶類型,[C] 和 [E] 主要地區。
- 市場概況:基於多個相關參數,對次世代定序市場的整體競爭格局進行詳細評估,例如:[A] 待定序核苷酸類型,[B] 試劑盒組成,[C] 所需樣本量,[D] 週轉時間,[E] 儲存溫度,[F] 所用樣本類型,[G] 試劑盒有效定序
- 公司競爭分析:對 NGS 文庫製備試劑盒進行全面分析,考慮的因素包括:[A] 供應商實力和 [B] 產品競爭力。
- 公司簡介:基於多個參數,對北美、歐洲和亞太地區的 NGS 文庫製備試劑盒供應商進行詳細介紹,例如:[A] 成立年份,[B] 總部所在地,[C] 專有技術平台,[D] 近期發展,以及 [E] 未來展望。
- 專利分析:一份詳細的專利分析報告,從研發角度概述了該行業的演變,內容包括:[A] 專利公開年份,[B] 地理區域,[C] CPC分類,[D] 專利重點領域,[E] 申請人類型,以及 [F] 主要行業參與者。
目錄
第一章:前言
第二章:摘要整理
第三章:導論
- 章節概述
- 基因組定序概述
- 基因組定序類型
- 未來展望
第四章:市場概況
- 章節概述
- 次世代定序試劑盒:市場概況
- 次世代定序試劑盒:供應商列表
第五章:產品競爭分析
第六章:公司簡介:北美下一代定序試劑盒供應商
- 章節概述
- 安捷倫科技
- BioDynami
- Creative Biogene
- New England Biolabs
- PerkinElmer
- 賽默飛世爾科技
第七章:公司簡介:歐洲新一代定序試劑盒供應商
- 章節概述
- Abcam
- Devyser
- Diagenode
- Lexogen
- 羅氏
- Tecan
第八章:公司簡介:亞太地區新一代定序試劑盒供應商
- 章節概述
- 酵素組學
- MGI
- 寶生物
- 天根生物
- 全式金生物
- Vazyme
第九章:專利分析
第十章:市場預測與機會分析
- 章節概述
- 預測研究方法及關鍵假設
- 2035年全球下一代定序試劑盒市場展望
第十一章:案例研究:下一代定序技術及服務提供者
- 章節概述
- 基因組定序的歷史發展
- 次世代定序技術
- 次世代定序服務服務供應商
- 次世代定序服務提供者:產業外的服務提供者
第十二章 結論
第十三章:高階主管見解
第十四章:附錄 1:表格資料
第十五章:附錄 2:公司與組織清單
NGS Kits Market: Overview
As per Roots Analysis, the NGS kits market is estimated to grow from USD 1.1 billion in the current year and is anticipated to grow to USD 11.5 billion during the forecast period, till 2035.
NGS Kits Market: Overview
The market sizing and opportunity analysis has been segmented across the following parameters:
Type of Nucleotide Sequenced
- DNA
- RNA
End-user
- Academics and Research Institutes
- Pharmaceutical and Biotechnology Companies
- Hospitals and Clinics
- Other End-users
Key Geographies
- North America
- Europe
- Asia-Pacific
- Latin America
- Middle East and North Africa
- Rest of the World
NGS Kits market: Growth and Trends
The field of genomic data gathering and analysis has progressed notably since Frederick Sanger introduced a gene sequencing technique in 1977. Improvements in DNA sequencing methods have resulted in notable progress across various healthcare-related research areas, including precision medicine and diagnostics. Specifically, the effect of next generation sequencing (NGS) techniques and NGS testing kits, which facilitate whole genome and whole exome sequencing, has been the most significant. This advanced, rapid genome sequencing method has significantly lowered both the expenses and time required. In comparison to the Human Genome Project (~USD 3 billion), the expense of sequencing an individual genome has significantly dropped (to USD 1,000) with present technologies.
Due to the continuous advancements in NGS testing kits and next generation sequencing kits market, stakeholders also expect that, in the coming decade, the previously mentioned cost might drop to USD 100. It is important to note that this reduction in genome sequencing expenses has resulted in a rise in the number of genomes sequenced worldwide.
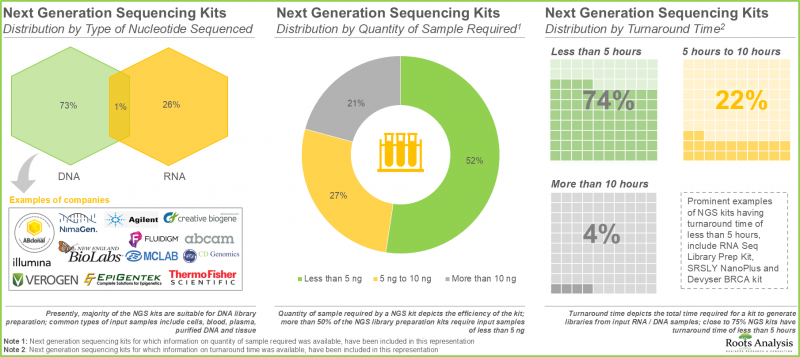
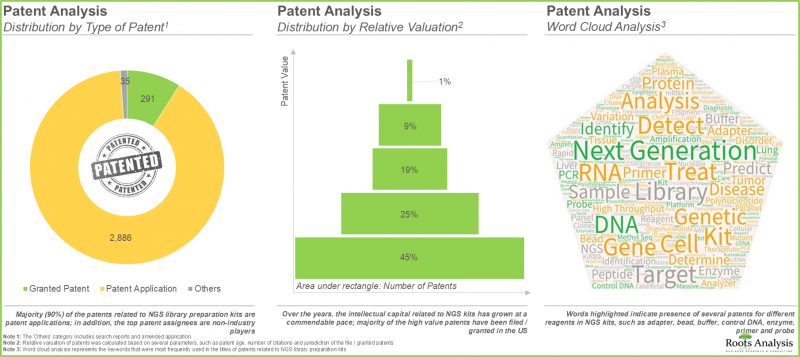
Despite the recent advances in the field of genomics, the nucleotide library preparation process still faces several challenges, including requirement of large amounts of input samples, low volume of yield and concerns related to quality of the product. In addition, the manual DNA library / RNA library preparation process is time consuming, requiring extensive manipulation and expensive reagents. Therefore, innovators in the pharmaceutical industry are constantly identifying / developing ways to improve the process of DNA library / RNA library preparation. Amidst other alternatives, the use of NGS library preparation kits has emerged as a viable option for various drug developers and academic / research institutes to overcome the existing challenges associated with conventional DNA library / RNA library preparation methods. These kits require less input material and are capable of generating precise DNA encoded library / RNA libraries with minimum errors. Presently, more than 280 NGS library preparation kits are available in the market; these are compatible with a broad range of sequencing platforms, including Illumina(R), Ion Torrent(R) and BGI NGS platforms. It is worth mentioning that over 3,200 patents related to NGS library preparation kits have been filed / granted in the past few years, demonstrating the continued innovation in NGS kits market. Driven by the increasing demand for gene therapies and the introduction of novel and advanced NGS techniques, the NGS library preparation kits market is anticipated to witness steady market growth during the forecast period.
NGS Kits Market: Key Insights
The report delves into the current state of the NGS kits market and identifies potential growth opportunities within industry. Some key findings from the report include:
- Presently, more than 280 NGS library preparation kits are being offered by close to 60 players; these kits are compatible with a variety of input samples, including purified RNA / DNA and cells.
- Leveraging their expertise, stakeholders are offering a myriad of NGS kits for preparing DNA and RNA libraries; majority of these kits require less than 5 ng of input samples
- The current market landscape is fragmented, featuring both new entrants and established players; the US is currently considered to be a hub of innovation for NGS library preparation kits.
- In pursuit of gaining a competitive edge, NGS library preparation kit providers are presently focusing on expansion of their existing capabilities and augmenting their respective product portfolios.
- Over 3,250 patents related to NGS library preparation kits have recently been filed / granted, indicating the heightened pace of innovation in this domain.
- Around 70 industry players claim to offer elaborate portfolios of NGS based services, leveraging a variety of second and third generation sequencing technologies.
- The market is anticipated to grow at a notable CAGR till 2035; the projected opportunity is likely to be distributed across different type of nucleotide sequenced, end user and key geographical regions.
NGS Kits Market: Key Segments
DNA Segment is Likely to Capture Majority of the NGS Kits Market Share
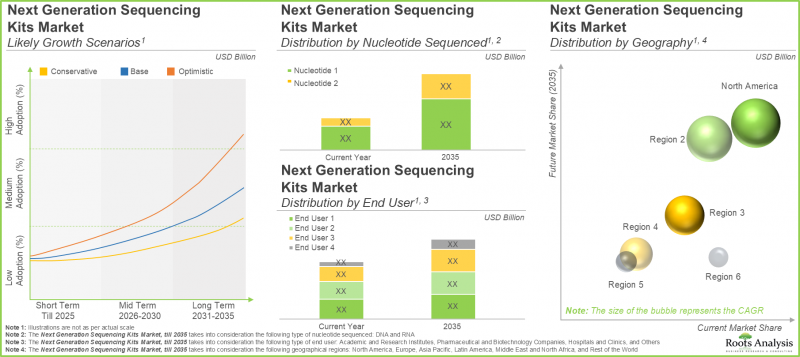
In terms of type of nucleotide sequenced, the market is segmented across DNA and RNA. In the current year, the DNA segment captures most of the market share (~ 70%). However, the RNA segment will grow at a higher CAGR of 5.1% during the forecast period.
Hospitals and Clinics are Likely to Capture the Highest NGS Kits Market Share in 2035
In terms of end-users, the market is segmented across hospitals and clinics, pharmaceutical and biotechnology companies, academic and research institutes and others. Around 45% of the market share will be captured by hospitals and clinics by 2035, followed by pharmaceutical and biotechnology companies capturing 30% of the market share.
North America is Likely to Propel the Growth of NGS Kits Market
In terms of geographical regions, the market is segmented across North America, Europe, Asia Pacific, MENA, Latin America, and rest of the world. Notably, North America will capture the maximum market share of around 40% by 2035.
Example Players in NGS Kits Market
- Agilent Technologies
- BioDynami
- Creative Biogene
- New England Biolabs
- PerkinElmer
- Thermo Fisher Scientific
- Abcam
- Devyser
- Diagenode
- Lexogen
- Roche
- Tecan
- Enzynomics
- MGI
- Takara Bio
- TIANGEN Biotech
- TransGen Biotech
- Vazym
NGS Kits Market: Research Coverage
- Market Sizing and Opportunity Analysis: The report features an in-depth analysis of the next generation sequencing kits market, focusing on key market segments, including [A] type of nucleotide sequenced, [B] type of end user, [C] and [E] key geographical regions.
- Market Landscape: A detailed assessment of overall competitive landscape next generation sequencing based on several relevant parameters, such as [A] type of nucleotide sequenced, [B] kit components, [C] quantity of sample required, [D] turnaround time, [E] storage temperature, [F] type of sample used, [G] kit shelf life, [H] type of sequencing and [I] type of sequencing platform used.
- Company Competitiveness Analysis: A comprehensive NGS library preparation kits examining factors, such as [A] supplier power and [B] product competitiveness.
- Company Profiles: In-depth profiles of NGS library preparation kits providers in North America, Europe and Asia-Pacific, based on several parameters such as [A] year of establishment, [B] location of headquarters, [C] proprietary technology platforms, [D] recent developments and [E] an informed future outlook.
- Patent Analysis: An in-depth patent analysis to provide an overview of how the industry is evolving from the R&D perspective such as [A] publication year, [B] geographical region, [C] CPC symbols, [D] patent focus areas, [E] type of applicant and [F] leading industry players.
Key Questions Answered in this Report
- How many companies are currently engaged in this market?
- Which are the leading companies in this market?
- What is the current global capacity of developers?
- What factors are likely to influence the evolution of this market?
- What is the current and future market size?
- What is the CAGR of this market?
- How is the current and future market opportunity likely to be distributed across key market segments?
Reasons to Buy this Report
- The report provides a comprehensive market analysis, offering detailed revenue projections of the overall market and its specific sub-segments. This information is valuable to both established market leaders and emerging entrants.
- Stakeholders can leverage the report to gain a deeper understanding of the competitive dynamics within the market. By analyzing the competitive landscape, businesses can make informed decisions to optimize their market positioning and develop effective go-to-market strategies.
- The report offers stakeholders a comprehensive overview of the market, including key drivers, barriers, opportunities, and challenges. This information empowers stakeholders to stay abreast of market trends and make data-driven decisions to capitalize on growth prospects.
Additional Benefits
- Complimentary PPT Insights Packs
- Complimentary Excel Data Packs for all Analytical Modules in the Report
- 15% Free Content Customization
- Detailed Report Walkthrough Session with Research Team
- Free Updated report if the report is 6-12 months old or older
TABLE OF CONTENTS
1. PREFACE
- 1.1. Scope of the Report
- 1.2. Research Methodology
- 1.3. Key Questions Answered
- 1.4. Chapter Outlines
2. EXECUTIVE SUMMARY
3. INTRODUCTION
- 3.1. Chapter Overview
- 3.2. Overview of Genome Sequencing
- 3.3. Types of Genome Sequencing
- 3.3.1. Next Generation Sequencing
- 3.3.1.1. Applications of Next Generation Sequencing
- 3.3.1.1.1. Cancer and Affiliated Biomarker Research
- 3.3.1.1.2. Diagnostics
- 3.3.1.1.3. Personalized / Precision Medicine
- 3.3.1.1.4. Forensics
- 3.3.1.2. Steps Involved in Next Generation Sequencing
- 3.3.1.2.1. Library Preparation
- 3.3.1.2.2. Amplification
- 3.3.1.2.3. Sequencing
- 3.3.1.2.4. Bioinformatics Analysis and Data Interpretation
- 3.3.1.3. Components of Next Generation Sequencing Kits
- 3.3.1.1. Applications of Next Generation Sequencing
- 3.3.1. Next Generation Sequencing
- 3.4. Future Perspectives
4. MARKET LANDSCAPE
- 4.1. Chapter Overview
- 4.2. Next Generation Sequencing Kits: Overall Market Landscape
- 4.2.1. Analysis by Type of Nucleotide Sequenced
- 4.2.2. Analysis by Kit Components
- 4.2.3. Analysis by Quantity of Sample Required
- 4.2.4. Analysis by Turnaround Time
- 4.2.5. Analysis by Storage Temperature
- 4.2.6. Analysis by Type of Sample Used
- 4.2.7. Analysis by Kit Shelf Life
- 4.2.8. Analysis by Type of Sequencing
- 4.2.9. Analysis by Type of Sequencing Platform Used
- 4.3. Next Generation Sequencing Kits: List of Providers
- 4.3.1. Analysis by Year of Establishment
- 4.3.2. Analysis by Company Size
- 4.3.3. Analysis by Location of Headquarters
- 4.3.4. Leading Players: Analysis by Number of Products
5. PRODUCT COMPETITIVENESS ANALYSIS
- 5.1. Chapter Overview
- 5.2. Assumptions and Methodology
- 5.3. Product Competitiveness Analysis: Competitive Landscape
6. COMPANY PROFILES: NEXT GENERATION SEQUENCING KITS PROVIDERS IN NORTH AMERICA
- 6.1. Chapter Overview
- 6.2. Agilent Technologies
- 6.2.1. Company Overview
- 6.2.2. Financial Information
- 6.2.3. NGS Kit Portfolio
- 6.2.4. Recent Developments and Future Outlook
- 6.3. BioDynami
- 6.3.1. Company Overview
- 6.3.2. NGS Kit Portfolio
- 6.3.3. Recent Developments and Future Outlook
- 6.4. Creative Biogene
- 6.4.1. Company Overview
- 6.4.2. NGS Kit Portfolio
- 6.4.3. Recent Developments and Future Outlook
- 6.5. New England Biolabs
- 6.5.1. Company Overview
- 6.5.2. NGS Kit Portfolio
- 6.5.3. Recent Developments and Future Outlook
- 6.6. PerkinElmer
- 6.6.1. Company Overview
- 6.6.2. Financial Information
- 6.6.3. NGS Kit Portfolio
- 6.6.4. Recent Developments and Future Outlook
- 6.7. Thermo Fisher Scientific
- 6.7.1. Company Overview
- 6.7.2. Financial Information
- 6.7.3. NGS Kit Portfolio
- 6.7.4. Recent Developments and Future Outlook
7. COMPANY PROFILES: NEXT GENERATION SEQUENCING KITS PROVIDERS IN EUROPE
- 7.1. Chapter Overview
- 7.2. Abcam
- 7.2.1 Company Overview
- 7.2.2. Financial Information
- 7.2.3. NGS Kit Portfolio
- 7.2.4. Recent Developments and Future Outlook
- 7.3. Devyser
- 7.3.1 Company Overview
- 7.3.2. NGS Kit Portfolio
- 7.3.3. Recent Developments and Future Outlook
- 7.4. Diagenode
- 7.4.1 Company Overview
- 7.4.2. NGS Kit Portfolio
- 7.4.3. Recent Developments and Future Outlook
- 7.5. Lexogen
- 7.5.1 Company Overview
- 7.5.2. NGS Kit Portfolio
- 7.5.3. Recent Developments and Future Outlook
- 7.6. Roche
- 7.6.1 Company Overview
- 7.6.2. Financial Information
- 7.6.3. NGS Kit Portfolio
- 7.6.4. Recent Developments and Future Outlook
- 7.7. Tecan
- 7.7.1 Company Overview
- 7.7.2. Financial Information
- 7.7.3. NGS Kit Portfolio
- 7.7.4. Recent Developments and Future Outlook
8. COMPANY PROFILES: NEXT GENERATION SEQUENCING KITS PROVIDERS IN ASIA PACIFIC
- 8.1. Chapter Overview
- 8.2. Enzynomics
- 8.2.1. Company Overview
- 8.2.2. NGS Kit Portfolio
- 8.2.3. Recent Developments and Future Outlook
- 8.3. MGI
- 8.3.1. Company Overview
- 8.3.2. NGS Kit Portfolio
- 8.3.3. Recent Developments and Future Outlook
- 8.4. Takara Bio
- 8.4.1. Company Overview
- 8.4.2. Financial Information
- 8.4.3. NGS Kit Portfolio
- 8.4.4. Recent Developments and Future Outlook
- 8.5. TIANGEN Biotech
- 8.5.1. Company Overview
- 8.5.2. NGS Kit Portfolio
- 8.5.3. Recent Developments and Future Outlook
- 8.6. TransGen Biotech
- 8.6.1. Company Overview
- 8.6.2. NGS Kit Portfolio
- 8.6.3. Recent Developments and Future Outlook
- 8.7. Vazyme
- 8.7.1. Company Overview
- 8.7.2. NGS Kit Portfolio
- 8.7.3. Recent Developments and Future Outlook
9. PATENT ANALYSIS
- 9.1. Chapter Overview
- 9.2. Scope and Methodology
- 9.3. Next Generation Sequencing Kits: Patent Analysis
- 9.3.1 Analysis by Publication Year
- 9.3.2. Analysis by Geography
- 9.3.3. Analysis by CPC Symbols
- 9.3.4. Emerging Focus Areas
- 9.3.5. Analysis by Type of Applicant
- 9.3.6. Leading Players: Analysis by Number of Patents
- 9.4. Next Generation Sequencing Kits: Patent Benchmarking
- 9.4.1. Analysis by Patent Characteristics
- 9.5. Next Generation Sequencing Kits: Patent Valuation
- 9.6. Leading Patents: Analysis by Number of Citations
10. MARKET FORECAST AND OPPORTUNITY ANALYSIS
- 10.1. Chapter Overview
- 10.2. Forecast Methodology and Key Assumptions
- 10.3. Global Next Generation Sequencing Kits Market, Till 2035
- 10.3.1. Next Generation Sequencing Kits Market, 2021 and 2035: Distribution by Type of Nucleotide Sequenced
- 10.3.1.1. Next Generation Sequencing Kits Market for DNA, Till 2035
- 10.3.1.2. Next Generation Sequencing Market for RNA, Till 2035
- 10.3.2. Next Generation Sequencing Kits Market, 2021 and 2035: Distribution by Type of End User
- 10.3.2.1. Next Generation Sequencing Kits Market for Academic and Research Institutes, Till 2035
- 10.3.2.2. Next Generation Sequencing Kits Market for Pharmaceutical and Biotechnology Companies, Till 2035
- 10.3.2.3. Next Generation Sequencing Kits Market for Hospitals and Clinics, Till 2035
- 10.3.2.4. Next Generation Sequencing Kits Market for Others, Till 2035
- 10.3.3. Next Generation Sequencing Kits Market, 2021 and 2035: Distribution by Geography
- 10.3.3.1. Next Generation Sequencing Kits Market in North America, Till 2035
- 10.3.3.2. Next Generation Sequencing Kits Market in Europe, Till 2035
- 10.3.3.3. Next Generation Sequencing Kits Market in Asia Pacific, Till 2035
- 10.3.3.4. Next Generation Sequencing Kits Market in Middle East and North Africa, Till 2035
- 10.3.3.5. Next Generation Sequencing Kits Market in Latin America, Till 2035
- 10.3.3.6. Next Generation Sequencing Kits Market in Rest of the World, Till 2035
- 10.3.1. Next Generation Sequencing Kits Market, 2021 and 2035: Distribution by Type of Nucleotide Sequenced
11. CASE STUDY: NEXT GENERATION SEQUENCING TECHNOLOGIES AND SERVICE PROVIDERS
- 11.1. Chapter Overview
- 11.2. Historical Evolution of Genome Sequencing
- 11.2.1. First Generation DNA Sequencers
- 11.2.2. Second Generation HT-NGS Platforms
- 11.2.3. Third Generation HT-NGS Platforms
- 11.2.3.1. Heliscope Single Molecule Sequencer
- 11.2.3.2. Single Molecule Real Time Sequencer
- 11.2.3.3. Single Molecule Real Time (RNAP) Sequencer
- 11.2.3.4. Nanopore DNA Sequencer
- 11.2.3.5. Multiplex Polony Technology
- 11.2.3.6. The Ion Torrent Sequencing Technology
- 11.2.4. Comparison of First, Second and Third Generation technologies
- 11.3. Next Generation Sequencing Technologies
- 11.3.1. Analysis by Type of Application
- 11.4. Next Generation Sequencing Service Providers
- 11.4.1. Next Generation Sequencing Service Providers: Industry Players
- 11.4.2. Analysis by Year of Establishment
- 11.4.3. Analysis by Company Size
- 11.4.4. Analysis by Location of Headquarters
- 11.4.5. Analysis by Type of Service Offered
- 11.5. Next Generation Sequencing Service Providers: Non-Industry Players
- 11.5.1. Analysis by Year of Establishment
- 11.5.2. Analysis by Location of Headquarters
- 11.5.3. Analysis by Type of Service Offered
12. CONCLUDING REMARKS
13. EXECUTIVE INSIGHTS
- 13.1. Chapter Overview
- 13.2. Company A
- 13.2.1. Company Snapshot
- 13.2.2. Interview Transcript: General Manager, Very Large Company, Switzerland
14. APPENDIX 1: TABULATED DATA
15. APPENDIX 2: LIST OF COMPANIES AND ORGANIZATIONS
List of Tables
- Table 4.1 Next Generation Sequencing Kits: List of Products
- Table 4.2 Next Generation Sequencing Kits: Information on Type of Sample Used, Kit Shelf Life, Type of Sequencing and Type of Sequencing Platform Used
- Table 4.3 Next Generation Sequencing Kits: List of Providers
- Table 6.1 Leading NGS Kit Providers in North America
- Table 6.2 Agilent Technologies: Company Snapshot
- Table 6.3 Agilent Technologies: NGS Kit Portfolio
- Table 6.4 Agilent Technologies: Recent Developments and Future Outlook
- Table 6.5 BioDynami: Company Snapshot
- Table 6.6 BioDynami: NGS Kit Portfolio
- Table 6.7 BioDynami: Recent Developments and Future Outlook
- Table 6.8 Creative Biogene: Company Snapshot
- Table 6.9 Creative Biogene: NGS Kit Portfolio
- Table 6.10 Creative Biogene: Recent Developments and Future Outlook
- Table 6.11 New England Biolabs: Company Snapshot
- Table 6.12 New England Biolabs: NGS Kit Portfolio
- Table 6.13 New England Biolabs: Recent Developments and Future Outlook
- Table 6.14 PerkinElmer: Company Snapshot
- Table 6.15 PerkinElmer: NGS Kit Portfolio
- Table 6.16 PerkinElmer: Recent Developments and Future Outlook
- Table 6.17 Thermo Fisher Scientific: Company Snapshot
- Table 6.18 Thermo Fisher Scientific: NGS Kit Portfolio
- Table 6.19 Thermo Fisher Scientific: Recent Developments and Future Outlook
- Table 7.1 Leading NGS Kit Providers in Europe
- Table 7.2 Abcam: Company Snapshot
- Table 7.3 Abcam: NGS Kit Portfolio
- Table 7.4 Abcam: Recent Developments and Future Outlook
- Table 7.5 Devyser: Company Snapshot
- Table 7.6 Devyser: NGS Kit Portfolio
- Table 7.7 Devyser: Recent Developments and Future Outlook
- Table 7.8 Diagenode: Company Snapshot
- Table 7.9 Diagenode: NGS Kit Portfolio
- Table 7.10 Diagenode: Recent Developments and Future Outlook
- Table 7.11 Lexogen: Company Snapshot
- Table 7.12 Lexogen: NGS Kit Portfolio
- Table 7.13 Lexogen: Recent Developments and Future Outlook
- Table 7.14 Roche: Company Snapshot
- Table 7.15 Roche: NGS Kit Portfolio
- Table 7.16 Roche: Recent Developments and Future Outlook
- Table 7.17 Tecan: Company Snapshot
- Table 7.18 Tecan: NGS Kit Portfolio
- Table 7.19 Tecan: Recent Developments and Future Outlook
- Table 8.1 Leading NGS Kit Providers in Asia Pacific
- Table 8.2 Enzynomics: Company Snapshot
- Table 8.3 Enzynomics: NGS Kit Portfolio
- Table 8.4 MGI: Company Snapshot
- Table 8.5 MGI: NGS Kit Portfolio
- Table 8.6 Takara Bio: Company Snapshot
- Table 8.7 Takara Bio: NGS Kit Portfolio
- Table 8.8 Takara Bio: Recent Developments and Future Outlook
- Table 8.9 TIANGEN Biotech: Company Snapshot
- Table 8.10 TIANGEN Biotech: NGS Kit Portfolio
- Table 8.11 TransGen Biotech: Company Snapshot
- Table 8.12 TransGen Biotech: NGS Kit Portfolio
- Table 8.13 Vazyme: Company Snapshot
- Table 8.14 Vazyme: NGS Kit Portfolio
- Table 9.1 Patent Analysis: Prominent CPC Symbols
- Table 9.2 Patent Analysis: Most Popular CPC Symbols
- Table 9.3 Patent Analysis: List of Top CPC Symbols
- Table 9.4 Patent Analysis: Summary of Benchmarking Analysis
- Table 9.5 Patent Analysis: Categorization based on Weighted Valuation Scores
- Table 9.6 Patent Portfolio: List of Leading Patents (in terms of Highest Relative Valuation)
- Table 9.7 Patent Portfolio: List of Leading Patents (in terms of Number of Citations)
- Table 11.1 Comparison of First, Second and Third Generation Sequencing Technologies
- Table 11.2 Next Generation Sequencing: List of Available Technologies
- Table 11.3 Next Generation Sequencing Service Providers: List of Industry Players
- Table 11.4 Next Generation Sequencing Service Providers: List of Non-Industry Players
- Table 13.1 Tecan: Company Snapshot
- Table 14.1 Next Generation Sequencing Kits: Distribution by Type of Nucleotide Sequenced
- Table 14.2 Next Generation Sequencing Kits: Distribution by Kit Components
- Table 14.3 Next Generation Sequencing Kits: Distribution by Quantity of Sample Required
- Table 14.4 Next Generation Sequencing Kits: Distribution by Turnaround Time
- Table 14.5 Next Generation Sequencing Kits: Distribution by Storage Temperature
- Table 14.6 Next Generation Sequencing Kits: Distribution by Type of Sample Used
- Table 14.7 Next Generation Sequencing Kits: Distribution by Kit Shelf Life
- Table 14.8 Next Generation Sequencing Kits: Distribution by Type of Sequencing
- Table 14.9 Next Generation Sequencing Kits: Type of Sequencing Platform Used
- Table 14.10 Next Generation Sequencing Kit Providers: Distribution by Year of Establishment
- Table 14.11 Next Generation Sequencing Kit Providers: Distribution by Company Size
- Table 14.12 Next Generation Sequencing Kit Providers: Distribution by Location of Headquarters
- Table 14.13 Leading Players: Distribution by Number of Products
- Table 14.14 Agilent Technologies: Annual Revenues, Since 2016 (USD Billion)
- Table 14.15 PerkinElmer: Annual Revenues, Since 2021 (USD Billion)
- Table 14.16 Thermo Fisher Scientific: Annual Revenues, Since 2016 (USD Billion)
- Table 14.17 Abcam: Annual Revenues, FY 2016-H1 2021 (GBP Million)
- Table 14.18 Roche: Annual Revenues, 2016-H1 2021 (CHF Billion)
- Table 14.19 Tecan: Annual Revenues, 2016-H1 2021 (CHF Million)
- Table 14.20 Takara Bio: Annual Revenues, FY 2016-Q1 2021 (JPY Billion)
- Table 14.21 Patent Analysis: Distribution by Type of Patent
- Table 14.22 Patent Analysis: Distribution by Year of Publication
- Table 14.23 Patent Analysis: Distribution by Location of Patent Jurisdiction (Region-wise)
- Table 14.24 Patent Analysis: Distribution by Location of Jurisdiction (Country-wise)
- Table 14.25 Patent Analysis: Distribution by CPC Symbols
- Table 14.26 Patent Analysis: Cumulative Year-wise Distribution by Type of Applicant
- Table 14.27 Leading Industry Players: Distribution by Number of Patents
- Table 14.28 Leading Non-Industry Players: Distribution by Number of Patents
- Table 14.29 Leading Patent Assignees: Distribution by Number of Patents
- Table 14.30 Patent Analysis: Distribution by Age
- Table 14.31 Patent Analysis: Patent Valuation
- Table 14.32 Global Next Generation Sequencing Kits Market, Till 2035: Conservative, Base and Optimistic Scenarios (USD Billion)
- Table 14.33 Next Generation Sequencing Kits Market, 2021 and 2035: Distribution by Type of Nucleotide Sequenced (USD Billion)
- Table 14.34 Next Generation Sequencing Kits Market for DNA, Till 2035: Conservative, Base and Optimistic Scenarios (USD Billion)
- Table 14.35 Next Generation Sequencing Market for RNA, Till 2035: Conservative, Base and Optimistic Scenarios (USD Billion)
- Table 14.36 Next Generation Sequencing Kits Market, 2021 and 2035: Distribution by Type of End User (USD Billion)
- Table 14.37 Next Generation Sequencing Kits Market for Academic and Research Institutes, Till 2035: Conservative, Base and Optimistic Scenarios (USD Billion)
- Table 14.38 Next Generation Sequencing Kits Market for Pharmaceutical and Biotechnology Companies, Till 2035: Conservative, Base and Optimistic Scenarios (USD Billion)
- Table 14.39 Next Generation Sequencing Kits Market for Hospitals and Clinics, Till 2035: Conservative, Base and Optimistic Scenarios (USD Billion)
- Table 14.40 Next Generation Sequencing Kits Market for Others, Till 2035: Conservative, Base and Optimistic Scenarios (USD Billion)
- Table 14.41 Next Generation Sequencing Kits, 2021 and 2035: Distribution by Geography (USD Billion)
- Table 14.42 Next Generation Sequencing Kits Market in North America, Till 2035: Conservative, Base and Optimistic Scenarios (USD Billion)
- Table 14.43 Next Generation Sequencing Kits Market in Europe, Till 2035: Conservative, Base and Optimistic Scenarios (USD Billion)
- Table 14.44 Next Generation Sequencing Kits Market in Asia-Pacific, Till 2035: Conservative, Base and Optimistic Scenarios (USD Billion)
- Table 14.45 Next Generation Sequencing Kits Market in Middle East and North Africa, Till 2035: Conservative, Base and Optimistic Scenarios (USD Billion)
- Table 14.46 Next Generation Sequencing Kits Market in Latin America, Till 2035: Conservative, Base and Optimistic Scenarios (USD Billion)
- Table 14.47 Next Generation Sequencing Kits Market in Rest of the World, Till 2035: Conservative, Base and Optimistic Scenarios (USD Billion)
- Table 14.48 Next Generation Sequencing Technologies: Analysis by Type of Application
- Table 14.49 Next Generation Sequencing Service Providers (Industry Players): Distribution by Year of Establishment
- Table 14.50 Next Generation Sequencing Service Providers (Industry Players): Distribution by Company Size
- Table 14.51 Next Generation Sequencing Service Providers (Industry Players): Distribution by Location of Headquarters
- Table 14.52 Next Generation Sequencing Service Providers (Industry Players): Distribution by Type of Service Offered
- Table 14.53 Next Generation Sequencing Service Providers (Non-Industry Players): Distribution by Year of Establishment
- Table 14.54 Next Generation Sequencing Service Providers (Non-Industry Players): Distribution by Location of Headquarters
- Table 14.55 Next Generation Sequencing Service Providers (Non-Industry Players): Distribution by Type of Service Offered
List of Figures
- Figure 2.1 Executive Summary: Market Forecast
- Figure 2.2 Executive Summary: Overall Market Landscape
- Figure 2.3 Executive Summary: Patent Analysis
- Figure 3.1 Types of Sequencing
- Figure 3.2 Applications of Next Generation Sequencing
- Figure 3.3 Steps Involved in Next Generation Sequencing
- Figure 4.1 Next Generation Sequencing Kits: Distribution by Type of Nucleotide Sequenced
- Figure 4.2 Next Generation Sequencing Kits: Distribution by Kit Components
- Figure 4.3 Next Generation Sequencing Kits: Distribution by Quantity of Sample Required
- Figure 4.4 Next Generation Sequencing Kits: Distribution by Turnaround Time
- Figure 4.5 Next Generation Sequencing Kits: Distribution by Storage Temperature
- Figure 4.6 Next Generation Sequencing Kits: Distribution by Type of Sample Used
- Figure 4.7 Next Generation Sequencing Kits: Distribution by Kit Shelf Life
- Figure 4.8 Next Generation Sequencing Kits: Distribution by Type of Sequencing
- Figure 4.9 Next Generation Sequencing Kits: Distribution by Type of Sequencing Platform Used
- Figure 4.10 Next Generation Sequencing Kit Providers: Distribution by Year of Establishment
- Figure 4.11 Next Generation Sequencing Kit Providers: Distribution by Company Size
- Figure 4.12 Next Generation Sequencing Kit Providers: Distribution by Location of Headquarters
- Figure 4.13 Leading Players: Distribution by Number of Products
- Figure 5.1 Next Generation Sequencing Kits: Dot Plot Analysis
- Figure 5.2 Product Competitiveness Analysis: Competitive Landscape
- Figure 6.1 Agilent Technologies: Annual Revenues, Since 2016 (USD Billion)
- Figure 6.2 PerkinElmer: Annual Revenues, Since 2016 (USD Billion)
- Figure 6.3 Thermo Fisher Scientific: Annual Revenues, Since 2016 (USD Billion)
- Figure 7.1 Abcam: Annual Revenues, Since 2016 (GBP Million)
- Figure 7.2 Roche: Annual Revenues, Since 2016 (CHF Billion)
- Figure 7.3 Tecan: Annual Revenues, Since 2016 (CHF Million)
- Figure 8.1 Takara Bio: Annual Revenues, Since 2016 (JPY Billion)
- Figure 9.1 Patent Analysis: Distribution by Type of Patent
- Figure 9.2 Patent Analysis: Distribution by Year of Publication
- Figure 9.3 Patent Analysis: Distribution by Location of Patent Jurisdiction (Region-wise)
- Figure 9.4 Patent Analysis: Distribution by Location of Patent Jurisdiction (Country-wise)
- Figure 9.5 Patent Analysis: Distribution by CPC Symbols
- Figure 9.6 Patent Analysis: Emerging Focus Areas
- Figure 9.7 Patent Analysis: Cumulative Year-wise Distribution by Type of Applicant
- Figure 9.8 Leading Industry Players: Distribution by Number of Patents
- Figure 9.9 Leading Non-Industry Players: Distribution by Number of Patents
- Figure 9.10 Leading Patent Assignees: Distribution by Number of Patents
- Figure 9.11 Patent Benchmarking: Distribution of Leading Industry Player by Patent Characteristics (CPC Symbols)
- Figure 9.12 Patent Analysis: Distribution by Age
- Figure 9.13 Patent Analysis: Patent Valuation
- Figure 10.1 Global Next Generation Sequencing Kits Market, Till 2035 (USD Billion)
- Figure 10.2 Next Generation Sequencing Kits: Likely Growth Scenarios
- Figure 10.3 Next Generation Sequencing Kits Market: Distribution by Type of Nucleotide Sequenced (USD Billion)
- Figure 10.4 Next Generation Sequencing Kits Market for DNA, Till 2035 (USD Billion)
- Figure 10.5 Next Generation Sequencing Market for RNA, Till 2035 (USD Billion)
- Figure 10.6 Next Generation Sequencing Kits Market: Distribution by Type of End User (USD Billion)
- Figure 10.7 Next Generation Sequencing Kits Market for Academic and Research Institutes, Till 2035 (USD Billion)
- Figure 10.8 Next Generation Sequencing Kits Market for Pharmaceutical and Biotechnology Companies, Till 2035 (USD Billion)
- Figure 10.9 Next Generation Sequencing Kits Market for Hospitals and Clinics, Till 2035 (USD Billion)
- Figure 10.10 Next Generation Sequencing Kits Market for Others, Till 2035 (USD Billion)
- Figure 10.11 Next Generation Sequencing Kits: Distribution by Geography(USD Billion)
- Figure 10.12 Next Generation Sequencing Kits Market in North America, Till 2035 (USD Billion)
- Figure 10.13 Next Generation Sequencing Kits Market in Europe, Till 2035 (USD Billion)
- Figure 10.14 Next Generation Sequencing Kits Market in Asia Pacific, Till 2035 (USD Billion)
- Figure 10.15 Next Generation Sequencing Kits Market in Middle East and North Africa, Till 2035 (USD Billion)
- Figure 10.16 Next Generation Sequencing Kits Market in Latin America, Till 2035 (USD Billion)
- Figure 10.17 Next Generation Sequencing Kits Market in Rest of the World, Till 2035 (USD Billion)
- Figure 11.1 Third Generation HT-NGS Platforms
- Figure 11.2 Next Generation Sequencing Technologies: Analysis by Type of Application
- Figure 11.3 Next Generation Sequencing Service Providers (Industry Players): Distribution by Year of Establishment
- Figure 11.4 Next Generation Sequencing Service Providers (Industry Players): Distribution by Company Size
- Figure 11.5 Next Generation Sequencing Service Providers (Industry Players): Distribution by Location of Headquarters
- Figure 11.6 Next Generation Sequencing Service Providers (Industry Players): Distribution by Type of Service Offered
- Figure 11.7 Next Generation Sequencing Service Providers (Non-Industry Players): Distribution by Year of Establishment
- Figure 11.8 Next Generation Sequencing Service Providers (Non-Industry Players): Distribution by Location of Headquarters
- Figure 11.9 Next Generation Sequencing Service Providers (Non-Industry Players): Distribution by Type of Service Offered
- Figure 12.1 Concluding Remarks: Overall Market Landscape
- Figure 12.2 Concluding Remarks: Patent Analysis
- Figure 12.3 Concluding Remarks: Market Forecast
 疾病治療生物製藥市場分析及預測(至2035年):依類型、產品、服務、技術、應用、最終使用者、流程、部署及設備分類虛擬腫瘤學市場分析及預測(至2035年):依類型、產品、服務、技術、組件、應用、最終用戶、部署類型及功能分類
 全球真實世界證據腫瘤市場:按組件、資料來源類型、治療領域、應用、最終用戶、國家和地區分類-產業分析、市場規模、佔有率和預測(2025-2032)
 全球腫瘤軟體市場:市場規模、佔有率、成長率、產業分析、依類型、應用和地區劃分的分析以及未來預測(2026-2034)腫瘤精準醫療合作與授權協議(2016-2025)
 免疫腫瘤臨床試驗市場(依治療類型、臨床試驗階段、適應症、申辦者類型、臨床試驗類型及病人入組分類)-2025-2032年全球預測腫瘤NGS市場按產品類型、癌症類型、應用和最終用戶分類-2025-2032年全球預測全球腫瘤生物標記診斷市場,2024-2030年
 虛擬腫瘤學市場:按成分、癌症類型、應用、最終用戶和地區分類
 腫瘤伴同性診斷市場規模、佔有率及成長分析(按成分、適應症、技術、最終用戶和地區)- 產業預測,2025-2032 年