


 |
市場調查報告書
商品編碼
1891250
單細胞定序市場:產業趨勢及全球預測(至 2035 年)-按系統類型、最終使用者、應用領域和主要地區劃分Single Cell Sequencing Market: Industry Trends and Global Forecasts, Till 2035 - Distribution by Type of System, End-user, Area of Application, and Key Geographies |
||||||
單細胞定序市場概述
預計單細胞定序市場規模將從今年的 13.87 億美元成長,到 2035 年將以 15% 的複合年增長率 (CAGR) 持續成長。
單細胞定序服務與技術市場概述
市場規模和機會分析基於以下參數進行細分:
市場區隔
- 服務
- 技術
系統類型
- 定序
- 工作流程設備
最終使用者
- 學術和研究機構機構
- 製藥公司
- 其他
應用
- 診斷
- 藥物發現
- 精準醫療
主要地區
- 北美
- 歐洲
- 亞太地區
- 世界其他地區
單細胞定序市場 - 成長與趨勢
近年來,基因組學領域的技術進步使製藥公司能夠採取更個人化和精準的藥物和治療研發方法。特別是新一代定序 (NGS) 技術,使得對來自不同背景的數百萬個個人類基因組進行定序成為可能。從這些定序研究中收集的大量基因組數據,為了解個體對各種治療方案的可能反應提供了重要的見解。該領域的進步使得 NGS 技術更具成本效益,並且廣泛應用。過去20年間,單一基因組定序的成本已從約30億美元(1990年人類基因組計畫)降至1,000美元(Illumina定序試劑盒)。然而,基於NGS的分析在提供足夠的基因表現資訊方面有其限制。此方法無法量化單一細胞內的核酸含量,因此無法提供單細胞層級的基因表現數據。為了更深入了解單一細胞如何與其微環境相互作用,需要更先進的分子探測技術。在此背景下,高通量單細胞分析作為一種新型分析技術,被認為是研究單一細胞的有效方法,使科學家能夠在單細胞層級研究基因表現。
單細胞技術相比傳統基因組分析具有許多優勢,能夠識別複雜和稀有的細胞群,並揭示獨特的細胞譜系發育途徑。儘管單細胞技術在生物技術和醫學研究領域具有廣泛的潛在應用,但目前仍處於初步研究階段。 這主要是由於資料處理和品質控制方面存在一些困難。此外,電腦輔助工具缺乏彈性也被認為是有效分析和解讀單細胞定序資料的主要障礙之一。同時,持續的流程執行成本和相關的勞力密集操作流程也進一步阻礙了單細胞定序技術的廣泛應用。旨在解決數據處理和品質控制難題的RNA-QC-Chain工具的發布,以及致力於構建首個人類細胞全轉錄組圖譜的人類細胞圖譜計劃,被認為是單細胞基因組學領域的重要里程碑。鑑於單細胞RNA定序(scRNA-seq)技術能夠探索以往難以捉摸的細胞過程,並發現新的生物標記和治療靶點,預計該技術在預測期內將實現顯著的市場增長,並在生物醫學研究領域中廣泛應用。
單細胞定序服務與技術市場-關鍵洞察
本報告深入分析了單細胞定序服務與科技市場的現狀,並指出了該產業的潛在成長機會。報告的主要發現包括:
- 目前,全球近100家公司聲稱提供單細胞定序服務,並採用各種專有技術平台。
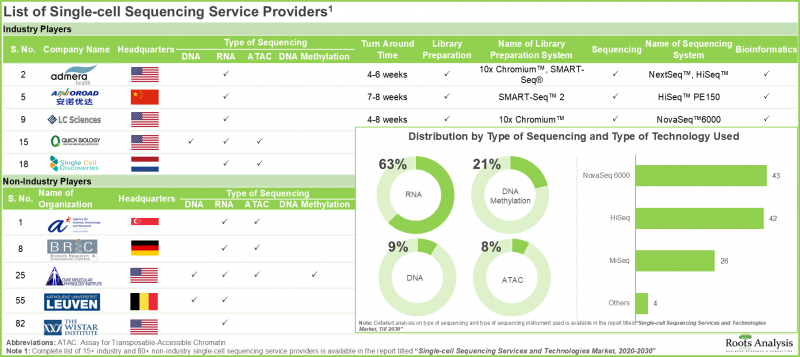
- 當前市場格局的特點是,已開發地區存在著許多非行業參與者,而一些行業參與者則是近期才進入這一新興領域。
- 技術供應商正在穩步加強其產品組合,以在行業中建立競爭優勢。
- 多年來,與單細胞定序系統相關的智慧財產權以驚人的速度成長,其中大部分專利申請都在北美。
- 鑑於這一新興領域的潛力,自2016年以來,各機構已授予超過2300項資助,總額約10億美元。
- 該領域資本投資、合作協議和產品發布的激增也反映出人們日益增長的興趣。
- 由於對單細胞基因組數據的需求不斷增長,以及先進定序技術的預期應用,預計未來十年該市場將以每年約17%的速度成長。
- 預計單細胞定序市場的商業機會將廣泛分佈於全球各個應用領域和終端用戶。
單細胞定序市場 - 主要細分市場
定序系統預計將佔目前單細胞定序市場佔有率的大部分。
依儀器類型劃分,市場可分為各種儀器,包括工作流程儀器及定序儀器。今年,定序儀器佔了大部分市場佔有率(約 51%)。然而,預計在預測期內,工作流程儀器的複合年增長率將達到 34%。
目前,學術研究機構佔單細胞定序市場最大的佔有率。
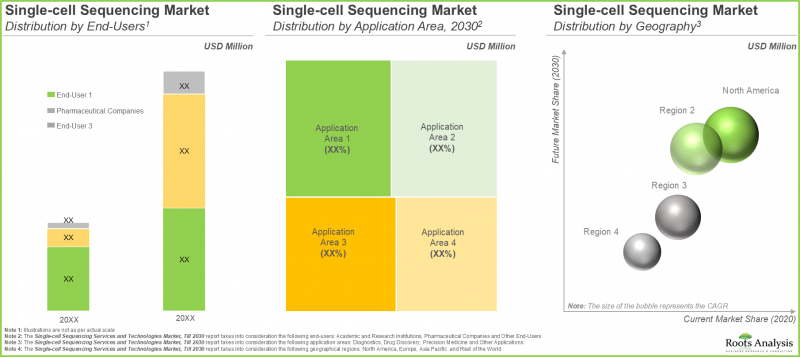
依最終用戶劃分,單細胞定序市場可分為學術研究機構、製藥公司和其他最終用戶。目前,學術研究機構佔了大部分市場佔有率(約 60%),其次是製藥公司(30%)。預計未來幾年這一趨勢將保持穩定。
目前,學術研究機構佔單細胞定序市場最大的佔有率。
依最終用戶劃分,單細胞定序市場可分為學術研究機構、製藥公司和其他最終用戶。目前,學術研究機構佔了大部分市場佔有率(約 60%),其次是製藥公司(30%)。預計未來幾年這一趨勢將保持穩定。
預計未來藥物研發將佔單細胞定序市場最大的佔有率。
依應用領域劃分,單細胞定序市場可分為藥物研發、診斷、精準醫療及其他領域。預計藥物研發將佔約 50% 的市場佔有率,其次是診斷(20%)和精準醫療(17%)。
預計北美將引領單細胞定序市場。
依地區劃分,單細胞定序市場可分為北美、歐洲、亞太地區及世界其他地區。預計北美將佔約 50% 的市場佔有率,其次是歐洲(26%)和亞太地區(24%)。
單細胞定序市場代表性公司
- Active Motif
- Admera Health
- 安諾路德基因組
- 華大基因
- CD Genomics
- MedGenome
- Quick Biology
- SingulOmics
- 10x Genomics
- Cell Microsystems
- Fluidigm
- Illumina
- Mission Bio
- Oxford Nanopore Technologies
單細胞服務與技術市場 - 範圍
- 市場規模與機會分析:本報告對單細胞定序市場進行了詳細分析,重點關注以下關鍵市場細分:[A] 市場細分,[B] 系統類型,[C] 最終用戶,[D] 應用領域,以及 [E]重點區域。
- 市場概況:基於相關參數(例如[A] 目標核酸、[B] 應用類型、[C] 應用類型、[D] 成立年份、[E] 公司規模和[F] 地理位置)對單細胞定序工作流程設備的整體競爭格局進行深入評估。
- 公司競爭分析:對單細胞技術進行全面的競爭分析,檢視供應商實力和其他關鍵技術相關規格,例如最大定序產量、每次運行最大讀取數、最大讀取長度、品質評分、應用領域和定序儀成本。
- 公司簡介:基於多個參數(例如[A] 成立年份、[B] 總部所在地、[C] 專有技術平台、[D] 近期發展和[E] 未來展望)對提供單細胞測序服務和單細胞技術的公司進行詳細介紹。
- 專利分析:基於以下參數,對單細胞定序技術相關的各類專利申請和授權進行深入分析:[A] 專利類型,[B] 公開年份,[C] 地理位置,[D] 合作專利分類 (CPC) 代碼,[E] 新興和熱點領域,以及 [F] 申請人類型。
- 資助分析:針對授予從事單細胞測序相關項目的研究機構的資助,分析以下參數:[A] 資助年份,[B] 資助金額,[C] 重點領域,[D] 活動代碼,[E] 支持期限,[F] 資助機制,[G] 資助機構中心,[H] 受資助方類型,[I] 資助者主要受資助機構中心,[H] 受資助方類型,[I] 主要受資助方負責項目。
- 近期趨勢:對單細胞定序領域近期發展與趨勢的深入分析。重點在於[A]產業內建立的合作關係,[B]資金和投資,以及[C]近期單細胞定序相關產品的發布。
目錄
第一章:前言
第二章:摘要整理
第三章:導論
- 章節概述
- 單細胞定序概述
- 單細胞定序的應用
- 單細胞定序面臨的挑戰
- 未來展望
第四章:市場概況:單細胞定序服務提供者
- 章節概述
- 單細胞定序服務提供者:產業參與者的市場概況
- 單細胞定序服務提供者:非產業參與者的市場概況參與者
第五章 市場概況:單細胞定序技術供應商
- 章節概述
- 單細胞定序系統與技術:工作流程儀器市場概況
- 單細胞定序系統與技術:開發者視角
- 單細胞定序系統與技術:定序儀器市場概況
- 單細胞定序系統與技術:開發者視角
第六章:單細胞定序技術:競爭分析
第七章:公司簡介:單細胞定序服務提供者
- 章節概述
- Active Motif
- Admera Health
- Annoroad基因體學
- 華大基因
- CD Genomics
- MedGenome
- Quick Biology
- SingulOmics
第八章:公司簡介:單細胞定序技術提供者
- 10x Genomics
- Cell Microsystems
- Fluidigm
- Illumina
- Mission Bio
- Oxford Nanopore Technologies
第九章:專利分析
- 章節概述
- 範圍與研究方法
- 單細胞定序:專利分析
- 單細胞定序:基準分析
- 單細胞定序:專利估值分析
第十章 學術資助分析
- 章節概述
- 研究範圍與方法
- 單細胞定序:學術資助分析
第十一章:近期趨勢:單細胞定序市場
- 章節概述
- 單細胞定序:近期合作
- 單細胞定序:近期融資與投資
- 單細胞定序:近期產品發布
第十二章 市場規模評估與機會分析
- 章節概述
- 關鍵假設與預測研究方法論
- 單細胞定序服務和技術的整體市場機會
- 到 2030 年,主要細分市場中單細胞定序服務和技術的市場機會
- 2020 年和 2030 年,按系統類型劃分的單細胞定序服務和技術的市場機會
- 2020 年和 2030 年,按最終用戶劃分的單細胞測序服務和技術的市場機會
- 2020 年和 2030 年,按應用領域劃分的單細胞定序服務和技術的市場機會
- 2020 年和 2030 年,按地域劃分的單細胞定序服務和技術的市場機會
第十三章:結論
第十四章:摘要整理見解
第十五章:附錄一:表格資料
Single Cell Sequencing Market: Overview
As per Roots Analysis, the single cell sequencing market is estimated to grow from USD 1,387 million in the current year and is anticipated to grow at a CAGR of 15% during the forecast period, till 2035.
Single Cell Sequencing Services and Technologies Market: Overview
The market sizing and opportunity analysis has been segmented across the following parameters:
Market Segment
- Services
- Technologies
Type of System
- Sequencing
- Workflow Instruments
End-user
- Academics and Research Institutes
- Pharmaceutical Companies
- Other End-users
Area of Application
- Diagnostics
- Drug Discovery
- Precision Medicine
Key Geographies
- North America
- Europe
- Asia-Pacific
- Rest of the World
Single Cell Sequencing market: Growth and Trends
Over the years, advancements in technology within genomics have allowed pharmaceutical companies to pursue a more individualized and focused method for developing drugs and therapies. In particular, next-generation sequencing (NGS) technologies have made it possible to sequence millions of human genomes from various backgrounds. The significant amount of blockchain in genomic data management from the previously mentioned sequencing studies have produced important insights into individuals' probable reactions to various treatment protocols. Advancements in this area have made NGS technologies more cost-effective and widely available. The price of sequencing one genome has decreased from approximately USD 3 billion (Human Genome Project 1990) to USD 1,000 (Illumina sequencing kits) in the past twenty years. Nonetheless, NGS-based analyses are restricted to providing adequate information on gene expression. This method cannot quantify nucleic acid content within individual cells, thus failing to provide gene expression data at single cell resolution. Enhanced molecular probing solutions are needed to gain a deeper insight into how individual cells interact with their microenvironment. In this setting, high-throughput single cell analysis, a novel analytical method, is regarded as an effective approach for examining individual cells, allowing scientists to investigate gene expression at the resolution of single cells.
Single cell technologies provide numerous benefits compared to conventional genomic analyses, allowing for the identification of intricate and infrequent cell populations, while clarifying developmental pathways of unique cell lineages. Although single cell technologies have the potential for various applications in biotechnology and medical research, they remain confined to preliminary research endeavors. This is mainly due to specific difficulties linked to data processing and quality management. Additionally, the absence of flexibility in silico tools is viewed as one of the key obstacles to effective analysis and interpretation of single cell sequencing data. Moreover, the steady expenses of process execution and related labor-intensive protocols present additional obstacles to embracing single cell sequencing technology. The launch of the RNA-QC-Chain tool (aimed at tackling issues related to data processing and quality control) and the Human Cell Atlas initiative (which focuses on creating the first entire transcriptome map of human cells) are viewed as significant milestones in single cell genomics.onsidering the capability of single cell RNA sequencing (scRNA-seq) technologies to explore previously unclear cellular processes and discover new biomarkers / therapeutic targets, they are expected to experience considerable market growth and acceptance in biomedical research throughout the forecast period.
Single Cell Sequencing Services and Technologies Market: Key Insights
The report delves into the current state of the single cell sequencing services and technologies market and identifies potential growth opportunities within industry. Some key findings from the report include:
- Presently, close to 100 players claim to offer single cell sequencing services using a variety of unique technology platforms across the globe.
- The current market landscape is characterized by the presence of several non-industry players based in developed regions; quite recently, some industry players have entered this upcoming segment of the industry.
- Technology providers are steadily enhancing their respective product portfolios in order to achieve a competitive edge in the industry.
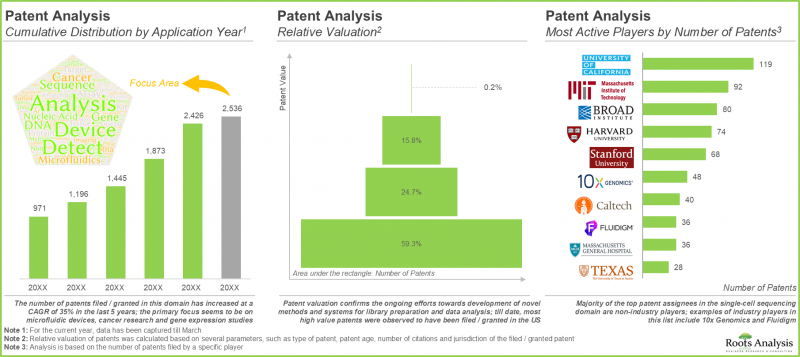
- Over the years, the intellectual capital related to single cell sequencing systems has grown at a commendable pace; majority of the patents have been filed in North America.
- Several organizations, having realized the untapped potential within this emerging segment, have awarded grants worth ~USD 1 billion, across 2,300+ instances in the period since 2016.
- The growing interest is also reflected by the surge of activity witnessed in this field, in form of capital investments, partnership agreements and product launches.
- Given the rising demand for single cell genomic data, and anticipated introduction of advanced sequencing technologies, the market is poised to grow at an annualized rate of ~17% over the next decade.
- The projected opportunity within the single cell sequencing market is expected to be well distributed within different areas of application and end users, across the globe.
Single Cell Sequencing Market: Key Segments
Sequencing Systems are Likely to Capture Majority of the Current Single-cell Sequencing Market Share
In terms of type of instrument, the single-cell sequencing market is segmented across various instruments such as workflow and sequencing instruments. In the current year, majority of the market share is captured by sequencing instruments (around 51%). However, the workflow segment is likely to grow at a higher CAGR of 34% during the forecast period.
Currently, Academic and Research Institutions Capture the Highest Singe Cell Sequencing Market Share
In terms of end-users, the single-cell sequencing market is segmented across academic and research institutions, pharmaceutical companies and other end-users. Most of the current market share is captured by academic and research institutions (around 60%), followed by pharmaceutical companies (30%). The trend is likely to similar in the coming years.
At present, Academic and Research Institutions Capture the Highest Single Cell Sequencing Market Share
In terms of end-users, the single-cell sequencing market is segmented across academic and research institutions, pharmaceutical companies and other end-users. Most of the current market share is captured by academic and research institutions (around 60%), followed by pharmaceutical companies (30%). The trend is likely to similar in the coming years.
Drug Discovery Segment is Likely to Capture the Highest Singe Cell Sequencing Market Share in the Future
In terms of area of application, the single-cell sequencing market is segmented across drug discovery, diagnostics, precision medicine and others. Around 50% of the market share is likely to be captured by drug discovery segment, followed by diagnostics (20%) and precision medicine (17%).
North America is Likely to Propel the Single-cell Sequencing Market
In terms of geographical regions, the single-cell sequencing market is segmented across North America, Europe, Asia-Pacific and Rest of the World. Around 50% of the market share is likely to be captured by North America, followed by Europe (26%) and Asia-Pacific (24%).
Example Players in Single cell Sequencing Market
- Active Motif
- Admera Health
- Annoroad Genomics
- BGI Genomics
- CD Genomics
- MedGenome
- Quick Biology
- SingulOmics
- 10x Genomics
- Cell Microsystems
- Fluidigm
- Illumina
- Mission Bio
- Oxford Nanopore Technologies
Single Cell Services and Technologies Market: Research Coverage
- Market Sizing and Opportunity Analysis: The report features an in-depth analysis of the single cell sequencing market, focusing on key market segments, including [A] market segments, [B] type of system, [C] end-user, [D] area of application, and [E] key geographical regions.
- Market Landscape: A detailed assessment of overall competitive landscape of single cell sequencing workflow instruments based on several relevant parameters, such as [A] target nucleic acid, [B] type of application, [C] type of application, [D] year of establishment, [E] company size and [F] geographical location.
- Company Competitiveness Analysis: A comprehensive competitive analysis of single cell technologies examining factors, such as supplier power and other important technology related specifications, such as maximum sequencing output, maximum reads per run, maximum read length, quality score, applications and cost of sequencer.
- Company Profiles: In-depth profiles of single cell companies that are engaged in offering single cell sequencing services and single cell technologies, based on several parameters such as [A] year of establishment, [B] location of headquarters, [C] proprietary technology platforms, [D] recent developments and [E] an informed future outlook.
- Patent Analysis: An insightful analysis of the various patents that have been filed / granted for single cell sequencing technologies, based on parameters, such as [A] patent type, [B] publication year, [C] geographical location, [D] Cooperative Patent Classification (CPC) symbols, [E] emerging focus areas, and [F] type of applicant.
- Grants Analysis: A detailed analysis of the grants that have been awarded to research institutes engaged in projects related to single cell sequencing, based on multiple parameters, such as [A] year of grant award, [B] grant amount, [C] focus area, [D] activity code, [E] support period, [F] funding mechanism, [G] funding institute center, [H] type of recipient organization, [I] popular recipient organizations and [J] prominent program officers.
- Recent Developments: An insightful analysis of the recent developments / trends in the related to single cell sequencing, offering insights on [A] partnerships and collaborations established within the industry, [B] funding and investments, and [C] recent product launches related to single cell sequencing.
Key Questions Answered in this Report
- How many companies are currently engaged in this market?
- Which are the leading companies in this market?
- What is the current global capacity of developers?
- What factors are likely to influence the evolution of this market?
- What is the current and future market size?
- What is the CAGR of this market?
- How is the current and future market opportunity likely to be distributed across key market segments?
Reasons to Buy this Report
- The report provides a comprehensive market analysis, offering detailed revenue projections of the overall market and its specific sub-segments. This information is valuable to both established market leaders and emerging entrants.
- Stakeholders can leverage the report to gain a deeper understanding of the competitive dynamics within the market. By analyzing the competitive landscape, businesses can make informed decisions to optimize their market positioning and develop effective go-to-market strategies.
- The report offers stakeholders a comprehensive overview of the market, including key drivers, barriers, opportunities, and challenges. This information empowers stakeholders to stay abreast of market trends and make data-driven decisions to capitalize on growth prospects.
Additional Benefits
- Complimentary PPT Insights Packs
- Complimentary Excel Data Packs for all Analytical Modules in the Report
- 15% Free Content Customization
- Detailed Report Walkthrough Session with Research Team
- Free Updated report if the report is 6-12 months old or older
TABLE OF CONTENTS
1. PREFACE
- 1.1. Scope of the Report
- 1.2. Research and Methodology
- 1.3. Key Questions Answered
- 1.4. Chapter Outlines
2. EXECUTIVE SUMMARY
3. INTRODUCTION
- 3.1. Chapter Overview
- 3.2. Overview of Single cell Sequencing
- 3.2.1. Comparison of Bulk RNA and Single cell RNA Sequencing
- 3.3. Applications of Single cell Sequencing
- 3.3.1. In Cancer Research
- 3.3.2. In Clinical Diagnostics
- 3.3.3. In Drug Discovery
- 3.3.4. In Embryology
- 3.3.5. In Immunology
- 3.3.6. In Microbiology
- 3.3.7. In Neurology
- 3.3.8. In Organ Development
- 3.4. Challenges Associated with Single cell Sequencing
- 3.4.1. Data Pre-processing
- 3.4.2. Low Capturing Efficiency
- 3.4.3. Rigid and Undefined Statistical Frameworks
- 3.4.4. Lack of Appropriate Quality Control Systems
- 3.5. Future Perspectives
4. MARKET LANDSCAPE: SINGLE CELL SEQUENCING SERVICE PROVIDERS
- 4.1. Chapter Overview
- 4.2. Single cell Sequencing Service Providers: Market Landscape of Industry Players
- 4.2.1. Analysis by Year of Establishment
- 4.2.2. Analysis by Company Size
- 4.2.3. Analysis by Location of Headquarters
- 4.2.4. Analysis by Sequencing Method Used
- 4.2.5. Analysis by Type of Service Offered
- 4.2.6. Analysis by Type of Library Preparation System Used
- 4.2.7. Analysis by Type of Sequencing System Used
- 4.3. Single cell Sequencing Service Providers: Market Landscape of Non-Industry Players
- 4.3.1. Analysis by Location of Organization
- 4.3.2. Analysis by Sequencing Method Used
- 4.3.3. Analysis by Type of Service Offered
- 4.3.4. Analysis by Type of Library Preparation System Used
- 4.3.5. Analysis by Type of Sequencing System Used
5. MARKET LANDSCAPE: SINGLE CELL SEQUENCING TECHNOLOGY PROVIDERS
- 5.1. Chapter Overview
- 5.2. Single cell Sequencing Systems and Technologies: Market Landscape of Workflow Instruments
- 5.2.1. Analysis by Target Nucleic Acid
- 5.2.2. Analysis by Type of Application
- 5.2.3. Analysis by Throughput
- 5.3. Single cell Sequencing Systems and Technologies: Developer Landscape
- 5.3.4. Analysis by Year of Establishment
- 5.3.5. Analysis by Company Size
- 5.3.6. Analysis by Location of Headquarters
- 5.4. Single cell Sequencing Systems and Technologies: Market Landscape of Sequencing Instruments
- 5.4.1. Analysis by Type of Application
- 5.4.2. Analysis by Maximum Output
- 5.4.3. Analysis by Maximum Read Length
- 5.4.4. Analysis by System Efficiency
- 5.4.5. Analysis by Sequencing Chemistry
- 5.5. Single cell Sequencing Systems and Technologies: Developer Landscape
- 5.5.6. Analysis by Year of Establishment
- 5.5.7. Analysis by Company Size
- 5.5.8. Analysis by Location of Headquarters
6. SINGLE CELL SEQUENCING TECHNOLOGIES: COMPETITIVENESS ANALYSIS
- 6.1. Chapter Overview
- 6.2. Key Parameters and Methodology
- 6.3. Competitiveness Analysis: Single cell Workflow Instruments
- 6.4. Competitiveness Analysis: Single cell Sequencing Instruments
7. COMPANY PROFILES: SINGLE CELL SEQUENCING SERVICE PROVIDERS
- 7.1. Chapter Overview
- 7.2. Active Motif
- 7.2.1. Company Overview
- 7.2.2. Recent Developments and Future Outlook
- 7.3. Admera Health
- 7.3.1. Company Overview
- 7.3.2. Recent Developments and Future Outlook
- 7.4. Annoroad Genomics
- 7.4.1. Company Overview
- 7.4.2. Recent Developments and Future Outlook
- 7.5. BGI Genomics
- 7.5.1. Company Overview
- 7.5.2. Recent Developments and Future Outlook
- 7.6. CD Genomics
- 7.6.1. Company Overview
- 7.6.2. Recent Developments and Future Outlook
- 7.7. MedGenome
- 7.7.1. Company Overview
- 7.7.2. Recent Developments and Future Outlook
- 7.8. Quick Biology
- 7.8.1. Company Overview
- 7.8.2. Recent Developments and Future Outlook
- 7.9. SingulOmics
- 7.9.1. Company Overview
- 7.9.2. Recent Developments and Future Outlook
8. COMPANY PROFILES: SINGLE CELL SEQUENCING TECHNOLOGY PROVIDERS
- 8.1. 10x Genomics
- 8.1.1. Company Overview
- 8.1.2. Financial Information
- 8.1.3. Product Portfolio
- 8.1.3.1. 10x Chromium
- 8.1.4. Recent Developments and Future Outlook
- 8.2. Cell Microsystems
- 8.2.1. Company Overview
- 8.2.2. Product Portfolio
- 8.2.2.1. Cellraft AIR
- 8.3. Fluidigm
- 8.3.1. Company Overview
- 8.3.2. Financial information
- 8.3.3. Product Portfolio
- 8.3.3.1. Fluidigm C1
- 8.3.4. Recent Developments and Future Outlook
- 8.4. Illumina
- 8.4.2. Financial Information
- 8.4.3. Product Portfolio
- 8.4.3.1. MiSeq Series
- 8.4.3.2. Nextseq Series
- 8.4.3.3. NovaSeq 6000 System
- 8.4.4. Recent Developments and Future Outlook
- 8.5. Mission Bio
- 8.5.1. Company Overview
- 8.5.2. Product Portfolio
- 8.5.2.1. Tapestri
- 8.5.3. Recent Developments and Future Outlook
- 8.6. Oxford Nanopore Technologies
- 8.6.1. Company Overview
- 8.6.2. Financial Information
- 8.6.3. Product Portfolio
- 8.6.3.1. MinIon Systems
- 8.6.3.2. PromethIon Systems
- 8.6.4. Recent Developments and Future Outlook
9. PATENT ANALYSIS
- 9.1. Chapter Overview
- 9.2. Scope and Methodology
- 9.3. Single cell Sequencing: Patent Analysis
- 9.3.1. Analysis by Publication Year
- 9.3.2. Analysis by Geographical Location
- 9.3.3. Analysis by CPC Symbols
- 9.3.4. Word Cloud: Emerging Focus Areas
- 9.3.5. Analysis by Type of Applicant
- 9.3.6. Leading Players: Analysis by Number of Patents
- 9.4. Single cell Sequencing: Benchmarking Analysis
- 9.4.1. Analysis by Patent Characteristics
- 9.4.2. Analysis by Geography
- 9.5. Single cell Sequencing: Patent Valuation Analysis
10. ACADEMIC GRANT ANALYSIS
- 10.1. Chapter Overview
- 10.2. Scope and Methodology
- 10.3. Single cell Sequencing: Analysis of Academic Grants
- 10.3.1. Analysis by Year of Grant Award
- 10.3.2. Analysis by Grant Amount
- 10.3.3. Analysis by Focus Area
- 10.3.4. Analysis by Activity Code
- 10.3.5. Analysis by Support Period
- 10.3.6. Analysis by Funding Mechanism
- 10.3.7. Analysis by Funding Institute Center
- 10.3.8. Analysis by Type of Recipient Organization
- 10.3.9. Popular Recipient Organizations: Analysis by Number of Grants
- 10.3.10. Prominent Program Officers: Analysis by Number of Grants
11. RECENT DEVELOPMENTS: SINGLE CELL SEQUENCING MARKET
- 11.1. Chapter Overview
- 11.2. Single cell Sequencing: Recent Partnerships
- 11.2.1. Partnership Models
- 11.2.2. Analysis by Year of Partnership
- 11.2.3. Analysis by Type of Agreement
- 11.2.4. Analysis by Focus Area of Partnership
- 11.2.5. Regional Analysis by Number of Partnerships
- 11.3. Single cell Sequencing: Recent Funding and Investments
- 11.3.1. Analysis by Year of Funding
- 11.3.3. Analysis by Type of Funding
- 11.3.2. Analysis by Amount Invested
- 11.3.4. Most Active Players: Analysis by Amount Invested
- 11.3.5. Most Active Investors: Analysis by Number of Funding Instances
- 11.4. Single cell Sequencing: Recent Product Launches
- 11.4.1. Analysis by Year of Product Launch
- 11.4.2. Analysis by Type of Product
- 11.4.3. Analysis by Focus Area
- 11.4.4. Most Active Players: Analysis by Number of Launches
12. MARKET SIZING AND OPPORTUNITY ANALYSIS
- 12.1. Chapter Overview
- 12.2. Key Assumptions and Forecast Methodology
- 12.3. Overall Single cell Sequencing Services and Technologies Market Opportunity,
- 12.4. Single cell Sequencing Services and Technologies Market Opportunity Across Key Market Segments, Till 2030
- 12.5. Single cell Sequencing Services and Technologies Market Opportunity:
- 12.6. Single cell Sequencing Services and Technologies Market Opportunity: Distribution by End-User 2020 and 2030
- 12.7. Single cell Sequencing Services and Technologies Market Opportunity: Distribution by Area of Application, 2020 and 2030
- 12.8. Single cell Sequencing Services and Technologies Market Opportunity: Geographical Distribution, 2020 and 2030
- 12.8.1. Single cell Sequencing Services and Technologies Market Opportunity in North America, Till 2030
- 12.8.1.1. Single cell Sequencing Services and Technologies Market Opportunity in North America Across Key Market Segments, Till 2030
- 12.8.1.1.1. Single cell Sequencing services and Technologies Market Opportunity in North America: Share of Service Providers, Till 2030
- 12.8.1.1.2. Single cell Sequencing services and Technologies Market Opportunity in North America: Share of Technology Providers, Till 2030
- 12.8.1.2. Single cell Sequencing Services and Technologies Market Opportunity in North America: Distribution by End-Users, Till 2030
- 12.8.1.2.1. Single cell Sequencing services and Technologies Market Opportunity in North America: Share of Academic and Research Institutions, Till 2030
- 12.8.1.2.2. Single cell Sequencing services and Technologies Market Opportunity in North America: Share of Pharmaceutical Companies, Till 2030
- 12.8.1.2.3. Single cell Sequencing services and Technologies Market Opportunity in North America: Share of Other End-Users, Till 2030
- 12.8.1.3. Single cell Sequencing Services and Technologies Market Opportunity in North America: Distribution by Area of Application, Till 2030
- 12.8.1.3.1. Single cell Sequencing services and Technologies Market Opportunity in North America: Share of Diagnostics, Till 2030
- 12.8.1.3.2. Single cell Sequencing services and Technologies Market Opportunity in North America: Share of Drug Discovery, Till 2030
- 12.8.1.3.3. Single cell Sequencing services and Technologies Market Opportunity in North America: Share of Precision Medicine, Till 2030
- 12.8.1.3.4. Single cell Sequencing services and Technologies Market Opportunity in North America: Share of Other Applications, Till 2030
- 12.8.1.1. Single cell Sequencing Services and Technologies Market Opportunity in North America Across Key Market Segments, Till 2030
- 12.8.2. Single cell Sequencing Services and Technologies Market Opportunity in Europe, Till 2030
- 12.8.2.1. Single cell Sequencing Services and Technologies Market Opportunity in Europe Across Key Market Segments, Till 2030
- 12.8.2.1.1. Single cell Sequencing services and Technologies Market Opportunity in Europe: Share of Service Providers, Till 2030
- 12.8.2.1.2. Single cell Sequencing services and Technologies Market Opportunity in Europe: Share of Technology Providers, Till 2030
- 12.8.2.2. Single cell Sequencing Services and Technologies Market Opportunity in Europe: Distribution by End-Users, Till 2030
- 12.8.2.2.1. Single cell Sequencing services and Technologies Market Opportunity in Europe: Share of Academic and Research Institutions, Till 2030
- 12.8.2.2.2. Single cell Sequencing services and Technologies Market Opportunity in Europe: Share of Pharmaceutical Companies, Till 2030
- 12.8.2.2.3. Single cell Sequencing services and Technologies Market Opportunity in Europe: Share of Other End-Users, Till 2030
- 12.8.2.3. Single cell Sequencing Services and Technologies Market Opportunity in Europe: Distribution by Area of Application, Till 2030
- 12.8.2.3.1. Single cell Sequencing services and Technologies Market Opportunity in Europe: Share of Diagnostics, Till 2030
- 12.8.2.3.2. Single cell Sequencing services and Technologies Market Opportunity in Europe: Share of Drug Discovery, Till 2030
- 12.8.2.3.3. Single cell Sequencing services and Technologies Market Opportunity in Europe: Share of Precision Medicine, Till 2030
- 12.8.2.3.4. Single cell Sequencing services and Technologies Market Opportunity in Europe: Share of Other Applications, Till 2030
- 12.8.2.1. Single cell Sequencing Services and Technologies Market Opportunity in Europe Across Key Market Segments, Till 2030
- 12.8.3. Single cell Sequencing Services and Technologies Market Opportunity in Asia-Pacific, Till 2030
- 12.8.3.1. Single cell Sequencing Services and Technologies Market Opportunity in Asia-Pacific Across Key Market Segments, Till 2030
- 12.8.3.1.1. Single cell Sequencing services and Technologies Market Opportunity in Asia-Pacific: Share of Service Providers, Till 2030
- 12.8.3.1.2. Single cell Sequencing services and Technologies Market Opportunity in Asia-Pacific: Share of Technology Providers, Till 2030
- 12.8.3.2. Single cell Sequencing Services and Technologies Market Opportunity in Asia-Pacific: Distribution by End-Users, Till 2030
- 12.8.3.2.1. Single cell Sequencing services and Technologies Market Opportunity in Asia-Pacific: Share of Academic and Research Institutions, Till 2030
- 12.8.3.2.2. Single cell Sequencing services and Technologies Market Opportunity in Asia-Pacific: Share of Pharmaceutical Companies, Till 2030
- 12.8.3.2.3. Single cell Sequencing services and Technologies Market Opportunity in Asia-Pacific: Share of Other End-Users, Till 2030
- 12.8.3.3. Single cell Sequencing Services and Technologies Market Opportunity in Asia-Pacific: Distribution by Area of Application, Till 2030
- 12.8.3.3.1. Single cell Sequencing services and Technologies Market Opportunity in Asia-Pacific: Share of Diagnostics, Till 2030
- 12.8.3.3.2. Single cell Sequencing services and Technologies Market Opportunity in Asia-Pacific: Share of Drug Discovery, Till 2030
- 12.8.3.3.3. Single cell Sequencing services and Technologies Market Opportunity in Asia-Pacific: Share of Precision Medicine, Till 2030
- 12.8.3.3.4. Single cell Sequencing services and Technologies Market Opportunity in Asia-Pacific: Share of Other Applications, Till 2030
- 12.8.3.1. Single cell Sequencing Services and Technologies Market Opportunity in Asia-Pacific Across Key Market Segments, Till 2030
- 12.8.4. Single cell Sequencing Services and Technologies Market Opportunity in Rest of the World, Till 2030
- 12.8.4.1. Single cell Sequencing Services and Technologies Market Opportunity in Rest of the World Across Key Market Segments, Till 2030
- 12.8.4.1.1. Single cell Sequencing services and Technologies Market Opportunity in Rest of the World: Share of Service Providers, Till 2030
- 12.8.4.1.2. Single cell Sequencing services and Technologies Market Opportunity in Rest of the World: Share of Technology Providers, Till 2030
- 12.8.4.2. Single cell Sequencing Services and Technologies Market Opportunity in Rest of the World: Distribution by End-Users, Till 2030
- 12.8.4.2.1. Single cell Sequencing services and Technologies Market Opportunity in Rest of the World: Share of Academic and Research Institutions, Till 2030
- 12.8.4.2.2. Single cell Sequencing services and Technologies Market Opportunity in Rest of the World: Share of Pharmaceutical Companies, Till 2030
- 12.8.4.2.3. Single cell Sequencing services and Technologies Market Opportunity in Rest of the World: Share of Other End-Users, Till 2030
- 12.8.4.3. Single cell Sequencing Services and Technologies Market Opportunity in Rest of the World: Distribution by Area of Application, Till 2030
- 12.8.4.3.1. Single cell Sequencing services and Technologies Market Opportunity in Rest of the World: Share of Diagnostics, Till 2030
- 12.8.4.3.2. Single cell Sequencing services and Technologies Market Opportunity in Rest of the World: Share of Drug Discovery, Till 2030
- 12.8.4.3.3. Single cell Sequencing services and Technologies Market Opportunity in Rest of the World: Share of Precision Medicine, Till 2030
- 12.8.4.3.4. Single cell Sequencing services and Technologies Market Opportunity in Rest of the World: Share of Other Applications, Till 2030
- 12.8.4.1. Single cell Sequencing Services and Technologies Market Opportunity in Rest of the World Across Key Market Segments, Till 2030
- 12.8.1. Single cell Sequencing Services and Technologies Market Opportunity in North America, Till 2030
13. CONCLUSION
- 13.1. Chapter Overview
- 13.2. Key Takeaways
14. EXECUTIVE INSIGHTS
15. APPENDIX I: TABULATED DATA
List of Tables
- Table 3.1 Comparison of Bulk RNA Sequencing and scRNA Sequencing
- Table 4.1 Single cell Sequencing Service Providers: List of Industry Players
- Table 4.2 Single cell Sequencing Service Providers (Industry Players): Information on Sequencing Method, Turn Around Time and Sample Used
- Table 4.3 Single cell Sequencing Service Providers (Industry Players): Information on Type of Service Offered, Library Preparation System Used and Sequencing System Used
- Table 4.4 Single cell Sequencing Providers: List of Non-Industry Players
- Table 4.5 Single cell Sequencing Service Providers (Non-Industry Players): Information on Sequencing Method Used, Turn Around Time and Price of Services
- Table 4.6 Single cell Sequencing Service Providers (Non-Industry Players): Information on Type of Service Offered, Library Preparation System Used and Sequencing System Used
- Table 4.7 Additional List of Companies
- Table 5.1 Single cell Sequencing Workflow Instruments: Information on Name of Developer, Target Nucleic Acid and System Throughput
- Table 5.2 Single cell Sequencing Workflow Instruments: Information on Type of Application and Analytical Software Used
- Table 5.3 List of Single cell Sequencing Workflow Instrument Providers
- Table 5.4 Single cell Sequencing Instruments: Information on Type of Application, Run Time, Maximum Output and Output Range
- Table 5.5 Single cell Sequencing Instruments: Information on Maximum Reads per Run, Reads per Run, Maximum Read Length, Maximum Quality Score, Sequencing Chemistry and Cost of Instrument
- Table 5.6 List of Single cell Sequencing Instrument Providers
- Table 7.1 Single cell Sequencing Service Providers: List of Profiled Companies
- Table 7.2 Active Motif: Company Snapshot
- Table 7.3 Admera Health: Company Snapshot
- Table 7.4 Admera Health: Recent Developments and Future Outlook
- Table 7.5 Annoroad Genomics: Company Snapshot
- Table 7.6 Annoroad Genomics: Recent Developments and Future Outlook
- Table 7.7 BGI Genomics: Company Snapshot
- Table 7.8 BGI Genomics: Recent Developments and Future Outlook
- Table 7.9 CD Genomics: Company Snapshot
- Table 7.10 CD Genomics: Recent Developments and Future Outlook
- Table 7.11 MedGenome: Company Snapshot
- Table 7.12 MedGenome: Recent Developments and Future Outlook
- Table 7.13 Quick Biology: Company Snapshot
- Table 7.14 Quick Biology: Recent Developments and Future Outlook
- Table 7.15 SingulOmics: Company Snapshot
- Table 8.1 10x Genomics: Company Snapshot
- Table 8.2 10x Genomics: Recent Developments and Future Outlook
- Table 8.3 Cell Microsystems: Company Snapshot
- Table 8.4 Fluidigm: Company Snapshot
- Table 8.5 Fluidigm: Recent Developments and Future Outlook
- Table 8.6 Illumina: Company Snapshot
- Table 8.7 Illumina: Recent Developments and Future Outlook
- Table 8.8 Mission Bio: Company Snapshot
- Table 8.9 Mission Bio: Recent Developments and Future Outlook
- Table 8.10 Oxford Nanopore Technologies: Company Snapshot
- Table 8.11 Oxford Nanopore Technologies: Recent Developments and Future Outlook
- Table 9.1 Patent Analysis: CPC Symbols
- Table 9.2 Patent Analysis: Most Popular CPC Symbols
- Table 9.3 Patent Analysis: List of Top 10 CPC Symbols
- Table 9.4 Patent Analysis: Categorization based on Weighted Valuation Scores
- Table 9.5 Patent Analysis: List of Relatively Higher Value Patents
- Table 15.1 Single cell Sequencing Service Providers (Industry Players): Distribution by Year of Establishment
- Table 15.2 Single cell Sequencing Service Providers (Industry Players): Distribution by Company Size
- Table 15.3 Single cell Sequencing Service Providers (Industry Players): Distribution by Location of Headquarters
- Table 15.4 Single cell Sequencing Service Providers (Industry Players): Distribution by Sequencing Method Used
- Table 15.5 Single cell Sequencing Service Providers (Industry Players): Distribution by Type of Service Offered
- Table 15.6 Single cell Sequencing Service Providers (Industry Players): Distribution by Type of Library Preparation System Used
- Table 15.7 Single cell Sequencing Service Providers (Industry Players): Distribution by Type of Sequencing System Used
- Table 15.8 Single cell Sequencing Service Providers (Non-Industry Players): Distribution by Location of Organization
- Table 15.9 Single cell Sequencing Service Providers (Non-Industry Players): Distribution by Sequencing Method Used
- Table 15.10 Single cell Sequencing Service Providers (Non-Industry Players): Distribution by Types of Service Offered
- Table 15.11 Single cell Sequencing Service Providers (Non-Industry Players): Distribution by Type of Library Preparation System Used
- Table 15.12 Single cell Sequencing Service Providers (Non-Industry Players): Distribution by Type of Sequencing System Used
- Table 15.13 Single cell Sequencing Workflow Instruments: Distribution by Target Nucleic Acid
- Table 15.14 Single cell Sequencing Workflow Instruments: Distribution by Type of Application
- Table 15.15 Single cell Sequencing Workflow Instruments: Distribution by Throughput
- Table 15.16 Single cell Sequencing Workflow Instrument Providers: Distribution by Year of Establishment
- Table 15.17 Single cell Sequencing Workflow Instrument Providers: Distribution by Company Size
- Table 15.18 Single cell Sequencing Workflow Instrument Providers: Distribution by Location of Headquarters
- Table 15.19 Single cell Sequencing Instruments: Distribution by Type of Application
- Table 15.20 Single cell Sequencing Instruments: Distribution by Maximum Output
- Table 15.21 Single cell Sequencing Instruments: Distribution by Maximum Read Length
- Table 15.22 Single cell Sequencing Instruments: Distribution by System Efficiency
- Table 15.23 Single cell Sequencing Instruments: Distribution by Sequencing Chemistry
- Table 15.24 Single cell Sequencing Instrument Providers: Distribution by Year of Establishment
- Table 15.25 Single cell Sequencing Instrument Providers: Distribution by Company Size
- Table 15.26 Single cell Sequencing Instrument Providers: Distribution by Location of Headquarters
- Table 15.27 10x Genomics: Annual Revenues, Since 2017 (USD Million)
- Table 15.28 Fluidigm: Annual Revenues, Since 2015 (USD Million)
- Table 15.29 Illumina: Annual Revenues, Since 2013 (USD Billion)
- Table 15.30 Patent Analysis: Distribution by Patent Type
- Table 15.31 Patent Analysis: Cumulative Distribution by Publication Year, Since 2015
- Table 15.32 Patent Analysis: Distribution by Geographical Location and Publication Year Since 2015
- Table 15.33 Patent Analysis: Distribution by Patent Type and Publication Year
- Table 15.34 Patent Analysis: Distribution by Geographical Location
- Table 15.35 Patent Analysis: Distribution by Jurisdiction
- Table 15.36 Patent Analysis: Cumulative Year-wise Distribution by Type of Applicant Since 2015
- Table 15.37 Leading Players: Distribution by Number of Patents
- Table 15.38 Patent Analysis: Distribution of Patents by Geographical Region and Patent Type
- Table 15.39 Single cell Sequencing: Age of Patents
- Table 15.40 Academic Grant Analysis: Cumulative Year-wise Trend, Since 2016
- Table 15.41 Academic Grant Analysis: Cumulative Year-Wise Distribution by Grant Amount (USD Million)
- Table 15.42 Academic Grant Analysis: Distribution by Activity Codes
- Table 15.43 Academic Grant Analysis: Distribution by Support Period
- Table 15.44 Academic Grant Analysis: Distribution by Funding Mechanism
- Table 15.45 Academic Grant Analysis: Distribution by Type of Recipient Organization
- Table 15.46 Popular Recipient Organizations: Distribution by Number of Grants
- Table 15.47 Popular Recipient Organizations: Distribution by Amount Awarded (USD Million)
- Table 15.48 Prominent Program Officers: Distribution by Number of Grants
- Table 15.49 Recent Partnerships: Distribution by Year of Partnership
- Table 15.50 Recent Partnerships: Distribution by Type of Agreement
- Table 15.51 Recent Partnerships: Distribution by Focus Area of Partnership
- Table 15.52 Recent Partnerships: Regional Distribution
- Table 15.53 Recent Investments: Distribution by Year of Funding
- Table 15.54 Recent Investments: Distribution by Type of Funding
- Table 15.55 Recent Investments: Distribution by Amount Invested (USD Million)
- Table 15.56 Most Active Players: Distribution by Amount Invested
- Table 15.57 Most Active Investors: Distribution by Number of Funding Instances
- Table 15.58 Recent Product Launches: Distribution by Year of Product Launch
- Table 15.59 Recent Product Launches: Distribution by Type of Product
- Table 15.60 Recent Product Launches: Distribution by Focus Area
- Table 15.61 Most Active Players: Distribution by Number of Product Launches
- Table 15.62 Overall Single cell Sequencing Services and Technologies Market Opportunity, Conservative, Base and Optimistic Scenario, Till 2030 (USD Million)
- Table 15.63 Single cell Sequencing Services and Technologies Market Opportunity Across Key Market Segments (USD Million)
- Table 15.64 Single cell Sequencing Services and Technologies Market Opportunity: Distribution by Type of System (USD Million)
- Table 15.65 Single cell Sequencing Services and Technologies Market Opportunity: Distribution by End-User (USD Million)
- Table 15.66 Single cell Sequencing Services and Technologies Market Opportunity: Distribution by Area of Application (USD Million)
- Table 15.67 Single cell Sequencing Services and Technologies Market Opportunity: Geographical Distribution (USD Million)
- Table 15.68 Single cell Sequencing Services and Technologies Market Opportunity in North America, Conservative, Base and Optimistic Scenario, Till 2030 (USD Million)
- Table 15.69 Single cell Sequencing services and Technologies Market Opportunity in North America: Share of Service Providers, Till 2030 (USD Million)
- Table 15.70 Single cell Sequencing services and Technologies Market Opportunity in North America: Share of Technology Providers, Till 2030 (USD Million)
- Table 15.71 Single cell Sequencing services and Technologies Market Opportunity in North America: Share of Academic and Research Institutions, Till 2030 (USD Million)
- Table 15.72 Single cell Sequencing services and Technologies Market Opportunity in North America: Share of Pharmaceutical Companies, Till 2030 (USD Million)
- Table 15.73 Single cell Sequencing services and Technologies Market Opportunity in North America: Share of Other End-Users, Till 2030 (USD Million)
- Table 15.74 Single cell Sequencing services and Technologies Market Opportunity in North America: Share of Diagnostics, Till 2030 (USD Million)
- Table 15.75 Single cell Sequencing services and Technologies Market Opportunity in North America: Share of Drug Discovery, Till 2030 (USD Million)
- Table 15.76 Single cell Sequencing services and Technologies Market Opportunity in North America: Share of Precision Medicine, Till 2030 (USD Million)
- Table 15.77 Single cell Sequencing services and Technologies Market Opportunity in North America: Share of Other Applications, Till 2030 (USD Million)
- Table 15.78 Single cell Sequencing Services and Technologies Market Opportunity in Europe, Conservative, Base and Optimistic Scenario, Till 2030 (USD Million)
- Table 15.79 Single cell Sequencing services and Technologies Market Opportunity in Europe: Share of Service Providers, Till 2030 (USD Million)
- Table 15.80 Single cell Sequencing services and Technologies Market Opportunity in Europe: Share of Technology Providers, Till 2030 (USD Million)
- Table 15.81 Single cell Sequencing services and Technologies Market Opportunity in Europe: Share of Academic and Research Institutions, Till 2030 (USD Million)
- Table 15.82 Single cell Sequencing services and Technologies Market Opportunity in Europe: Share of Pharmaceutical Companies, Till 2030 (USD Million)
- Table 15.83 Single cell Sequencing services and Technologies Market Opportunity in Europe: Share of Other End-Users, Till 2030 (USD Million)
- Table 15.84 Single cell Sequencing services and Technologies Market Opportunity in Europe: Share of Diagnostics, Till 2030 (USD Million)
- Table 15.85 Single cell Sequencing services and Technologies Market Opportunity in Europe: Share of Drug Discovery, Till 2030 (USD Million)
- Table 15.86 Single cell Sequencing services and Technologies Market Opportunity in Europe: Share of Precision Medicine, Till 2030 (USD Million)
- Table 15.87 Single cell Sequencing services and Technologies Market Opportunity in Europe: Share of Other Applications, Till 2030 (USD Million)
- Table 15.88 Single cell Sequencing Services and Technologies Market Opportunity in Asia-Pacific, Conservative, Base and Optimistic Scenario, Till 2030 (USD Million)
- Table 15.89 Single cell Sequencing services and Technologies Market Opportunity in Asia-Pacific: Share of Service Providers, Till 2030 (USD Million)
- Table 15.90 Single cell Sequencing services and Technologies Market Opportunity in Asia-Pacific: Share of Technology Providers, Till 2030 (USD Million)
- Table 15.91 Single cell Sequencing services and Technologies Market Opportunity in Asia-Pacific: Share of Academic and Research Institutions, Till 2030 (USD Million)
- Table 15.92 Single cell Sequencing services and Technologies Market Opportunity in Asia-Pacific: Share of Pharmaceutical Companies, Till 2030 (USD Million)
- Table 15.93 Single cell Sequencing services and Technologies Market Opportunity in Asia-Pacific: Share of Other End-Users, Till 2030 (USD Million)
- Table 15.94 Single cell Sequencing services and Technologies Market Opportunity in Asia-Pacific: Share of Diagnostics, Till 2030 (USD Million)
- Table 15.95 Single cell Sequencing services and Technologies Market Opportunity in Asia-Pacific: Share of Drug Discovery, Till 2030 (USD Million)
- Table 15.96 Single cell Sequencing services and Technologies Market Opportunity in Asia-Pacific: Share of Precision Medicine, Till 2030 (USD Million)
- Table 15.97 Single cell Sequencing services and Technologies Market Opportunity in Asia-Pacific: Share of Other Applications, Till 2030 (USD Million)
- Table 15.98 Single cell Sequencing Services and Technologies Market Opportunity in Rest of the World, Conservative, Base and Optimistic Scenario, Till 2030 (USD Million)
- Table 15.99 Single cell Sequencing services and Technologies Market Opportunity in Rest of the World: Share of Service Providers, Till 2030 (USD Million)
- Table 15.100 Single cell Sequencing services and Technologies Market Opportunity in Rest of the World: Share of Technology Providers, Till 2030 (USD Million)
- Table 15.101 Single cell Sequencing services and Technologies Market Opportunity in Rest of the World: Share of Academic and Research Institutions, Till 2030 (USD Million)
- Table 15.102 Single cell Sequencing services and Technologies Market Opportunity in Rest of the World: Share of Pharmaceutical Companies, Till 2030 (USD Million)
- Table 15.103 Single cell Sequencing services and Technologies Market Opportunity in Rest of the World: Share of Other End-Users, Till 2030 (USD Million)
- Table 15.104 Single cell Sequencing services and Technologies Market Opportunity in Rest of the World: Share of Diagnostics, Till 2030 (USD Million)
- Table 15.105 Single cell Sequencing services and Technologies Market Opportunity in Rest of the World: Share of Drug Discovery, Till 2030 (USD Million)
- Table 15.106 Single cell Sequencing services and Technologies Market Opportunity in Rest of the World: Share of Precision Medicine, Till 2030 (USD Million)
- Table 15.107 Single cell Sequencing services and Technologies Market Opportunity in Rest of the World: Share of Other Applications, Till 2030 (USD Million)
List of Figures
- Figure 3.1 Process of Single cell Sequencing
- Figure 3.2 Bulk RNA Sequencing versus scRNA Sequencing
- Figure 3.3 Applications of Single cell Sequencing
- Figure 3.4 Challenges Associated with Single cell Sequencing
- Figure 4.1 Single cell Sequencing Service Providers (Industry Players): Distribution by Year of Establishment
- Figure 4.2 Single cell Sequencing Service Providers (Industry Players): Distribution by Company Size
- Figure 4.3 Single cell Sequencing Service Providers (Industry Players): Distribution by Location of Headquarters
- Figure 4.4 Single cell Sequencing Service Providers (Industry Players): Distribution by Sequencing Method Used
- Figure 4.5 Single cell Sequencing Service Providers (Industry Players): Distribution by Type of Service Offered
- Figure 4.6 Single cell Sequencing Service Providers (Industry Players): Distribution by Type of Library Preparation System Used
- Figure 4.7 Single cell Sequencing Service Providers (Industry Players): Distribution by Type of Sequencing System Used
- Figure 4.8 Single cell Sequencing Service Providers (Non-Industry Players): Distribution by Location of Organization
- Figure 4.9 Single cell Sequencing Service Providers (Non-Industry Players): Distribution by Sequencing Method Used
- Figure 4.10 Single cell Sequencing Service Providers (Non-Industry Players): Distribution by Type of Service Offered
- Figure 4.11 Single cell Sequencing Service Providers (Non-Industry Players): Distribution by Type of Library Preparation System Used
- Figure 4.12 Single cell Sequencing Service Providers (Non-Industry Players): Distribution by Type of Sequencing System Used
- Figure 5.1 Single cell Sequencing Workflow Instruments: Distribution by Targeted Nucleic Acid
- Figure 5.2 Single cell Sequencing Workflow Instruments: Distribution by Type of Application
- Figure 5.3 Single cell Sequencing Workflow Instruments: Distribution by Throughput
- Figure 5.4 Single cell Sequencing Workflow Instrument Providers: Distribution by Year of Establishment
- Figure 5.5 Single cell Sequencing Workflow Instrument Providers: Distribution by Company Size
- Figure 5.6 Single cell Sequencing Workflow Instrument Providers: Distribution by Location of Headquarters
- Figure 5.7 Single cell Sequencing Instruments: Distribution by Type of Application
- Figure 5.8 Single cell Sequencing Instruments: Distribution by Maximum Output
- Figure 5.9 Single cell Sequencing Instruments: Distribution by Maximum Read Length
- Figure 5.10 Single cell Sequencing Instruments: Distribution by System Efficiency
- Figure 5.11 Single cell Sequencing Instruments: Distribution by Sequencing Chemistry
- Figure 5.12 Single cell Sequencing Instrument Providers: Distribution by Year of Establishment
- Figure 5.13 Single cell Sequencing Instrument Providers: Distribution by Company Size
- Figure 5.14 Single cell Sequencing Instrument Providers: Distribution by Location of Headquarters
- Figure 6.1 Platform Competitiveness Analysis: Single cell Workflow Instruments (Peer Group I)
- Figure 6.2 Platform Competitiveness Analysis: Single cell Workflow Instruments (Peer Group II)
- Figure 6.3 Platform Competitiveness Analysis: Single cell Sequencing Instruments (Peer Group I)
- Figure 6.4 Platform Competitiveness Analysis: Single cell Sequencing Instruments (Peer Group II)
- Figure 8.1 10x Genomics: Annual Revenues, Since 2017 (USD Million)
- Figure 8.2 Fluidigm: Annual Revenues, Since 2015 (USD Million)
- Figure 8.3 Illumina: Annual Revenues, Since 2013 (USD Billion)
- Figure 8.4 Illumina: Sequencing Systems Portfolio
- Figure 8.5 Oxford Nanopore Technologies: Sequencing Systems Portfolio
- Figure 9.1 Patent Analysis: Distribution by Patent Type
- Figure 9.2 Patent Analysis: Cumulative Distribution by Publication Year, Since 2015
- Figure 9.3 Patent Analysis: Distribution by Geographical Location and Publication Year Since 2015
- Figure 9.4 Patent Analysis: Distribution by Patent Type and Publication Year
- Figure 9.5 Patent Analysis: Distribution by Geographical Location
- Figure 9.6 Patent Analysis: Distribution by Jurisdiction
- Figure 9.7 Patent Analysis: Distribution by CPC Symbols
- Figure 9.8 Patent Analysis: Emerging Focus Areas
- Figure 9.9 Patent Analysis: Cumulative Year-wise Distribution by Type of Applicant Since 2015
- Figure 9.10 Leading Players: Distribution by Number of Patents
- Figure 9.11 Patent Analysis (Leading Players): Benchmarking by Patent Characteristics (CPC Classifications)
- Figure 9.12 Patent Analysis: Benchmarking by International Patents
- Figure 9.13 Patent Analysis: Distribution of Patents by Geographical Region and Patent Type
- Figure 9.14 Single cell Sequencing: Age of Patents
- Figure 9.15 Patent Analysis: Valuation Analysis
- Figure 10.1 Academic Grant Analysis: Cumulative Year-wise Trend, Since 2016
- Figure 10.2 Academic Grant Analysis: Cumulative Year-Wise Distribution by Grant Amount (USD Million)
- Figure 10.3 Academic Grant Analysis: Distribution by Focus Area
- Figure 10.4 Academic Grant Analysis: Distribution by Activity Code
- Figure 10.5 Academic Grant Analysis: Distribution by Support Period
- Figure 10.6 Academic Grant Analysis: Distribution by Funding Mechanism
- Figure 10.7 Academic Grant Analysis: Distribution of Funding Institute Center by Support Year and Number of Grants
- Figure 10.8 Academic Grant Analysis: Distribution by Type of Recipient Organization
- Figure 10.9 Popular Recipient Organizations: Distribution across States in the US
- Figure 10.10 Popular Recipient Organizations: Distribution by Number of Grants
- Figure 10.11 Popular Recipient Organizations: Distribution by Amount Awarded (USD Million)
- Figure 10.12 Prominent Program Officers: Distribution by Number of Grants
- Figure 11.1 Recent Partnerships: Distribution by Year of Partnership
- Figure 11.2 Recent Partnerships: Distribution by Type of Agreement
- Figure 11.3 Recent Partnerships: Distribution by Focus Area of Partnership
- Figure 11.4 Recent Partnerships: Regional Distribution
- Figure 11.5 Recent Investments: Distribution by Year of Funding
- Figure 11.6 Recent Investments: Distribution by Type of Funding
- Figure 11.7 Recent Investments: Distribution by Amount Invested (USD Million)
- Figure 11.8 Most Active Players: Distribution by Amount Invested
- Figure 11.9 Most Active Investors: Distribution by Number of Funding Instances
- Figure 11.10 Recent Product Launches: Distribution by Year of Product Launch
- Figure 11.11 Recent Product Launches: Distribution by Type of Product
- Figure 11.12 Recent Product Launches: Distribution by Focus Area
- Figure 11.13 Most Active Players: Distribution by Number of Product Launches
- Figure 12.1 Overall Single cell Sequencing Services and Technologies Market Opportunity, Till 2030 (USD Million)
- Figure 12.2 Single cell Sequencing Services and Technologies Market Opportunity Across Key Market Segments (USD Million)
- Figure 12.3 Single cell Sequencing Services and Technologies Market Opportunity: Distribution by Type of System (USD Million)
- Figure 12.4 Single cell Sequencing Services and Technologies Market Opportunity: Distribution by End-User (USD Million)
- Figure 12.5 Single cell Sequencing Services and Technologies Market Opportunity: Distribution by Area of Application (USD Million)
- Figure 12.6 Single cell Sequencing Services and Technologies Market Opportunity: Geographical Distribution (USD Million)
- Figure 12.7 Single cell Sequencing Services and Technologies Market Opportunity in North America, Till 2030 (USD Million)
- Figure 12.8 Single cell Sequencing Services and Technologies Market Opportunity in North America: Share of Service Providers, Till 2030 (USD Million)
- Figure 12.9 Single cell Sequencing Services and Technologies Market Opportunity in North America: Share of Technology Providers, Till 2030 (USD Million)
- Figure 12.10 Single cell Sequencing Services and Technologies Market Opportunity in North America: Share of Academic and Research Institutions, Till 2030 (USD Million)
- Figure 12.11 Single cell Sequencing Services and Technologies Market Opportunity in North America: Share of Pharmaceutical Companies, Till 2030 (USD Million)
- Figure 12.12 Single cell Sequencing Services and Technologies Market Opportunity in North America: Share of Other End-Users, Till 2030 (USD Million)
- Figure 12.13 Single cell Sequencing Services and Technologies Market Opportunity in North America: Share of Diagnostics, Till 2030 (USD Million)
- Figure 12.14 Single cell Sequencing Services and Technologies Market Opportunity in North America: Share of Drug Discovery, Till 2030 (USD Million)
- Figure 12.15 Single cell Sequencing Services and Technologies Market Opportunity in North America: Share of Precision Medicine, Till 2030 (USD Million)
- Figure 12.16 Single cell Sequencing Services and Technologies Market Opportunity in North America: Share of Other Applications, Till 2030 (USD Million)
- Figure 12.17 Single cell Sequencing Services and Technologies Market Opportunity in Europe, Till 2030 (USD Million)
- Figure 12.18 Single cell Sequencing Services and Technologies Market Opportunity in Europe: Share of Service Providers, Till 2030 (USD Million)
- Figure 12.19 Single cell Sequencing Services and Technologies Market Opportunity in Europe: Share of Technology Providers, Till 2030 (USD Million)
- Figure 12.20 Single cell Sequencing Services and Technologies Market Opportunity in Europe: Share of Academic and Research Institutions, Till 2030 (USD Million)
- Figure 12.21 Single cell Sequencing Services and Technologies Market Opportunity in Europe: Share of Pharmaceutical Companies, Till 2030 (USD Million)
- Figure 12.22 Single cell Sequencing Services and Technologies Market Opportunity in Europe: Share of Other End-Users, Till 2030 (USD Million)
- Figure 12.23 Single cell Sequencing Services and Technologies Market Opportunity in Europe: Share of Diagnostics, Till 2030 (USD Million)
- Figure 12.24 Single cell Sequencing Services and Technologies Market Opportunity in Europe: Share of Drug Discovery, Till 2030 (USD Million)
- Figure 12.25 Single cell Sequencing Services and Technologies Market Opportunity in Europe: Share of Precision Medicine, Till 2030 (USD Million)
- Figure 12.26 Single cell Sequencing Services and Technologies Market Opportunity in Europe: Share of Other Applications, Till 2030 (USD Million)
- Figure 12.27 Single cell Sequencing Services and Technologies Market Opportunity in Asia-Pacific, Till 2030 (USD Million)
- Figure 12.28 Single cell Sequencing services and Technologies Market Opportunity in Asia-Pacific: Share of Service Providers, Till 2030 (USD Million)
- Figure 12.29 Single cell Sequencing services and Technologies Market Opportunity in Asia-Pacific: Share of Technology Providers, Till 2030 (USD Million)
- Figure 12.30 Single cell Sequencing services and Technologies Market Opportunity in Asia-Pacific: Share of Academic and Research Institutions, Till 2030 (USD Million)
- Figure 12.31 Single cell Sequencing Services and Technologies Market Opportunity in Asia-Pacific: Share of Pharmaceutical Companies, Till 2030 (USD Million)
- Figure 12.32 Single cell Sequencing Services and Technologies Market Opportunity in Asia-Pacific: Share of Other End-Users, Till 2030 (USD Million)
- Figure 12.33 Single cell Sequencing Services and Technologies Market Opportunity in Asia-Pacific: Share of Diagnostics, Till 2030 (USD Million)
- Figure 12.34 Single cell Sequencing Services and Technologies Market Opportunity in Asia-Pacific: Share of Drug Discovery, Till 2030 (USD Million)
- Figure 12.35 Single cell Sequencing Services and Technologies Market Opportunity in Asia-Pacific: Share of Precision Medicine, Till 2030 (USD Million)
- Figure 12.36 Single cell Sequencing Services and Technologies Market Opportunity in Asia-Pacific: Share of Other Applications, Till 2030 (USD Million)
- Figure 12.37 Single cell Sequencing Services and Technologies Market Opportunity in Rest of the World, Till 2030 (USD Million)
- Figure 12.38 Single cell Sequencing Services and Technologies Market Opportunity in Rest of the World: Share of Service Providers, Till 2030 (USD Million)
- Figure 12.39 Single cell Sequencing Services and Technologies Market Opportunity in Rest of the World: Share of Technology Providers, Till 2030 (USD Million)
- Figure 12.40 Single cell Sequencing Services and Technologies Market Opportunity in Rest of the World: Share of Academic and Research Institutions, Till 2030 (USD Million)
- Figure 12.41 Single cell Sequencing Services and Technologies Market Opportunity in Rest of the World: Share of Pharmaceutical Companies, Till 2030 (USD Million)
- Figure 12.42 Single cell Sequencing Services and Technologies Market Opportunity in Rest of the World: Share of Other End-Users, Till 2030 (USD Million)
- Figure 12.43 Single cell Sequencing Services and Technologies Market Opportunity in Rest of the World: Share of Diagnostics, Till 2030 (USD Million)
- Figure 12.44 Single cell Sequencing Services and Technologies Market Opportunity in Rest of the World: Share of Drug Discovery, Till 2030 (USD Million)
- Figure 12.45 Single cell Sequencing Services and Technologies Market Opportunity in Rest of the World: Share of Precision Medicine, Till 2030 (USD Million)
- Figure 12.46 Single cell Sequencing Services and Technologies Market Opportunity in Rest of the World: Share of Other Applications, Till 2030 (USD Million)


