


 |
市場調查報告書
商品編碼
1891240
抗體藥物偶聯物 (ADC) 合約生產市場(第七版):依研發階段、製程組件、有效載荷、抗體同型、標靶適應症、抗體來源、連接子和主要地區劃分——產業趨勢及全球預測至 2035 年ADC Contract Manufacturing Market (7th Edition): Distribution by Stage of Development, Process Component, Payload, Antibody Isotype, Target Indication, Antibody Origin, Linker, and Key Geographical Regions - Industry Trends and Forecast 2025-2035 |
||||||
ADC 合約生產市場:概述
預計 ADC 合約生產市場將從 2025 年的 17.2 億美元成長到 2035 年的 32.12 億美元,2025 年至 2035 年的複合年增長率 (CAGR) 為 6.4%。
業務規模
- 臨床規模
- 商業規模
製程組件
- 微管蛋白抑制劑
- 拓樸異構酶抑制劑
- DNA 損傷劑
- 其他
有效載荷類型
- 微管蛋白抑制劑
- 拓樸異構酶抑制劑
- DNA損傷劑
- 其他
抗體同工型
- IgG1
- IgG4
- 其他
標靶適應症
- 實體瘤
- 血液系統惡性腫瘤
連接子類型
- 纈氨酸-瓜氨酸連接子
- SMCC連接子
- 腙連接子
- 馬來酰亞胺連接子
- 馬來酰亞胺己酰連接子
- 四肽連接子
- 勝肽連接子
- 其他
抗體起始點
- 人形化
- 嵌合體
- 人類
- 其他
主要地區
- 北美洲
- 美國
- 加拿大
- 其他北美洲國家
- 歐洲
- 英國
- 西班牙
- 義大利
- 德國
- 法國
- 其他歐洲國家
- 亞太及其他地區
- 中國
- 日本
- 印度
- 韓國
- 澳大利亞
- 阿根廷
- 巴西
- 智利
- 哥倫比亞
- 以色列
- 肯亞
- 秘魯
- 南非
- 土耳其
- 沙烏地阿拉伯
- 其他地區全球
ADC 合約生產市場:成長與趨勢
近年來,抗體藥物偶聯物 (ADC) 在治療包括實體腫瘤和血液系統惡性腫瘤在內的多種癌症方面展現出巨大的潛力。這些複雜的分子由抗體透過化學偶聯物與具有生物活性的細胞毒性藥物連接而成,已證實具有更高的穩定性、靶向特異性、腫瘤選擇性和藥物動力學特性。
目前,ADC 研發管線包含超過 614 種正在進行臨床試驗的候選藥物,以及 28 個已獲得監管機構批准的 ADC 治療計畫。 ADC 的生產流程需要專業知識和先進技術的應用,這兩者都成本高昂。因此,ADC 開發商更傾向於將生產業務外包給 ADC 合約生產商 (CMO)。利用這些 CMO 的專業知識、資源和生產設施,開發商可以降低成本並縮短研發週期。受抗體偶聯藥物 (ADC) 需求不斷增長以及藥物研發外包趨勢日益盛行的推動,ADC 合約生產市場預計將在預測期內顯著增長。
ADC 合約生產市場:關鍵洞察
本報告深入分析了 ADC 合約生產市場的現狀,並指出了該行業潛在的成長機會。主要發現包括:
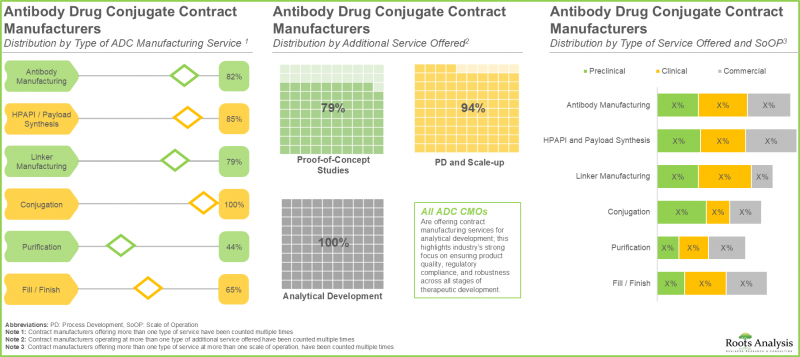
- 在當前市場格局中,全球約有 35 家公司聲稱具備提供抗體藥物偶聯物 (ADC) 合約生產和偶聯服務的必要能力。
- 大多數製造商(約佔 65%)提供各種規模的業務服務,提供一站式服務,幫助客戶解決技術難題,例如技術轉移和規模化生產。
- 各利害關係人正積極提升現有能力,以增強自身產品組合,並在 ADC 合約製造領域獲得相對於其他公司的競爭優勢。
- 產業參與者已投入大量精力加強基礎設施建設並拓展服務範圍,其中大部分措施是在過去 12 個月內實施的。
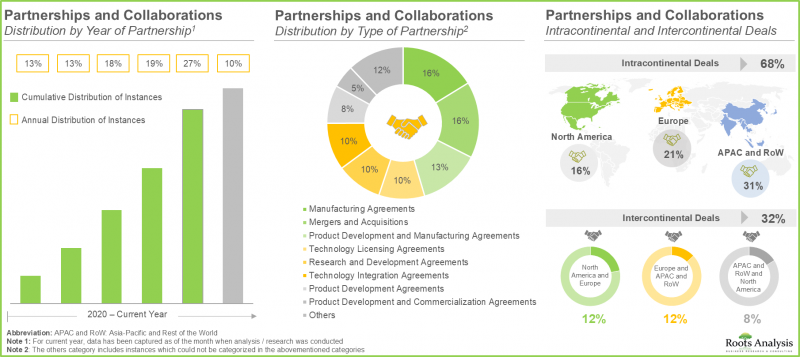
- 近年來,各利益相關者簽署的合作協議數量不斷增加,也反映出市場對該領域的日益增長的興趣。事實上,約 60% 的交易是在過去三年內簽署的。
- 迄今為止,已有超過 780 項評估各種抗體藥物偶聯物 (ADC) 安全性和有效性的臨床試驗入組,其中大部分研究在美國各地的醫療機構進行。
- 預計 ADC 療法開發商將與合約生產服務提供者建立策略聯盟,以外包複雜的生產流程。
- ADC 的開發需要選擇抗體、連接子和細胞毒性有效載荷,以靶向細胞內化的高表達腫瘤抗原。
- 值得注意的是,超過 30% 的產能擴張計畫由北美公司實施,這反映了該地區在先進 ADC 生產基礎設施方面的領先地位。
- 全球抗體藥物偶聯物 (ADC) 的生產能力分佈廣泛,遍佈各地區。值得注意的是,約 90% 的總產能集中在大型公司擁有的工廠。
- 隨著多個臨床候選藥物預計將在各個地區商業化,對 ADC 療法的需求可能會顯著增長。
- 在不斷擴大的 ADC 治療產品線和合約服務提供者的生產技術驅動下,ADC 合約生產市場預計未來將顯著成長。
- 目前,歐洲佔市場主導地位(45%),是 ADC 合約生產市場中佔有率最大的地區,其次是北美。
- 由於其高安全性和低免疫原性,預計人源化抗體藥物偶聯物(ADC)細分市場今年將佔大部分市場佔有率。
- 預計到2035年,北美ADC合約生產市場將佔最大佔有率。此外,該領域約85%的公司提供抗體生產服務。
ADC合約生產市場:主要細分市場
商業規模生產佔ADC合約生產市場最大佔有率
就營運規模而言,ADC合約生產市場可細分為臨床和商業等不同規模。目前,由於市場對ADC作為強效標靶癌症療法的需求不斷增長,商業規模細分市場佔了更大的市場佔有率(約90%)。預計在預測期內,臨床階段細分市場將以較高的複合年增長率(7.6%)成長。這是由於2021年後監管機構批准了大量ADC候選藥物。 ADC療法的進展正促使越來越多的ADC進入臨床開發階段。
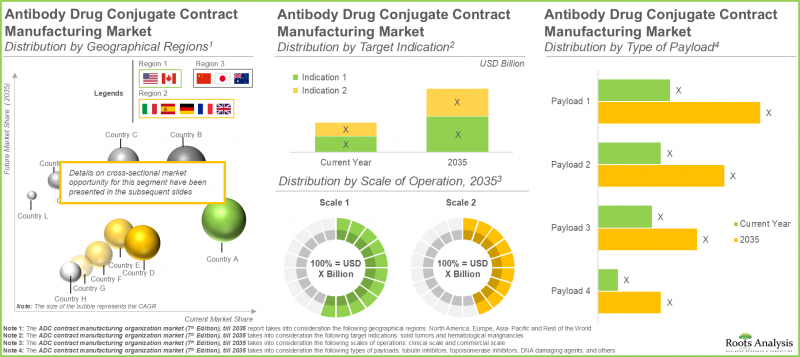
預計實體腫瘤領域將佔ADC合約生產市場最大的收入佔有率。
今年,實體瘤領域預計將佔ADC合約生產市場的大部分佔有率(80%),而這一趨勢預計將持續。這種主導地位源自於大多數市售ADC療法和目前正在進行臨床試驗的療法都專注於實體腫瘤。預計血液腫瘤市場在預測期內將以8.7%的複合年增長率成長。
預計未來抗體將佔ADC合約生產市場最大的佔有率。
今年,抗體領域佔了整個市場最大的佔有率,而這一趨勢預計將在整個預測期內持續。抗體的高佔比源自於複雜的細胞或蛋白質工程要求,這使得抗體生產成為一個耗時且成本高昂的過程。因此,需要更專業的抗體生產技術。
亞太地區預計將引領抗體藥物偶聯物(ADC)合約生產市場。
預計亞太地區及世界其他地區的市場在預測期內將以相對較高的複合年增長率(8.5%)增長。這主要得益於該地區,尤其是中國和印度等國家所具有的顯著成本優勢。與北美和歐洲的傳統生產地相比,這些國家擁有更低的勞動力成本和營運成本,從而提供了更有利的生產環境。總部位於亞太地區的ADC合約生產公司包括Shilpa Biologics、藥明生物、台塑製藥、Syngene和三星生物。
ADC 合約生產市場代表性公司
- 艾伯維合約生產
- Abzena
- CARBOGEN AMCIS
- Catalent Pharma Solutions
- Cerbios-Pharma
- MabPlex
- Millipore Sigma
- Lonza
- 藥明生物
ADC 合約生產市場:研究範圍
- 市場規模和機會分析:本報告對 ADC 合約生產市場進行了詳細分析,重點關注以下關鍵市場細分:[A] 研發階段,[B] 製程組成,[C] 有效載荷類型,[D] 抗體亞型,[E] 靶向適應症,[F] 抗體來源,[G] 連接子類型,以及 [H] 主要地區。
- 市場概況:基於以下相關參數,對參與ADC合約製造的關鍵公司進行全面評估:[A] 成立年份,[B] 公司規模,[C] 總部所在地,[D] 提供的ADC製造服務類型,[E] 提供的附加服務類型,[F] 製造工廠規模,[G] 製造工廠所在地。
- 公司簡介:詳細介紹總部位於北美、歐洲和亞太地區的ADC製造公司。主要內容包括:[A] 公司概況,[B] ADC合約製造產品組合,[C] 近期發展,以及[D] 未來展望。
- 公司競爭力分析:對ADC合約製造公司進行全面的競爭分析。檢視以下因素:[A] 供應商實力,[B] 服務實力,以及[C] 製造工廠數量。
- 合作夥伴關係與合作:ADC 合約製造市場利害關係人的合作夥伴關係狀況分析,分析維度包括:[A] 合作夥伴關係成立年份,[B] 合作夥伴關係形式,[C] 合作夥伴關係年份和形式,[D] 合作活動等的地理分佈
- 近期擴張趨勢:基於以下相關參數,詳細分析各抗體藥物偶聯物 (ADC) 合約生產商的近期擴張趨勢:基於以下相關參數,詳細分析各抗體藥物偶聯物 (ADC) 合約生產商的近期擴張活動:[A] 擴張年份,[B] 擴張類型,[C] 輔料類型,[D] 擴張活動:[A] 擴張年份,[B] 擴張類型,[C] 輔料類型,[D] 擴張活動(依地區/國家),[E] 擴張年,[B] 輔料類型,[D] 擴張類型(依地區/國家),[E] 擴張設施位置(依地區),[F] 設施位置(依地區/國家/國家/地區),擴展
- 產能分析:估算全球抗體合約生產的已安裝產能。這考慮了各 ADC 合約生產商基於多個相關參數的生產能力,例如 [A] 公司規模,[B] 營運規模,以及 [C] 主要地理區域。
- 內部生產與外包決策:對ADC合約生產市場目前及未來機會進行詳細評估,評估內容涵蓋不同的製程環節,例如[A]抗體、[B]高活性藥物成分/細胞毒性有效載荷、[C]偶聯/連接子以及[D]填充/包裝。
- 價值鏈分析:詳細檢視ADC生產的每個步驟(抗體生產、有效載荷生產、連接子生產、偶聯、填充和包裝),並提供各階段的成本資訊。
- 案例研究:概述目前ADC市場格局,並基於以下相關參數對ADC產品線進行詳細分析:[A]研發頻率、[B]標靶疾病領域、[C]治療領域、[D]治療線、[E]給藥頻率、[F]治療類型、[G]標靶抗原、[H]抗體同型、[I]活性成分/細胞毒性藥物。 [C] 治療領域,[D] 治療線,[E] 給藥頻率,[F] 治療類型,[G] 標靶抗原,[H] 抗體亞型,[I] 有效載荷/細胞毒性藥物/彈頭,[J] 有效載荷類型,[K] 連接子類型。
- 臨床試驗分析:基於以下相關參數,對已完成、正在進行和計劃中的各種抗體藥物偶聯物 (ADC) 臨床試驗進行詳細分析:[A] 研究註冊年份,[B] 入組患者人數,[C] 研究階段,[D] 研究狀態,[E] 目標患者人群,[F] 患者性別,[G] 申辦人最活躍的參與者(基於註冊研究數量),[J] 地理位置。 [G] 申辦者/合作方類型,[H] 研究設計,[I] 最活躍的參與者(基於註冊研究數量),[J] 地區。
- 潛在合作分析:基於相關參數(例如[A] 開發商實力、[B] 產品線實力、[C] 成熟度以及[D] 生產能力),對具有與ADC合約生產商建立高合作潛力的ADC療法開發商進行詳細分析。
- 需求分析:基於相關參數(例如[A] 目標患者群體、[B] 給藥頻率、[C] 劑量強度以及[D] 已獲批產品和臨床階段候選藥物的臨床階段候選藥物),對ADC療法的年度商業和臨床需求(以公斤為單位)進行合理估算。
- 區域產能分析:提供詳細的區域產能評估框架,比較關鍵區域。比較參數包括[A] ADC合約生產商數量、[B] ADC生產設施數量、[C] 設施擴建數量、[D] 已安裝的ADC生物偶聯產能、[E] 已註冊的臨床試驗數量以及[F] 該地區的ADC需求。
- 吸引力競爭矩陣:對當前市場狀況進行詳細評估,包括現有競爭格局以及新興和成熟市場細分領域的成長機會。
- 市場影響分析:對可能影響ADC合約製造市場成長的因素進行詳細分析。這包括識別和市場分析以下方面:[A] 關鍵驅動因素,[B] 潛在限制因素,[C] 新興機遇,以及 [D] 現有挑戰。
目錄
第一章:引言
第二章:研究方法
第三章:市場動態
- 章節概述
- 預測研究法
- 市場估值框架
- 預測工具與技術
- 關鍵考慮因素
- 局限性
第四章:宏觀經濟指標
- 章節概述
- 市場動態
- 結論
第五章:摘要整理
第六章:引言
- 章節概述
- 關鍵組成部分ADC(抗體偶聯藥物)
- ADC 製造
- 供應鏈挑戰與方法論轉移
- 選擇 CMO 合作夥伴
- 未來展望
第七章:市場概況
- 章節概述
- ADC 代工製造商:市場概況
第八章:競爭分析
- 章節概述
- 假設與關鍵參數
- 研究方法
- ADC 代工製造商:競爭分析
- 頂級 ADC 代工製造商的能力標竿分析
第九章 ADC 代工製造商公司簡介
- 章節概述
- MabPlex
- Lonza
- Abzena
- GBI
- CARBOGEN AMICS
- Millipore Sigma
- WuXi Biologics
- Catalent Pharma Solutions
- Cerbios-Pharma
- Formosa Laboratories
- Sterling Pharma Solutions
- Piramal Pharma Solutions
- AbbVie Contract Manufacturing
第十章 近期擴張
- 章節概述
- ADC 合約製造商:近期擴張
第十一章 合作關係
章節第 12 章:自製或外購決策
- 章節概述
- 假設和關鍵參數
- 結論
第 13 章:價值鏈分析
- 章節概述
- ADC 開發價值鏈
- 價值鏈成本分配
第 14 章:產能分析
- 章節概述
- 關鍵假設與研究方法
- ADC 生產:全球已安裝產能
第 15 章:個案研究:ADC 治療市場概況
- 章節概述
- ADC 治療:治療管線
- 抗體藥物偶聯物:值得關注的療法
- 結論
第16章 臨床試驗分析
- 章節概述
- 研究範圍與方法
- 抗體藥物偶聯物:臨床試驗分析
第17章:潛在合作夥伴分析
- 章節概述
- 評分標準與關鍵假設
- 研究範圍與方法
- 北美潛在策略夥伴
- 歐洲潛在戰略夥伴
- 亞太及其他地區潛在戰略夥伴
第18章:ADC療法:需求分析
第19章:區域能力分析
第20章:吸引力與競爭力矩陣
- 章節概述
- AC矩陣:概述
- AC矩陣:分析研究方法
- AC矩陣:ADC合約製造市場整體概況
第21章 市場影響分析
- 章節概述
- 市場驅動因素
- 市場限制因素
- 市場機遇
- 市場挑戰
- 結論
第22章:全球ADC合約製造市場
第23章:ADC合約製造市場(依業務規模劃分)
第24章:ADC合約製造市場(依製程組件劃分)
第25章:ADC合約製造市場(依有效載荷類型劃分))
第26章:ADC合約生產市場(依抗體來源劃分)
第27章:ADC合約生產市場(以抗體同型劃分)
第28章:ADC合約生產市場(以標靶適應症劃分)
第29章:ADC合約生產市場(依連接子類型劃分)
第30章:ADC合約生產市場(依主要地區劃分)
第31章:商業化ADC合約生產市場
第32章:臨床ADC合約生產市場
第33章:結論
第34章:高階主管洞察
第35. 附錄一:表格資料
第36章 附錄二:公司與組織清單
ADC Contract Manufacturing Market: Overview
As per Roots Analysis, the ADC contract manufacturing market is estimated to grow from USD USD 1,720 million in 2025 in the current year to USD 3,212 million by 2035 at a CAGR of 6.4% during the forecast period, till 2035.
Scale of Operation
- Clinical Scale
- Commercial Scale
Process Component
- Tubulin Inhibitors
- Topoisomerase Inhibitors
- DNA Damaging Agents
- Others
Type of Payload
- Tubulin Inhibitors
- Topoisomerase Inhibitors
- DNA Damaging Agents
- Others
Antibody Isotype
- IgG1
- IgG4
- Others
Target Indication
- Solid Tumors
- Hematological Malignancies
Type of Linker
- Valine-citrulline
- SMCC
- Hydrazone
- Maleimide
- Maleimidocaproyl
- Tetrapeptide-based linker
- Peptide Linker
- Others
Antibody Origin
- Humanized
- Chimeric
- Human
- Others
Key Geographical Regions
- North America
- US
- Canada
- Rest of North America
- Europe
- UK
- Spain
- Italy
- Germany
- France
- Rest of Europe
- Asia-Pacific and Rest of the World
- China
- Japan
- India
- South Korea
- Australia
- Argentina
- Brazil
- Chile
- Columbia
- Israel
- Kenya
- Peru
- South Africa
- Turkey
- Saudi Arabia
- Rest of Asia-Pacific and rest of the world
ADC Contract Manufacturing Market: Growth and Trends
Antibody drug conjugates (ADCs) have shown remarkable promise in recent years for the treatment of various cancers, encompassing both solid tumors and hematological malignancies. These intricate molecules, consisting of an antibody linked to biologically active, cytotoxic substances via chemical connectors, demonstrate improved stability, target specificity, tumor selectivity, and pharmacokinetic characteristics.
At present, the ADC pipeline comprises more than 614 drug candidates in clinical trial assessment, in addition to 28 ADC therapeutic programs that have received approval from different regulatory bodies. The production process for ADC necessitates specialized knowledge and the application of advanced technologies, both of which are cost intensive. Consequently, ADC developers favor delegating manufacturing tasks to ADC contract manufacturers. By utilizing the expertise, resources, and production facilities of these CMOs, developers can streamline costs and speed up schedules. Due to the rising demand for ADCs and the growing tendency for drug developers to outsource operations, the ADC contract manufacturing market is expected to experience significant growth throughout the forecast period.
ADC Contract Manufacturing Market: Key Insights
The report delves into the current state of the ADC contract manufacturing market and identifies potential growth opportunities within the industry. Some key findings from the report include:
- The current market landscape features a presence of close to 35 companies that claim to have the required capabilities to offer contract manufacturing and conjugation services for antibody drug conjugates, worldwide.
- Majority (~65%) of the manufacturers offer different types of services across all scales of operation, in order to become one-stop shops for mitigating technical challenges such as technology transfer and scale-up for clients.
- Stakeholders are actively upgrading their existing capabilities in order to enhance their respective portfolios and gain a competitive edge over other players active in the ADC contract manufacturing domain.
- Industry players are undertaking significant efforts to strengthen their infrastructure and enhance service offerings in this domain, with most of the initiatives undertaken in the last 12 months.
- The rising interest in this market is reflected from the rising partnerships established among various stakeholders in the recent past; in fact, close to 60% of the deals were inked in the last three years.
- More than 780 clinical trials have been registered till date to evaluate the safety and efficacy of various antibody drug conjugates; majority of these studies have been conducted across various sites in the US.
- Various ADC therapeutic developers are anticipated to forge strategic alliances with contract manufacturing service providers in order to outsource complex manufacturing operations.
- The deployment of ADCs requires the selection of antibody, linker, and cytotoxic payload, in order to target high-expression tumor antigens that are internalized by the cell.
- Notably, over 30% of the total capacity expansion initiatives were carried out by the players located in North America, reflecting the region's dominance in advanced ADC manufacturing infrastructure.
- The global installed antibody drug conjugates manufacturing capacity is well distributed across various geographies; interestingly, around 90% of total installed capacity is available in facilities owned by large players.
- The demand for ADC therapeutics is likely to increase significantly as several clinical candidates are expected to be commercialized across various regions.
- Driven by the expanding pipeline of ADC therapeutics and manufacturing expertise available with contract service providers, the ADC contract manufacturing market is poised to witness significant growth in the future.
- Europe currently dominates the market (45%) and captures the largest share within the ADC contract manufacturing market; this is followed by North America.
- The humanized sub-segment is estimated to capture majority of the overall market share in the current year, owing to its enhanced safety and reduced immunogenicity.
- The ADC contract manufacturing market in North America is expected to capture maximum share by 2035; further, close to 85% of the companies in this domain offer services for antibody manufacturing.
ADC Contract Manufacturing Market: Key Segments
Commercial Scale of Operation Accounts for the Largest Share of ADC Contract Manufacturing Market
In terms of scale of operation, the ADC contract manufacturing market is segmented across various scales of operation such as clinical and commercial scale. Currently, the commercial scale segment occupies the higher market share (around 90%), owing to the surging demand for ADCs as potent targeted cancer therapies. The clinical segment is likely to grow at a higher CAGR (7.6%) during the forecast period. This stems from many ADC drug candidates authorized by regulatory agencies since 2021. Advancements in ADC therapies have led to a growing quantity of ADCs moving into the clinical development phase.
Solid Tumors Segment to Hold the Highest Revenue in the ADC Contract Manufacturing Market
In the current year, solid tumors segment is likely to capture majority of the ADC contract manufacturing market size (with a share of 80%), and this trend is unlikely to change in the future as well. This prevalence arises from the fact that the majority of commercialized ADC therapeutics and those in advanced clinical trials specifically for solid tumors. The market for hematologic cancers is expected to expand at a CAGR of 8.7% during the forecast period.
Antibodies are Likely to Hold the Highest ADC Contract Manufacturing Market Share in the Future
In the current year, the antibody segment occupies the highest share in the overall market and this trend is expected to remain same during the forecast period. The higher share of antibodies is due to the complex cellular or protein engineering requirements, making antibody manufacturing a time and cost-intensive process, thus prompting the need for more specialized antibody manufacturing expertise.
Asia-Pacific is Likely to Propel the ADC Contract Manufacturing Market
The market in Asia-Pacific and rest of the world is likely to grow at a relatively higher CAGR (8.5%), during the forecast period. This is a result of significant cost advantage offered by this region, particularly in countries such as China and India, where lower labor costs and operational expenses provide favorable manufacturing environment as compared to traditional hubs in North America and Europe. Examples of ADC contract manufacturing companies based in Asia-Pacific include Shilpa Biologics, WuXi Biologics, Formosa Laboratories, Syngene and Samsung Biologics.
Example Players in the ADC Contract Manufacturing Market
- AbbVie Contract Manufacturing
- Abzena
- CARBOGEN AMCIS
- Catalent Pharma Solutions
- Cerbios-Pharma
- MabPlex
- Millipore Sigma
- Lonza
- WuXi Biologics
Primary Research Overview
Discussions with multiple stakeholders in this domain influenced the opinions and insights presented in this study. The market report includes transcripts of the following discussions:
- Senior Director, Commercial Development, Large company, Europe
- Business Development Manager, Mid-sized company, Europe
- Chief Executive Officer, Large company, Europe
- Chief Executive Officer and Founder, Small Company, UK
- Chief Executive Officer and Co-Founder, Small Company, France
- Former Chief Executive Officer, Large Company, US
- Chief Commercial Officer, Mid-sized Company, Switzerland
- Chief Business Officer, Small Company, Switzerland
- Executive Director, Large Company, Japan and Chief Innovation Officer, Large Company, Japan
- Director, Business Development, Small Company, Netherlands
- Director Corporate Development, Mid-sized Company, US
- Director, Business Development, Large Company, US and Former Group Product Manager, Large Company, US
- Former Director of CDMO, Large Organization, France
- Business Development Manager, Mid-sized Company, Switzerland
- Former Head of Bioconjugates Commercial Development, Large Company, Switzerland
- Former Site Head, Large Company, US
- Associate Scientist, Large Company, US
ADC Contract Manufacturing Market: Research Coverage
- Market Sizing and Opportunity Analysis: The report features an in-depth analysis of the ADC contract manufacturing market, focusing on key market segments, including [A] stage of development, [B] process component, [C] type of payload, [D] antibody isotype, [E] target indication, [F] antibody origin, [G] type of linker and [H] key geographical regions.
- Market Landscape: A comprehensive evaluation of overall market landscape of players engaged in the contract manufacturing of ADCs, based on several relevant parameters, such as [A] year of establishment, [B] company size, [C] location of headquarters, [D] type of ADC manufacturing service offered, [E] type of additional service offered, [F] scale of and [G] location of manufacturing facility.
- Company Profiles: In-depth profiles of companies engaged in the manufacturing of ADCs headquartered in North America, Europe and Asia-Pacific focusing on [A] company overview, [B] ADC contract manufacturing portfolio, [C] recent developments and [D] an informed future outlook.
- Company Competitiveness Analysis: A comprehensive competitive analysis of ADC contract manufacturers, examining factors, such as [A] supplier strength, [B] service strength and [C] number of manufacturing facilities.
- Partnerships and Collaborations: A detailed analysis of the partnerships inked between stakeholders in the ADC contract manufacturing market based on several relevant parameters, such as [A] year of partnership, [B] type of partnership, [C], year and type of partnership and [D], geographical distribution of partnership activity.
- Recent Expansions: A detailed analysis of the recent expansions undertaken by various ADC contract manufacturers, based on several relevant parameters, such as [A] year of expansion, [B] type of expansion, [C] type of excipient, [D] type of expansion (region and country), [E] location of expanded facility (region), [F] location of expanded facility (country), [G] most active players (in terms of number of recent expansions) and [H] geographical distribution (region and country).
- Capacity Analysis: An estimate of the global installed capacity for antibody contract manufacturing taking into consideration the capacities of various ADC contract manufacturers, based on several relevant parameters, such as [A] company size, [B] scale of operation and [C] key geographical regions.
- Make Versus Buy Decision Making: A detailed evaluation of current and future opportunity within the ADC contract manufacturing market across different process components, such as [A] antibody, [B] HPAPI / cytotoxic payload, [C] conjugation / linker and [D] fill / finish.
- Value Chain Analysis: A detailed discussion on various steps (antibody manufacturing, payload manufacturing, linker manufacturing, conjugation and fill / finish) involved in the manufacturing of ADCs, along with information on the cost requirements across each stage.
- Case Study: An overview of the current market landscape of ADCs, along with detailed analysis of the ADCs pipeline, based on several relevant parameters, such as [A] status of development, [B] target disease indication, [C] therapeutic area, [D] line of treatment, [E] dosing frequency, [F] type of therapy, [G] target antigen, [H] antibody isotype, [I] payload / cytotoxin / warhead, [J] type of payload and [K] type of linker.
- Clinical Trial Analysis: An in-depth analysis of completed, ongoing, and planned clinical studies of various ADCs, based on several relevant parameters, such as [A] trial registration year, [B] number of patients enrolled, [C] trial phase, [D] trial status, [E] target patient population, [F] patient gender, [G] type of sponsor / collaborator, [H] study design, [I] most active player (based on the number of registered trials) and [J] geography.
- Likely Partners Analysis: An in-depth analysis of ADC therapy developers that are likely to partner with ADC contract manufacturers, based on several relevant parameters, such as [A] developer strength, [B] pipeline strength and [C] maturity and [D] manufacturing capabilities.
- Demand Analysis: An informed estimate of the annual commercial and clinical demand for ADC therapeutics (in kilograms) based on, based on relevant parameters, such as [A] target patient population, [B] dosing frequency and [C] dose strength of approved products and [D] clinical stage candidates.
- Regional Capability Analysis: A detailed regional capability assessment framework, which compares the key geographies, based on a number of parameters, such as the [A] number of ADC contract manufacturers, [B] number of ADC manufacturing facilities, [C] number of facility expansions, [D] installed ADC bioconjugation capacity, [E] number of registered clinical trials and [F] demand for ADCs in that particular geographical region.
- Attractiveness Competitiveness Matrix: A detailed assessment of the current market scenario (in terms of existing competition and growth opportunities) across emerging and established market segments.
- Market Impact Analysis: In-depth analysis of the factors that can impact the growth of the ADC contract manufacturing market. It also features identification and market analysis of [A] key drivers, [B] potential restraints, [C] emerging opportunities, and [D] existing challenges.
Key Questions Answered in this Report
- How many companies are currently engaged in this market?
- Which are the leading companies in this market?
- What factors are likely to influence the evolution of this market?
- What is the current and future market size?
- What is the CAGR of this market?
- How is the current and future market opportunity likely to be distributed across key market segments?
Reasons to Buy this Report
- The report provides a comprehensive market analysis, offering detailed revenue projections of the overall market and its specific sub-segments. This information is valuable to both established market leaders and emerging entrants.
- Stakeholders can leverage the report to gain a deeper understanding of the competitive dynamics within the market. By analyzing the competitive landscape, businesses can make informed decisions to optimize their market positioning and develop effective go-to-market strategies.
- The report offers stakeholders a comprehensive overview of the market, including key drivers, barriers, opportunities, and challenges. This information empowers stakeholders to stay abreast of market trends and make data-driven decisions to capitalize on growth prospects.
Additional Benefits
- Complimentary Excel Data Packs for all Analytical Modules in the Report
- 15% Free Content Customization
- Detailed Report Walkthrough Session with Research Team
- Free Updated report if the report is 6-12 months old or older
TABLE OF CONTENTS
1. PREFACE
- 1.1. Introduction
- 1.2. Market Share Insights
- 1.3. Key Market Insights
- 1.4. Report Coverage
- 1.5. Key Questions Answered
- 1.6. Chapter Outlines
2. RESEARCH METHODOLOGY
- 2.1. Chapter Overview
- 2.2. Research Assumptions
- 2.2.1. Market Landscape and Market Trends
- 2.2.2. Market Forecast and Opportunity Analysis
- 2.2.3. Comparative Analysis
- 2.3. Database Building
- 2.3.1. Data Collection
- 2.3.2. Data Validation
- 2.3.3. Data Analysis
- 2.4. Project Methodology
- 2.4.1. Secondary Research
- 2.4.1.1. Annual Reports
- 2.4.1.2. Academic Research Papers
- 2.4.1.3. Company Websites
- 2.4.1.4. Investor Presentations
- 2.4.1.5. Regulatory Filings
- 2.4.1.6. White Papers
- 2.4.1.7. Industry Publications
- 2.4.1.8. Conferences and Seminars
- 2.4.1.9. Government Portals
- 2.4.1.10. Media and Press Releases
- 2.4.1.11. Newsletters
- 2.4.1.12. Industry Databases
- 2.4.1.13. Roots Proprietary Databases
- 2.4.1.14. Paid Databases and Sources
- 2.4.1.15. Social Media Portals
- 2.4.1.16. Other Secondary Sources
- 2.4.2. Primary Research
- 2.4.2.1. Types of Primary Research
- 2.4.2.1.1. Qualitative Research
- 2.4.2.1.2. Quantitative Research
- 2.4.2.1.3. Hybrid Approach
- 2.4.2.2. Advantages of Primary Research
- 2.4.2.3. Techniques for Primary Research
- 2.4.2.3.1. Interviews
- 2.4.2.3.2. Surveys
- 2.4.2.3.3. Focus Groups
- 2.4.2.3.4. Observational Research
- 2.4.2.3.5. Social Media Interactions
- 2.4.2.4. Key Opinion Leaders Considered in Primary Research
- 2.4.2.4.1. Company Executives (CXOs)
- 2.4.2.4.2. Board of Directors
- 2.4.2.4.3. Company Presidents and Vice Presidents
- 2.4.2.4.4. Research and Development Heads
- 2.4.2.4.5. Technical Experts
- 2.4.2.4.6. Subject Matter Experts
- 2.4.2.4.7. Scientists
- 2.4.2.4.8. Doctors and Other Healthcare Providers
- 2.4.2.5. Ethics and Integrity
- 2.4.2.5.1. Research Ethics
- 2.4.2.5.2. Data Integrity
- 2.4.2.1. Types of Primary Research
- 2.4.3. Analytical Tools and Databases
- 2.4.1. Secondary Research
- 2.5. Robust Quality Control
3. MARKET DYNAMICS
- 3.1. Chapter Overview
- 3.2. Forecast Methodology
- 3.2.1. Top-down Approach
- 3.2.2. Bottom-up Approach
- 3.2.3. Hybrid Approach
- 3.3. Market Assessment Framework
- 3.3.1. Total Addressable Market (TAM)
- 3.3.2. Serviceable Addressable Market (SAM)
- 3.3.3. Serviceable Obtainable Market (SOM)
- 3.3.4. Currently Acquired Market (CAM)
- 3.4. Forecasting Tools and Techniques
- 3.4.1. Qualitative Forecasting
- 3.4.2. Correlation
- 3.4.3. Regression
- 3.4.4. Extrapolation
- 3.4.5. Convergence
- 3.4.6. Sensitivity Analysis
- 3.4.7. Scenario Planning
- 3.4.8. Data Visualization
- 3.4.9. Time Series Analysis
- 3.4.10. Forecast Error Analysis
- 3.5. Key Considerations
- 3.5.1. Demographics
- 3.5.2. Government Regulations
- 3.5.3. Reimbursement Scenarios
- 3.5.4. Market Access
- 3.5.5. Supply Chain
- 3.5.6. Industry Consolidation
- 3.5.7. Pandemic / Unforeseen Disruptions Impact
- 3.6. Limitations
4. MACRO-ECONOMIC INDICATORS
- 4.1. Chapter Overview
- 4.2. Market Dynamics
- 4.2.1. Time Period
- 4.2.1.1. Historical Trends
- 4.2.1.2. Current and Forecasted Estimates
- 4.2.2. Currency Coverage
- 4.2.2.1. Major Currencies Affecting the Market
- 4.2.2.2. Factors Affecting Currency Fluctuations on the Industry
- 4.2.2.3. Impact of Currency Fluctuations on the Industry
- 4.2.3. Foreign Currency Exchange Rate
- 4.2.3.1. Impact of Foreign Exchange Rate Volatility on the Market
- 4.2.3.2. Strategies for Mitigating Foreign Exchange Risk
- 4.2.4. Recession
- 4.2.4.1. Assessment of Current Economic Conditions and Potential Impact on the Market
- 4.2.4.2. Historical Analysis of Past Recessions and Lessons Learnt
- 4.2.5. Inflation
- 4.2.5.1. Measurement and Analysis of Inflationary Pressures in the Economy
- 4.2.5.2. Potential Impact of Inflation on the Market Evolution
- 4.2.6. Interest Rates
- 4.2.6.1. Interest Rates and Their Impact on the Market
- 4.2.6.2. Strategies for Managing Interest Rate Risk
- 4.2.7. Commodity Flow Analysis
- 4.2.7.1. Type of Commodity
- 4.2.7.2. Origins and Destinations
- 4.2.7.3. Value and Weights
- 4.2.7.4. Modes of Transportation
- 4.2.8. Global Trade Dynamics
- 4.2.8.1. Import Scenario
- 4.2.8.2. Export Scenario
- 4.2.8.3. Trade Policies
- 4.2.8.4. Strategies for Mitigating the Risks Associated with Trade Barriers
- 4.2.8.5. Impact of Trade Barriers on the Market
- 4.2.9. War Impact Analysis
- 4.2.9.1. Russian-Ukraine War
- 4.2.9.2. Israel-Hamas War
- 4.2.10. COVID Impact / Related Factors
- 4.2.10.1. Global Economic Impact
- 4.2.10.2. Industry-specific Impact
- 4.2.10.3. Government Response and Stimulus Measures
- 4.2.10.4. Future Outlook and Adaptation Strategies
- 4.2.11. Other Indicators
- 4.2.11.1. Fiscal Policy
- 4.2.11.2. Consumer Spending
- 4.2.11.3. Gross Domestic Product (GDP)
- 4.2.11.4. Employment
- 4.2.11.5. Taxes
- 4.2.11.6. Stock Market Performance
- 4.2.11.7. Cross-Border Dynamics
- 4.2.1. Time Period
- 4.3. Conclusion
5. EXECUTIVE SUMMARY
6. INTRODUCTION
- 6.1. Chapter Overview
- 6.2. Key Components of ADCs
- 6.2.1. Antibody
- 6.2.2. Cytotoxin (Payloads)
- 6.2.3. Linker
- 6.3. ADC Manufacturing
- 6.3.1. Key Steps
- 6.3.2. Technical Challenges
- 6.3.3. Need for Outsourcing
- 6.4. Challenges Associated with Supply Chain and Method Transfer
- 6.4.1. Growing Demand for One-Stop-Shops and Integrated Service Providers
- 6.5. Selecting a CMO Partner
- 6.6. Future Perspective
7. MARKET LANDSCAPE
- 7.1. Chapter Overview
- 7.2. ADC Contract Manufacturers: Overall Market Landscape
- 7.2.1. Analysis by Year of Establishment
- 7.2.2. Analysis by Company Size
- 7.2.3. Analysis by Location of Headquarters
- 7.2.4. Analysis by Type of ADC Manufacturing Service Offered
- 7.2.5. Analysis by Type of Additional Service Offered
- 7.2.6. Analysis by Scale of Operation
- 7.2.7. Analysis by Location of Manufacturing Facility
8. COMPANY COMPETITIVENESS ANALYSIS
- 8.1. Chapter Overview
- 8.2. Assumptions and Key Parameters
- 8.3. Methodology
- 8.4. ADC Contract Manufacturers: Company Competitiveness Analysis
- 8.4.1. ADC Contract Manufacturers based in North America (Peer Group I)
- 8.4.2. ADC Contract Manufacturers based in Europe (Peer Group II)
- 8.4.3. ADC Contract Manufacturers based in Asia-Pacific (Peer Group III)
- 8.5. Capability Benchmarking of top ADC Contract Manufacturers
9. COMPANY PROFILES: ADC CONTRACT MANUFACTURERS
- 9.1. Chapter Overview
- 9.2. MabPlex
- 9.2.1. Company Overview
- 9.2.2. ADC Related Services
- 9.2.3. Manufacturing Facilities
- 9.2.4. Recent Developments and Future Outlook
- 9.3. Lonza
- 9.4. Abzena
- 9.5. GBI
- 9.6. CARBOGEN AMICS
- 9.7. Millipore Sigma
- 9.8. WuXi Biologics
- 9.9. Catalent Pharma Solutions
- 9.10. Cerbios-Pharma
- 9.11. Formosa Laboratories
- 9.12. Sterling Pharma Solutions
- 9.13. Piramal Pharma Solutions
- 9.14. AbbVie Contract Manufacturing
10. RECENT EXPANSIONS
- 10.1. Chapter Overview
- 10.2. ADC Contract Manufacturers: Recent Expansions
- 10.2.1. Analysis by Year of Expansion
- 10.2.2. Analysis by Type of Expansion
- 10.2.3. Analysis by Purpose of Expansion
- 10.2.4. Analysis by Type of Facility
- 10.2.5. Analysis by Scale of Operation
- 10.2.6. Analysis by Location of Expanded Facility
- 10.2.7. Most Active Players: Analysis by Number of Expansions
11. PARTNERSHIPS AND COLLABORATIONS
- 11.1. Chapter Overview
- 11.2. Partnership Models
- 11.3. ADC Contract Manufacturers: Partnerships and Collaborations
- 11.3.1. Analysis by Year of Partnership
- 11.3.2. Analysis by Type of Partnership
- 11.3.3. Analysis by Scale of Operation
- 11.3.4. Most Active Players: Analysis by Number of Partnerships
- 11.3.5. Analysis by Geography
- 11.3.5.1. Intercontinental and Intracontinental Agreements
- 11.3.5.2. Local and International Agreements
12. MAKE VERSUS BUY DECISION MAKING
- 12.1. Chapter Overview
- 12.2. Assumptions and Key Parameters
- 12.2.1. Scenario 1
- 12.2.2. Scenario 2
- 12.2.3. Scenario 3
- 12.2.4. Scenario 4
- 12.3. Concluding Remarks
13. VALUE CHAIN ANALYSIS
- 13.1. Chapter Overview
- 13.2. ADC Development Value Chain
- 13.3. Cost Distribution across the Value Chain
- 13.3.1. Cost Associated with Antibody Manufacturing
- 13.3.2. Cost Associated with Payload and Linker Manufacturing
- 13.3.3. Cost Associated with Conjugation
- 13.3.4. Cost Associated with Fill / Finish
14. CAPACITY ANALYSIS
- 14.1. Chapter Overview
- 14.2. Key Assumptions and Methodology
- 14.3. ADC Manufacturing: Global Installed Capacity
- 14.3.1. Analysis by Company Size
- 14.3.2. Analysis by Location of Headquarters
- 14.3.3. Analysis by Location of Manufacturing Facility
- 14.3.3.1. Analysis by Region
- 14.3.3.2. Analysis by Country
- 14.3.4. Analysis by Key Players
15. CASE STUDY: ADC THERAPEUTICS MARKET OVERVIEW
- 15.1. Chapter Overview
- 15.2. ADC Therapeutics: Therapies Pipeline
- 15.2.1. Analysis by Status of Development
- 15.2.2. Analysis by Target Disease Indication
- 15.2.3. Analysis by Therapeutic Area
- 15.2.4. Analysis by Line of Treatment
- 15.2.5. Analysis by Dosing Frequency
- 15.2.6. Analysis by Type of Therapy
- 15.2.7. Analysis by Target Antigen
- 15.2.8. Analysis by Antibody Isotype
- 15.2.9. Analysis by Payload / Cytotoxin / Warhead
- 15.2.10. Analysis by Type of Payload
- 15.2.11. Analysis by Linker
- 15.2.12. Analysis by Type of Linker (Cleavable / Non-Cleavable)
- 15.3. Antibody Drug Conjugates: Therapies to Watch
- 15.4. Concluding Remarks
16. CLINICAL TRIAL ANALYSIS
- 16.1. Chapter Overview
- 16.2. Scope and Methodology
- 16.3. Antibody Drug Conjugates: Clinical Trial Analysis
- 16.3.1. Analysis by Trial Registration Year
- 16.3.2. Analysis of Number of Patients Enrolled by Trial Registration Year
- 16.3.3. Analysis by Trial Phase
- 16.3.4. Analysis of Number of Patients Enrolled by Trial Phase
- 16.3.5. Analysis by Trial Status
- 16.3.6. Analysis by Trial Registration Year and Trial Status
- 16.3.7. Analysis of Number of Patients Enrolled by Trial Status
- 16.3.8. Analysis by Patient Gender
- 16.3.9. Analysis by Study Design
- 16.3.9.1. Analysis by Type of Allocation
- 16.3.9.2. Analysis by Type of Intervention Model
- 16.3.9.3. Analysis by Type of Masking
- 16.3.9.4. Analysis by Trial Purpose
- 16.3.10. Analysis by Type of Sponsor / Collaborator
- 16.3.11. Leading Industry Players: Analysis by Number of Clinical Trials
- 16.3.12. Leading Non-Industry Players: Analysis by Number of Clinical Trials
- 16.3.13. Analysis by Geography
- 16.3.13.1. Analysis of Clinical Trials by Geography
- 16.3.13.2. Analysis of Clinical Trials by Geography and Trial Status
- 16.3.13.3. Analysis of Patients Enrolled by Geography and Trial Status
17. LIKELY PARTNER ANALYSIS
- 17.1. Chapter Overview
- 17.2. Scoring Criteria and Key Assumptions
- 17.3. Scope and Methodology
- 17.4. Potential Strategic Partners based in North America
- 17.4.1. Most Likely Partners
- 17.4.2. Likely Partners
- 17.4.3. Least Likely Partners
- 17.5. Potential Strategic Partners based in Europe
- 17.5.1. Most Likely Partners
- 17.5.2. Likely Partners
- 17.5.3. Least Likely Partners
- 17.6. Potential Strategic Partners based in Asia-Pacific and Rest of the World
- 17.6.1. Most Likely Partners
- 17.6.2. Likely Partners
- 17.6.3. Least Likely Partners
18. ADC THERAPEUTICS: DEMAND ANALYSIS
- 18.1. Chapter Overview
- 18.2. Key Assumptions and Methodology
- 18.3. ADC Therapeutics: Global Annual Demand
- 18.3.1. ADC Therapeutics: Annual Commercial Demand
- 18.3.1.1. Analysis by Target Indication
- 18.3.1.2. Analysis by Antibody Origin
- 18.3.1.3. Analysis by Antibody Isotype
- 18.3.1.4. Analysis by Type of Payload
- 18.3.1.5. Analysis by Type of Linker
- 18.3.1.6. Analysis by Key Geographical Regions
- 18.3.2. ADC Therapeutics: Annual Clinical Demand
- 18.3.2.1. Analysis by Phase of Development
- 18.3.2.2. Analysis by Target Indication
- 18.3.2.3. Analysis by Antibody Origin
- 18.3.2.4. Analysis by Antibody Isotype
- 18.3.2.5. Analysis by Type of Payload
- 18.3.2.6. Analysis by Type of Linker
- 18.3.2.7. Analysis by Key Geographical Regions
- 18.3.1. ADC Therapeutics: Annual Commercial Demand
19. REGIONAL CAPABILITY ANALYSIS
- 19.1. Chapter Overview
- 19.2. Assumptions and Key Parameters
- 19.3. ADC Contract Manufacturing Capabilities in North America
- 19.4. ADC Contract Manufacturing Capabilities in Europe
- 19.5. ADC Contract Manufacturing Capabilities in Asia-Pacific and Rest of the World
20. ATTRACTIVENESS COMPETITIVENESS MATRIX
- 20.1. Chapter Overview
- 20.2. AC Matrix: Overview
- 20.2.1. Strong Business Segments
- 20.2.2. Average Business Segments
- 20.2.3. Weak Business Segments
- 20.3. AC Matrix: Analytical Methodology
- 20.4. AC Matrix: Overall ADC Contract Manufacturing Market Scenario
- 20.4.1. AC Matrix: ADC Contract Manufacturing Scenario for Type of ADC Manufacturing Service Offered
- 20.4.2. AC Matrix: ADC Contract Manufacturing Scenario for Key Geographical Regions
21. MARKET IMPACT ANALYSIS
- 21.1. Chapter Overview
- 21.2. Market Drivers
- 21.3. Market Restraints
- 21.4. Market Opportunities
- 21.5. Market Challenges
- 21.6. Conclusion
22. GLOBAL ADC CONTRACT MANUFACTURING MARKET
- 22.1. Chapter Overview
- 22.2. Key Assumptions and Methodology
- 22.3. Global ADC Therapeutics Market: Historical Trends (Since 2023) and Forecasted Estimates (Till 2035)
- 22.3.1. Scenario Analysis
- 22.3.1.1. Conservative Scenario
- 22.3.1.2. Optimistic Scenario
- 22.3.1. Scenario Analysis
- 22.4. Key Market Segmentations
23. ADC CONTRACT MANUFACTURING MARKET, BY SCALE OF OPERATION
- 23.1. Chapter Overview
- 23.2. Key Assumptions and Methodology
- 23.3. ADC Contract Manufacturing Market: Distribution by Scale of Operation
- 23.3.1. ADC Contract Manufacturing Market for Clinical Scale, Historical Trends (Since 2023) and Forecasted Estimates (Till 2035)
- 23.3.2. ADC Contract Manufacturing Market for Commercial Scale, Historical Trends (Since 2023) and Forecasted Estimates (Till 2035)
- 23.4. Data Triangulation and Validation
24. ADC CONTRACT MANUFACTURING MARKET, BY PROCESS COMPONENT
- 24.1. Chapter Overview
- 24.2. Key Assumptions and Methodology
- 24.3. ADC Contract Manufacturing Market: Distribution by Process Component
- 24.3.1. ADC Contract Manufacturing Market for Antibodies, Historical Trends (Since 2023) and Forecasted Estimates (Till 2035)
- 24.3.2. ADC Contract Manufacturing Market for HPAPI / Cytotoxic Payloads, Historical Trends (Since 2023) and Forecasted Estimates (Till 2035)
- 24.3.3. ADC Contract Manufacturing Market for Conjugation / Linkers, Historical Trends (Since 2023) and Forecasted Estimates (Till 2035)
- 24.3.4. ADC Contract Manufacturing Market for Fill / Finish, Historical Trends (Since 2023) and Forecasted Estimates (Till 2035)
- 24.4. Data Triangulation and Validation
25. ADC CONTRACT MANUFACTURING MARKET, BY TYPE OF PAYLOAD
- 25.1. Chapter Overview
- 25.2. Key Assumptions and Methodology
- 25.3. ADC Contract Manufacturing Market: Distribution by Type of Payload
- 25.3.1. ADC Contract Manufacturing Market for Tubulin Inhibitors, Historical Trends (Since 2023) and Forecasted Estimates (Till 2035)
- 25.3.2. ADC Contract Manufacturing Market for Topoisomerase Inhibitors, Historical Trends (Since 2023) and Forecasted Estimates (Till 2035)
- 25.3.3. ADC Contract Manufacturing Market for DNA Damaging Agents, Historical Trends (Since 2023) and Forecasted Estimates (Till 2035)
- 25.3.4. ADC Contract Manufacturing Market for Others, Historical Trends (Since 2023) and Forecasted Estimates (Till 2035)
- 25.4. Data Triangulation and Validation
26. ADC CONTRACT MANUFACTURING MARKET, BY ANTIBODY ORIGIN
- 26.1. Chapter Overview
- 26.2. Key Assumptions and Methodology
- 26.3. ADC Contract Manufacturing Market: Distribution by Antibody Origin
- 26.3.1. ADC Contract Manufacturing Market for Humanized, Historical Trends (Since 2023) and Forecasted Estimates (Till 2035)
- 26.3.2. ADC Contract Manufacturing Market for Chimeric, Historical Trends (Since 2023) and Forecasted Estimates (Till 2035)
- 26.3.3. ADC Contract Manufacturing Market for Human, Historical Trends (Since 2023) and Forecasted Estimates (Till 2035)
- 26.3.4. ADC Contract Manufacturing Market for Others, Historical Trends (Since 2023) and Forecasted Estimates (Till 2035)
- 26.4. Data Triangulation and Validation
27. ADC CONTRACT MANUFACTURING MARKET, BY ANTIBODY ISOTYPE
- 27.1. Chapter Overview
- 27.2. Key Assumptions and Methodology
- 27.3. ADC Contract Manufacturing Market: Distribution by Antibody Isotype
- 27.3.1. ADC Contract Manufacturing Market for IgG1, Historical Trends (Since 2023) and Forecasted Estimates (Till 2035)
- 27.3.2. ADC Contract Manufacturing Market for IgG4, Historical Trends (Since 2023) and Forecasted Estimates (Till 2035)
- 27.3.3. ADC Contract Manufacturing Market for Others, Historical Trends (Since 2023) and Forecasted Estimates (Till 2035)
- 27.4. Data Triangulation and Validation
28. ADC CONTRACT MANUFACTURING MARKET, BY TARGET INDICATION
- 28.1. Chapter Overview
- 28.2. Key Assumptions and Methodology
- 28.3. ADC Contract Manufacturing Market: Distribution by Target Indication
- 28.3.1. ADC Contract Manufacturing Market for Solid Tumors, Historical Trends (Since 2023) and Forecasted Estimates (Till 2035)
- 28.3.2. ADC Contract Manufacturing Market for Hematological Malignancies, Historical Trends (Since 2023) and Forecasted Estimates (Till 2035)
- 28.4. Data Triangulation and Validation
29. ADC CONTRACT MANUFACTURING MARKET, BY TYPE OF LINKER
- 29.1. Chapter Overview
- 29.2. Key Assumptions and Methodology
- 29.3. ADC Contract Manufacturing Market: Distribution by Type of Linker
- 29.3.1. ADC Contract Manufacturing Market for Valine-citrulline, Historical Trends (Since 2023) and Forecasted Estimates (Till 2035)
- 29.3.2. ADC Contract Manufacturing Market for SMCC, Historical Trends (Since 2023) and Forecasted Estimates (Till 2035)
- 29.3.3. ADC Contract Manufacturing Market for Hydrazone, Historical Trends (Since 2023) and Forecasted Estimates (Till 2035)
- 29.3.4. ADC Contract Manufacturing Market for Maleimide, Historical Trends (Since 2023) and Forecasted Estimates (Till 2035)
- 29.3.5. ADC Contract Manufacturing Market for Maleimidocaproyl, Historical Trends (Since 2023) and Forecasted Estimates (Till 2035)
- 29.3.6. ADC Contract Manufacturing Market for Tetrapeptide-based Linkers, Historical Trends (Since 2023) and Forecasted Estimates (Till 2035)
- 29.3.7. ADC Contract Manufacturing Market for Peptide Linkers, Historical Trends (Since 2023) and Forecasted Estimates (Till 2035)
- 29.3.8. ADC Contract Manufacturing Market for Others, Historical Trends (Since 2023) and Forecasted Estimates (Till 2035)
- 29.4. Data Triangulation and Validation
30. ADC CONTRACT MANUFACTURING MARKET, BY KEY GEOGRAPHICAL REGIONS
- 30.1. Chapter Overview
- 30.2. Key Assumptions and Methodology
- 30.3. ADC Contract Manufacturing Market: Distribution by Key Geographical Regions
- 30.3.1. ADC Contract Manufacturing Market in North America, Historical Trends (Since 2023) and Forecasted Estimates (Till 2035)
- 30.3.1.1. ADC Contract Manufacturing Market in the US, Historical Trends (Since 2023) and Forecasted Estimates (Till 2035)
- 30.3.1.2. ADC Contract Manufacturing Market in Canada, Historical Trends (Since 2023) and Forecasted Estimates (Till 2035)
- 30.3.1.3. ADC Contract Manufacturing Market in Rest of North America, Historical Trends (Since 2023) and Forecasted Estimates (Till 2035)
- 30.3.2. ADC Contract Manufacturing Market in Europe, Historical Trends (Since 2023) and Forecasted Estimates (Till 2035)
- 30.3.2.1. ADC Contract Manufacturing Market in the UK, Historical Trends (Since 2023) and Forecasted Estimates (Till 2035)
- 30.3.2.2. ADC Contract Manufacturing Market in Spain, Historical Trends (Since 2023) and Forecasted Estimates (Till 2035)
- 30.3.2.3. ADC Contract Manufacturing Market in Italy, Historical Trends (Since 2023) and Forecasted Estimates (Till 2035)
- 30.3.2.4. ADC Contract Manufacturing Market in Germany, Historical Trends (Since 2023) and Forecasted Estimates (Till 2035)
- 30.3.2.5. ADC Contract Manufacturing Market in France, Historical Trends (Since 2023) and Forecasted Estimates (Till 2035)
- 30.3.2.6. ADC Contract Manufacturing Market for Rest of Europe, Historical Trends (Since 2023) and Forecasted Estimates (Till 2035)
- 30.3.3. ADC Contract Manufacturing Market in Asia-Pacific and Rest of the World, Historical Trends (Since 2023) and Forecasted Estimates (Till 2035)
- 30.3.3.1. ADC Contract Manufacturing Market in China, Historical Trends (Since 2023) and Forecasted Estimates (Till 2035)
- 30.3.3.2. ADC Contract Manufacturing Market in Japan, Historical Trends (Since 2023) and Forecasted Estimates (Till 2035)
- 30.3.3.3. ADC Contract Manufacturing Market in India, Historical Trends (Since 2023) and Forecasted Estimates (Till 2035)
- 30.3.3.4. ADC Contract Manufacturing Market in South Korea, Historical Trends (Since 2023) and Forecasted Estimates (Till 2035)
- 30.3.3.5. ADC Contract Manufacturing Market for Australia, Historical Trends (Since 2023) and Forecasted Estimates (Till 2035)
- 30.3.3.6. ADC Contract Manufacturing Market for Argentina, Historical Trends (Since 2023) and Forecasted Estimates (Till 2035)
- 30.3.3.7. ADC Contract Manufacturing Market for Brazil, Historical Trends (Since 2023) and Forecasted Estimates (Till 2035)
- 30.3.3.8. ADC Contract Manufacturing Market for Chile, Historical Trends (Since 2023) and Forecasted Estimates (Till 2035)
- 30.3.3.9. ADC Contract Manufacturing Market for Colombia, Historical Trends (Since 2023) and Forecasted Estimates (Till 2035)
- 30.3.3.10. ADC Contract Manufacturing Market for Israel, Historical Trends (Since 2023) and Forecasted Estimates (Till 2035)
- 30.3.3.11. ADC Contract Manufacturing Market for Kenya, Historical Trends (Since 2023) and Forecasted Estimates (Till 2035)
- 30.3.3.12. ADC Contract Manufacturing Market for Peru, Historical Trends (Since 2023) and Forecasted Estimates (Till 2035)
- 30.3.3.13. ADC Contract Manufacturing Market for South Africa, Historical Trends (Since 2023) and Forecasted Estimates (Till 2035)
- 30.3.3.14. ADC Contract Manufacturing Market for Turkey, Historical Trends (Since 2023) and Forecasted Estimates (Till 2035)
- 30.3.3.15. ADC Contract Manufacturing Market for Saudi Arabia, Historical Trends (Since 2023) and Forecasted Estimates (Till 2035)
- 30.3.3.16. ADC Contract Manufacturing Market for Other Countries, Historical Trends (Since 2023) and Forecasted Estimates (Till 2035)
- 30.3.1. ADC Contract Manufacturing Market in North America, Historical Trends (Since 2023) and Forecasted Estimates (Till 2035)
- 30.4. Data Triangulation and Validation
31. COMMERCIAL ADC CONTRACT MANUFACTURING MARKET
- 31.1. Chapter Overview
- 31.2. Key Assumptions and Methodology
- 31.3. Commercial ADC Contract Manufacturing Market: Forecasted Estimates (Till 2035)
- 31.3.1. Commercial ADC Contract Manufacturing Market: Distribution by Process Component, Forecasted Estimates (Till 2035)
- 31.3.2. Commercial ADC Contract Manufacturing Market: Distribution by Type of Payload, Forecasted Estimates (Till 2035)
- 31.3.3. Commercial ADC Contract Manufacturing Market: Distribution by Antibody Origin, Forecasted Estimates (Till 2035)
- 31.3.4. Commercial ADC Contract Manufacturing Market: Distribution by Antibody Isotype, Forecasted Estimates (Till 2035)
- 31.3.5. Commercial ADC Contract Manufacturing Market: Distribution by Target Indication, Forecasted Estimates (Till 2035)
- 31.3.6. Commercial ADC Contract Manufacturing Market: Distribution by Type of Linker, Forecasted Estimates (Till 2035)
- 31.3.7. Commercial ADC Contract Manufacturing Market: Distribution by Key Geographical Regions, Forecasted Estimates (Till 2035)
- 31.4. Data Triangulation and Validation
32. CLINICAL ADC CONTRACT MANUFACTURING MARKET
- 32.1. Chapter Overview
- 32.2. Key Assumptions and Methodology
- 32.3. Clinical ADC Contract Manufacturing Market: Forecasted Estimates (Till 2035)
- 32.3.1. Clinical ADC Contract Manufacturing Market: Distribution by Phase of Development, Forecasted Estimates (Till 2035)
- 32.3.2. Clinical ADC Contract Manufacturing Market: Distribution by Process Component, Forecasted Estimates (Till 2035)
- 32.3.3. Clinical ADC Contract Manufacturing Market: Distribution by Type of Payload, Forecasted Estimates (Till 2035)
- 32.3.4. Clinical ADC Contract Manufacturing Market: Distribution by Antibody Origin, Forecasted Estimates (Till 2035)
- 32.3.5. Clinical ADC Contract Manufacturing Market: Distribution by Antibody Isotype, Forecasted Estimates (Till 2035)
- 32.3.6. Clinical ADC Contract Manufacturing Market: Distribution by Target Indication, Forecasted Estimates (Till 2035)
- 32.3.7. Clinical ADC Contract Manufacturing Market: Distribution by Type of Linker, Forecasted Estimates (Till 2035)
- 32.3.8. Clinical ADC Contract Manufacturing Market: Distribution by Key Geographical Regions, Forecasted Estimates (Till 2035)
- 32.4. Data Triangulation and Validation
33. CONCLUDING REMARKS
34. EXECUTIVE INSIGHTS
- 34.1. Chapter Overview
- 34.2. Company A
- 34.2.1. Company Snapshot
- 34.2.2. Interview Transcript: Business Development Manager
- 34.3. Company B
- 34.3.1. Company Snapshot
- 34.3.2. Interview Transcript: Chief Executive Officer and Technical Business Development Manager
- 34.4. Company C
- 34.4.1. Company Snapshot
- 34.4.2. Interview Transcript: Chief Commercial Officer
- 34.5. Company D
- 34.5.1. Company Snapshot
- 34.5.2. Interview Transcript: Associate Scientist,
- 34.6. Company E
- 34.6.1. Company Snapshot
- 34.6.2. Interview Transcript: Former Director Corporate Development
- 34.7. Company F
- 34.7.1. Company Snapshot
- 34.7.2. Interview Transcript: Executive Director and Takashi Owa, Chief Innovation Officer
- 34.8. Company G
- 34.8.1. Company Snapshot
- 34.8.2. Interview Transcript: Former Chief Business Officer
- 34.9. Company H
- 34.9.1. Company Snapshot
- 34.9.2. Interview Transcript: Former Director of CDMO
- 34.10. Company I
- 34.10.1. Company Snapshot
- 34.10.2. Interview Transcript: Director, Business Development
- 34.11. Company J
- 34.11.1. Company Snapshot
- 34.11.2. Interview Transcript: Chief Executive Officer and Co-Founder
- 34.12. Company K
- 34.12.1. Company Snapshot
- 34.12.2. Interview Transcript: Former Site Head
- 34.13. Company L
- 34.13.1. Company Snapshot
- 34.13.2. Interview Transcript: Chief Executive Officer and Founder
- 34.14. Company M
- 34.14.1. Company Snapshot
- 34.14.2. Interview Transcript: Former Chief Executive Officer
- 34.15. Company N
- 34.15.1. Company Snapshot
- 34.15.2. Interview Transcript: Former Director, Business Development and Former Group Product Manager
- 34.16. Company O
- 34.16.1. Company Snapshot
- 34.16.2. Interview Transcript: Former Head of Bioconjugates Commercial Development
- 34.17. Company P
- 34.17.1. Company Snapshot
- 34.17.2. Interview Transcript: Senior Director, Commercial Development and Marketing Strategy Bioconjugates
35. APPENDIX I: TABULATED DATA
36. APPENDIX II: LIST OF COMPANIES AND ORGANIZATION
List of Tables
- Table 6.1 Common Cytotoxins used for the Production of ADCs
- Table 6.2 Safebridge Categorization / OEL Bands for Highly Potent / Cytotoxic Compounds
- Table 7.1 ADC Contract Manufacturers: Information on Year of Establishment, Company Size, and Location of Headquarters
- Table 7.2 ADC Contract Manufacturers: Information on Type of ADC Manufacturing Service Offered
- Table 7.3 ADC Contract Manufacturers: Information on Type of Additional Service Offered and Scale of Operation
- Table 7.4 ADC Contract Manufacturers: Information on Location of Manufacturing Facility
- Table 9.1 ADC Contract Manufacturers: List of Companies Profiled
- Table 9.2 MabPlex: Company Overview
- Table 9.3 MabPlex: ADC Related Services
- Table 9.4 MabPlex: Information on Manufacturing Facilities
- Table 9.5 Lonza: Company Overview
- Table 9.6 Lonza: ADC Related Services
- Table 9.7 Lonza: Information on Manufacturing Facilities
- Table 9.8 Lonza: Recent Developments and Future Outlook
- Table 9.9 Abzena: Company Overview
- Table 9.10 Abzena: ADC Related Services
- Table 9.11 Abzena: Information on Manufacturing Facilities
- Table 9.12 Abzena: Recent Developments and Future Outlook
- Table 9.13 GBI: Company Overview
- Table 9.14 GBI: ADC Related Services
- Table 9.15 GBI: Information on Manufacturing Facilities
- Table 9.16 CARBOGEN AMCIS: Company Overview
- Table 9.17 CARBOGEN AMCIS: ADC Related Services
- Table 9.18 CARBOGEN AMCIS: Information on Manufacturing Facilities
- Table 9.19 CARBOGEN AMCIS: Recent Developments and Future Outlook
- Table 9.20 Millipore Sigma: Company Overview
- Table 9.21 Millipore Sigma: ADC Related Services
- Table 9.22 Millipore Sigma: Information on Manufacturing Facilities
- Table 9.23 WuXi Biologics: Company Overview
- Table 9.24 WuXi Biologics: ADC Related Services
- Table 9.25 WuXi Biologics: Information on Manufacturing Facilities
- Table 9.26 WuXi Biologics: Recent Developments and Future Outlook
- Table 9.27 Catalent Pharma Solutions: Company Overview
- Table 9.28 Catalent Pharma Solutions: ADC Related Services
- Table 9.29 Catalent Pharma Solutions: Information on Manufacturing Facilities
- Table 9.30 Catalent Pharma Solutions: Recent Developments and Future Outlook
- Table 9.31 Cerbios-Pharma: Company Overview
- Table 9.32 Cerbios-Pharma: ADC Related Services
- Table 9.33 Cerbios-Pharma: Information on Manufacturing Facilities
- Table 9.34 Cerbios-Pharma: Recent Developments and Future Outlook
- Table 9.35 Formosa Laboratories: Company Overview
- Table 9.36 Formosa Laboratories: ADC Related Services
- Table 9.37 Formosa Laboratories: Information on Manufacturing Facilities
- Table 9.38 Sterling Pharma Solutions: Company Overview
- Table 9.39 Sterling Pharma Solutions: ADC Related Services
- Table 9.40 Sterling Pharma Solutions: Information on Manufacturing Facilities
- Table 9.41 Sterling Pharma Solutions: Recent Developments and Future Outlook
- Table 9.42 Piramal Pharma Solutions: Company Overview
- Table 9.43 Piramal Pharma Solutions: ADC Related Services
- Table 9.44 Piramal Pharma Solutions: Information on Manufacturing Facilities
- Table 9.45 Piramal Pharma Solutions: Recent Developments and Future Outlook
- Table 9.46 AbbVie Contract Manufacturing: Company Overview
- Table 9.47 AbbVie Contract Manufacturing: ADC Related Services
- Table 9.48 AbbVie Contract Manufacturing: Information on Manufacturing Facilities
- Table 10.1 ADC Contract Manufacturers: Information on Year of Expansion, Type of Expansion, Purpose of Expansion, and Type of Facility, Since 2019
- Table 10.2 ADC Contract Manufacturers: Information on Location of Expanded Facility and Scale of Operation
- Table 11.1 ADC Contract Manufacturers: Information on Year of Partnership, Type of Partnership, and Scale of Operation, Since 2020
- Table 13.1 ADC Components: Information on Cost of Cytotoxins
- Table 13.2 ADC Components: Information on Cost of Linkers
- Table 14.1 Global Installed ADC Contract Manufacturing Capacity: Sample Data Set (Yield)
- Table 14.2 Global Installed ADC Contract Manufacturing Capacity: Sample Data Set (Average Capacity)
- Table 14.3 Global Installed ADC Manufacturing Capacity: Information on Total Capacity based on Company Size
- Table 15.1 ADC Therapeutics: Information on Drug Candidates, Developers, Status of Development, Target Disease Indication and Therapeutic Area
- Table 15.2 ADC Therapeutics to Watch: Information on Drug Candidates, Developer, Status of Development, Target Disease Indication and Therapeutic Area
- Table 17.1 Most Likely Partners based in North America
- Table 17.2 Likely Partners based in North America
- Table 17.3 Least Likely Partners based in North America
- Table 17.4 Most Likely Partners based in Europe
- Table 17.5 Likely Partners based in Europe
- Table 17.6 Least Likely Partners based in Europe
- Table 17.7 Most Likely Partners based in Asia-Pacific and Rest of the World
- Table 17.8 Likely Partners based in Asia-Pacific and Rest of the World
- Table 17.9 Least Likely Partners based in Asia-Pacific and Rest of the World
- Table 18.1 List of Late Stage ADCs
- Table 34.1 Cerbios-Pharma: Key Highlights
- Table 34.2 BSP Biopharmaceuticals: Key Highlights
- Table 34.3 Cerbios-Pharma: Key Highlights
- Table 34.4 Ajinomoto Bio-Pharma Services: Key Highlights
- Table 34.5 GBI: Key Highlights
- Table 34.6 Eisai: Key Highlights
- Table 34.7 NBE-Therapeutics: Key Highlights
- Table 34.8 Pierre Fabre: Key Highlights
- Table 34.9 Synaffix: Key Highlights
- Table 6.3 Common Cytotoxins used for the Production of ADCs
- Table 6.4 Safebridge Categorization / OEL Bands for Highly Potent / Cytotoxic Compounds
- Table 7.5 ADC Contract Manufacturers: Information on Year of Establishment, Company Size, and Location of Headquarters
- Table 7.6 ADC Contract Manufacturers: Information on Type of ADC Manufacturing Service Offered
- Table 7.7 ADC Contract Manufacturers: Information on Type of Additional Service Offered and Scale of Operation
- Table 7.8 ADC Contract Manufacturers: Information on Location of Manufacturing Facility
- Table 9.49 ADC Contract Manufacturers: List of Companies Profiled
- Table 9.50 MabPlex: Company Overview
- Table 9.51 MabPlex: ADC Related Services
- Table 9.52 MabPlex: Information on Manufacturing Facilities
- Table 9.53 Lonza: Company Overview
- Table 9.54 Lonza: ADC Related Services
- Table 9.55 Lonza: Information on Manufacturing Facilities
- Table 9.56 Lonza: Recent Developments and Future Outlook
- Table 9.57 Abzena: Company Overview
- Table 9.58 Abzena: ADC Related Services
- Table 9.59 Abzena: Information on Manufacturing Facilities
- Table 9.60 Abzena: Recent Developments and Future Outlook
- Table 9.61 GBI: Company Overview
- Table 9.62 GBI: ADC Related Services
- Table 9.63 GBI: Information on Manufacturing Facilities
- Table 9.64 CARBOGEN AMCIS: Company Overview
- Table 9.65 CARBOGEN AMCIS: ADC Related Services
- Table 9.66 CARBOGEN AMCIS: Information on Manufacturing Facilities
- Table 9.67 CARBOGEN AMCIS: Recent Developments and Future Outlook
- Table 9.68 Millipore Sigma: Company Overview
- Table 9.69 Millipore Sigma: ADC Related Services
- Table 9.70 Millipore Sigma: Information on Manufacturing Facilities
- Table 9.71 WuXi Biologics: Company Overview
- Table 9.72 WuXi Biologics: ADC Related Services
- Table 9.73 WuXi Biologics: Information on Manufacturing Facilities
- Table 9.74 WuXi Biologics: Recent Developments and Future Outlook
- Table 9.75 Catalent Pharma Solutions: Company Overview
- Table 9.76 Catalent Pharma Solutions: ADC Related Services
- Table 9.77 Catalent Pharma Solutions: Information on Manufacturing Facilities
- Table 9.78 Catalent Pharma Solutions: Recent Developments and Future Outlook
- Table 9.79 Cerbios-Pharma: Company Overview
- Table 9.80 Cerbios-Pharma: ADC Related Services
- Table 9.81 Cerbios-Pharma: Information on Manufacturing Facilities
- Table 9.82 Cerbios-Pharma: Recent Developments and Future Outlook
- Table 9.83 Formosa Laboratories: Company Overview
- Table 9.84 Formosa Laboratories: ADC Related Services
- Table 9.85 Formosa Laboratories: Information on Manufacturing Facilities
- Table 9.86 Sterling Pharma Solutions: Company Overview
- Table 9.87 Sterling Pharma Solutions: ADC Related Services
- Table 9.88 Sterling Pharma Solutions: Information on Manufacturing Facilities
- Table 9.89 Sterling Pharma Solutions: Recent Developments and Future Outlook
- Table 9.90 Piramal Pharma Solutions: Company Overview
- Table 9.91 Piramal Pharma Solutions: ADC Related Services
- Table 9.92 Piramal Pharma Solutions: Information on Manufacturing Facilities
- Table 9.93 Piramal Pharma Solutions: Recent Developments and Future Outlook
- Table 9.94 AbbVie Contract Manufacturing: Company Overview
- Table 9.95 AbbVie Contract Manufacturing: ADC Related Services
- Table 9.96 AbbVie Contract Manufacturing: Information on Manufacturing Facilities
- Table 10.3 ADC Contract Manufacturers: Information on Year of Expansion, Type of Expansion, Purpose of Expansion, and Type of Facility, Since 2019
- Table 10.4 ADC Contract Manufacturers: Information on Location of Expanded Facility and Scale of Operation
- Table 11.2 ADC Contract Manufacturers: Information on Year of Partnership, Type of Partnership, and Scale of Operation, Since 2020
- Table 13.3 ADC Components: Information on Cost of Cytotoxins
- Table 13.4 ADC Components: Information on Cost of Linkers
- Table 14.4 Global Installed ADC Contract Manufacturing Capacity: Sample Data Set (Yield)
- Table 14.5 Global Installed ADC Contract Manufacturing Capacity: Sample Data Set (Average Capacity)
- Table 14.6 Global Installed ADC Manufacturing Capacity: Information on Total Capacity based on Company Size
- Table 15.3 ADC Therapeutics: Information on Drug Candidates, Developers, Status of Development, Target Disease Indication and Therapeutic Area
- Table 15.4 ADC Therapeutics to Watch: Information on Drug Candidates, Developer, Status of Development, Target Disease Indication and Therapeutic Area
- Table 17.10 Most Likely Partners based in North America
- Table 17.11 Likely Partners based in North America
- Table 17.12 Least Likely Partners based in North America
- Table 17.13 Most Likely Partners based in Europe
- Table 17.14 Likely Partners based in Europe
- Table 17.15 Least Likely Partners based in Europe
- Table 17.16 Most Likely Partners based in Asia-Pacific and Rest of the World
- Table 17.17 Likely Partners based in Asia-Pacific and Rest of the World
- Table 17.18 Least Likely Partners based in Asia-Pacific and Rest of the World
- Table 18.2 List of Late Stage ADCs
- Table 34.10 Cerbios-Pharma: Key Highlights
- Table 34.11 BSP Biopharmaceuticals: Key Highlights
- Table 34.12 Cerbios-Pharma: Key Highlights
- Table 34.13 Ajinomoto Bio-Pharma Services: Key Highlights
- Table 34.14 GBI: Key Highlights
- Table 34.15 Eisai: Key Highlights
- Table 34.16 NBE-Therapeutics: Key Highlights
- Table 34.17 Pierre Fabre: Key Highlights
- Table 34.18 Synaffix: Key Highlights
- Table 34.19 Syndivia: Key Highlights
- Table 34.20 Piramal Pharma Solutions: Key Highlights
- Table 34.21 Oxford BioTherapeutics: Key Highlights
- Table 34.22 Abzena: Key Highlights
- Table 34.23 Catalent Pharma Solutions: Key Highlights
- Table 34.24 Lonza: Key Highlights
- Table 34.25 Lonza: Key Highlights
- Table 35.1 ADC Contract Manufacturers: Distribution by Year of Establishment
- Table 35.2 ADC Contract Manufacturers: Distribution by Company Size
- Table 35.3 ADC Contract Manufacturers: Distribution by Location of Headquarters
- Table 35.4 ADC Contract Manufacturers: Distribution by Type of ADC Manufacturing Service Offered
- Table 35.5 ADC Contract Manufacturers: Distribution by Type of Additional Service Offered
- Table 35.6 ADC Contract Manufacturers: Distribution by Scale of Operation
- Table 35.7 ADC Contract Manufacturers: Distribution by Location of Manufacturing Facility
- Table 35.8 Lonza: Annual Revenues, (YEN Billion), Since 2021
- Table 35.9 WuXi Biologics: Annual Revenues, (CHF Billion), Since 2021
- Table 35.10 Catalent Pharma Solutions: Annual Revenues, (USD Billion), Since 2021
- Table 35.11 Recent Expansions: Distribution by Year of Expansion
- Table 35.12 Recent Expansions: Distribution by Type of Expansion
- Table 35.13 Recent Expansions: Distribution by Purpose of Expansion
- Table 35.14 Recent Expansions: Distribution by Type of Facility
- Table 35.15 Recent Expansions: Distribution by Scale of Operation
- Table 35.16 Recent Expansions: Distribution by Location of Expanded Facility
- Table 35.17 Most Active Players: Distribution by Number of Expansion Initiatives
- Table 35.18 Partnerships and Collaborations: Distribution by Year of Partnership
- Table 35.19 Partnerships and Collaborations: Distribution by Type of Partnership
- Table 35.20 Partnerships and Collaborations: Distribution by Year and Type of Partnership
- Table 35.21 Partnerships and Collaborations: Distribution by Purpose of Partnership
- Table 35.22 Partnerships and Collaborations: Distribution by Scale of Operation
- Table 35.23 Most Active Players: Distribution by Number of Partnerships
- Table 35.24 Global Installed ADC Manufacturing Capacity: Distribution by Company Size
- Table 35.25 Global Installed ADC Manufacturing Capacity: Distribution by Location of Headquarters
- Table 35.26 Global Installed ADC Manufacturing Capacity: Distribution by Location of Manufacturing Facility (Region)
- Table 35.27 Global Installed ADC Manufacturing Capacity: Distribution by Location of Manufacturing Facility (Country)
- Table 35.28 Global Installed ADC Manufacturing Capacity: Distribution by Key Players
- Table 35.29 ADC Therapeutics: Distribution by Status of Development
- Table 35.30 ADC Therapeutics: Distribution by Target Disease Indication
- Table 35.31 ADC Therapeutics: Distribution by Therapeutic Area
- Table 35.32 ADC Therapeutics: Distribution by Line of Treatment
- Table 35.33 ADC Therapeutics: Distribution by Dosing Frequency
- Table 35.34 ADC Therapeutics: Distribution by Type of Therapy
- Table 35.35 ADC Therapeutics: Distribution by Target Antigen
- Table 35.36 ADC Therapeutics: Distribution by Antibody Isotype
- Table 35.37 ADC Therapeutics: Distribution by Payload / Cytotoxin / Warhead
- Table 35.38 ADC Therapeutics: Distribution by Type of Payload
- Table 35.39 ADC Therapeutics: Distribution by Linker
- Table 35.40 ADC Therapeutics: Distribution by Type of Linker
- Table 35.41 Clinical Trial Analysis: Cumulative Year-wise Trend, Since 2021
- Table 35.42 Clinical Trial Analysis: Distribution of Number of Patients Enrolled by Trial Registration Year, Since 2021
- Table 35.43 Clinical Trial Analysis: Distribution by Trial Phase
- Table 35.44 Clinical Trial Analysis: Distribution of Number of Patients Enrolled by Trial Phase
- Table 35.45 Clinical Trial Analysis: Distribution by Trial Status
- Table 35.46 Clinical Trial Analysis: Distribution by Trial Registration Year and Trial Status, Since 2021
- Table 35.47 Clinical Trial Analysis: Distribution of Number of Patients Enrolled by Trial Status
- Table 35.48 Clinical Trial Analysis: Distribution by Patient Gender
- Table 35.49 Clinical Trial Analysis: Distribution by Type of Allocation
- Table 35.50 Clinical Trial Analysis: Distribution by Type of Intervention Model
- Table 35.51 Clinical Trial Analysis: Distribution by Type of Masking
- Table 35.52 Clinical Trial Analysis: Distribution by Trial Purpose
- Table 35.53 Clinical Trial Analysis: Distribution by Type of Sponsor / Collaborator
- Table 35.54 Leading Industry Players: Distribution by Number of Clinical Trials
- Table 35.55 Leading Non-Industry Players: Distribution by Number of Clinical Trials
- Table 35.56 Clinical Trial Analysis: Distribution of Clinical Trials by Geography
- Table 35.57 Clinical Trial Analysis: Distribution of Clinical Trials by Geography and Trial Status
- Table 35.58 Clinical Trial Analysis: Distribution of Patients Enrolled by Geography and Trial Status
- Table 35.59 Global Demand for ADC Therapeutics, till 2035 (in kg)
- Table 35.60 Global Demand for ADC Therapeutics: Distribution by Stage of Development, till 2035 (in kg)
- Table 35.61 Global Commercial Demand for ADC Therapeutics, till 2035 (in kg)
- Table 35.62 Global Commercial Demand for ADC Therapeutics: Distribution by Target Indication, till 2035 (in kg)
- Table 35.63 Global Commercial Demand for ADC Therapeutics: Distribution by Antibody Origin, till 2035 (in kg)
- Table 35.64 Global Commercial Demand for ADC Therapeutics: Distribution by Antibody Isotype, till 2035 (in kg)
- Table 35.65 Global Commercial Demand for ADC Therapeutics: Distribution by Type of Payload, till 2035 (in kg)
- Table 35.66 Global Commercial Demand for ADC Therapeutics: Distribution by Type of Linker, till 2035 (in kg)
- Table 35.67 Global Commercial Demand for ADC Therapeutics: Distribution by Key Geographical Regions, till 2035 (in kg)
- Table 35.68 Global Clinical Demand for ADC Therapeutics, till 2035 (in kg)
- Table 35.69 Global Clinical Demand for ADC Therapeutics: Distribution by Phase of Development, till 2035 (in kg)
- Table 35.70 Global Clinical Demand for ADC Therapeutics: Distribution by Target Indication, till 2035 (in kg)
- Table 35.71 Global Clinical Demand for ADC Therapeutics: Distribution by Antibody Origin, till 2035 (in kg)
- Table 35.72 Global Clinical Demand for ADC Therapeutics: Distribution by Antibody Isotype, till 2035 (in kg)
- Table 35.73 Global Clinical Demand for ADC Therapeutics: Distribution by Type of Payload, till 2035 (in kg)
- Table 35.74 Global Clinical Demand for ADC Therapeutics: Distribution by Type of Linker, till 2035 (in kg)
- Table 35.75 Global Clinical Demand for ADC Therapeutics: Distribution by Key Geographical Regions, till 2035 (in kg)
- Table 35.76 Regional Capability Analysis: ADC Contract Manufacturing Capabilities in North America
- Table 35.77 Regional Capability Analysis: ADC Contract Manufacturing Capabilities in Europe
- Table 35.78 Regional Capability Analysis: ADC Contract Manufacturing Capabilities in Asia-Pacific and Rest of the World
- Table 35.79 Global ADC Contract Manufacturing Market, Historical Trends (Since 2023) and Forecasted Estimates (Till 2035): Base Scenario (USD Billion)
- Table 35.80 Global ADC Contract Manufacturing Market, Historical Trends (Since 2023) and Forecasted Estimates (Till 2035): Conservative Scenario (USD Billion)
- Table 35.81 Global ADC Contract Manufacturing Market, Historical Trends (Since 2023) and Forecasted Estimates (Till 2035): Optimistic Scenario (USD Billion)
- Table 35.82 Global ADC Contract Manufacturing Market: Distribution by Scale of Operation
- Table 35.83 ADC Contract Manufacturing Market for Clinical Scale: Historical Trends (Since 2023) and Forecasted Estimates (Till 2035) (USD Billion)
- Table 35.84 ADC Contract Manufacturing Market for Commercial Scale: Historical Trends (Since 2023) and Forecasted Estimates (Till 2035) (USD Billion)
- Table 35.85 ADC Contract Manufacturing Market: Distribution by Process Component
- Table 35.86 ADC Contract Manufacturing Market for Antibodies: Historical Trends (Since 2023) and Forecasted Estimates (Till 2035) (USD Billion)
- Table 35.87 ADC Contract Manufacturing Market for HPAPI / Cytotoxic Payloads: Historical Trends (Since 2023) and Forecasted Estimates (Till 2035) (USD Billion)
- Table 35.88 ADC Contract Manufacturing Market for Conjugation / Linkers: Historical Trends (Since 2023) and Forecasted Estimates (Till 2035) (USD Billion)
- Table 35.89 ADC Contract Manufacturing Market for Fill / Finish: Historical Trends (Since 2023) and Forecasted Estimates (Till 2035) (USD Billion)
- Table 35.90 ADC Contract Manufacturing Market: Distribution by Type of Payload
- Table 35.91 ADC Contract Manufacturing Market for Tubulin Inhibitors: Historical Trends (Since 2023) and Forecasted Estimates (Till 2035) (USD Billion)
- Table 35.92 ADC Contract Manufacturing Market for Topoisomerase Inhibitors: Historical Trends (Since 2023) and Forecasted Estimates (Till 2035) (USD Billion)
- Table 35.93 ADC Contract Manufacturing Market for DNA Damaging Agents: Historical Trends (Since 2023) and Forecasted Estimates (Till 2035) (USD Billion)
- Table 35.94 ADC Contract Manufacturing Market for Others: Historical Trends (Since 2023) and Forecasted Estimates (Till 2035) (USD Billion)
- Table 35.95 ADC Contract Manufacturing Market: Distribution by Antibody Origin
- Table 35.96 ADC Contract Manufacturing Market for Humanized: Historical Trends (Since 2023) and Forecasted Estimates (Till 2035) (USD Billion)
- Table 35.97 ADC Contract Manufacturing Market for Chimeric: Historical Trends (Since 2023) and Forecasted Estimates (Till 2035) (USD Billion)
- Table 35.98 ADC Contract Manufacturing Market for Human: Historical Trends (Since 2023) and Forecasted Estimates (Till 2035) (USD Billion)
- Table 35.99 ADC Contract Manufacturing Market for Others: Historical Trends (Since 2023) and Forecasted Estimates (Till 2035) (USD Billion)
- Table 35.100 ADC Contract Manufacturing Market: Distribution by Antibody Isotype
- Table 35.101 ADC Contract Manufacturing Market for IgG1: Historical Trends (Since 2023) and Forecasted Estimates (Till 2035) (USD Billion)
- Table 35.102 ADC Contract Manufacturing Market for IgG4: Historical Trends (Since 2023) and Forecasted Estimates (Till 2035) (USD Billion)
- Table 35.103 ADC Contract Manufacturing Market for Others: Historical Trends (Since 2023) and Forecasted Estimates (Till 2035) (USD Billion)
- Table 35.104 ADC Contract Manufacturing Market: Distribution by Target Indication
- Table 35.105 ADC Contract Manufacturing Market for Solid Tumors: Historical Trends (Since 2023) and Forecasted Estimates (Till 2035) (USD Billion)
- Table 35.106 ADC Contract Manufacturing Market for Hematological Malignancies: Historical Trends (Since 2023) and Forecasted Estimates (Till 2035) (USD Billion)
- Table 35.107 ADC Contract Manufacturing Market: Distribution by Type of Linker
- Table 35.108 ADC Contract Manufacturing Market for Valine-citrulline: Historical Trends (Since 2023) and Forecasted Estimates (Till 2035) (USD Billion)
- Table 35.109 ADC Contract Manufacturing Market for SMCC: Historical Trends (Since 2023) and Forecasted Estimates (Till 2035) (USD Billion)
- Table 35.110 ADC Contract Manufacturing Market for Hydrazone SMCC: Historical Trends (Since 2023) and Forecasted Estimates (Till 2035) (USD Billion)
- Table 35.111 ADC Contract Manufacturing Market for Maleimide: Historical Trends (Since 2023) and Forecasted Estimates (Till 2035) (USD Billion)
- Table 35.112 ADC Contract Manufacturing Market for Maleimidocaproyl: Historical Trends (Since 2023) and Forecasted Estimates (Till 2035) (USD Billion)
- Table 35.113 ADC Contract Manufacturing Market for Tetrapeptide-based Linkers: Historical Trends (Since 2023) and Forecasted Estimates (Till 2035) (USD Billion)
- Table 35.114 ADC Contract Manufacturing Market for Peptide Linkers: Historical Trends (Since 2023) and Forecasted Estimates (Till 2035) (USD Billion)
- Table 35.115 ADC Contract Manufacturing Market for Others: Historical Trends (Since 2023) and Forecasted Estimates (Till 2035) (USD Billion)
- Table 35.116 ADC Contract Manufacturing Market: Distribution by Key Geographical Regions
- Table 35.117 ADC Contract Manufacturing Market in North America: Historical Trends (Since 2023) and Forecasted Estimates (Till 2035) (USD Billion)
- Table 35.118 ADC Contract Manufacturing Market in the US: Historical Trends (Since 2023) and Forecasted Estimates (Till 2035) (USD Billion)
- Table 35.119 ADC Contract Manufacturing Market in Canada: Historical Trends (Since 2023) and Forecasted Estimates (Till 2035) (USD Billion)
- Table 35.120 ADC Contract Manufacturing Market in Rest of North America: Historical Trends (Since 2023) and Forecasted Estimates (Till 2035) (USD Billion)
- Table 35.121 ADC Contract Manufacturing Market in Europe: Historical Trends (Since 2023) and Forecasted Estimates (Till 2035) (USD Billion)
- Table 35.122 ADC Contract Manufacturing Market in the UK: Historical Trends (Since 2023) and Forecasted Estimates (Till 2035) (USD Billion)
- Table 35.123 ADC Contract Manufacturing Market in Spain: Historical Trends (Since 2023) and Forecasted Estimates (Till 2035) (USD Billion)
- Table 35.124 ADC Contract Manufacturing Market in Italy: Historical Trends (Since 2023) and Forecasted Estimates (Till 2035) (USD Billion)
- Table 35.125 ADC Contract Manufacturing Market in Germany: Historical Trends (Since 2023) and Forecasted Estimates (Till 2035) (USD Billion)
- Table 35.126 ADC Contract Manufacturing Market in France: Historical Trends (Since 2023) and Forecasted Estimates (Till 2035) (USD Billion)
- Table 35.127 ADC Contract Manufacturing Market in Rest of Europe: Historical Trends (Since 2023) and Forecasted Estimates (Till 2035) (USD Billion)
- Table 35.128 ADC Contract Manufacturing Market in Asia-Pacific and Rest of the World: Historical Trends (Since 2023) and Forecasted Estimates (Till 2035) (USD Billion)
- Table 35.129 ADC Contract Manufacturing Market in China: Historical Trends (Since 2023) and Forecasted Estimates (Till 2035) (USD Billion)
- Table 35.130 ADC Contract Manufacturing Market in Japan: Historical Trends (Since 2023) and Forecasted Estimates (Till 2035) (USD Billion)
- Table 35.131 ADC Contract Manufacturing Market in India: Historical Trends (Since 2023) and Forecasted Estimates (Till 2035) (USD Billion)
- Table 35.132 ADC Contract Manufacturing Market in South Korea: Historical Trends (Since 2023) and Forecasted Estimates (Till 2035) (USD Billion)
- Table 35.133 ADC Contract Manufacturing Market in Australia: Historical Trends (Since 2023) and Forecasted Estimates (Till 2035) (USD Billion)
- Table 35.134 ADC Contract Manufacturing Market in Argentina: Historical Trends (Since 2023) and Forecasted Estimates (Till 2035) (USD Billion)
- Table 35.135 ADC Contract Manufacturing Market in Brazil: Historical Trends (Since 2023) and Forecasted Estimates (Till 2035) (USD Billion)
- Table 35.136 ADC Contract Manufacturing Market in Chile: Historical Trends (Since 2023) and Forecasted Estimates (Till 2035) (USD Billion)
- Table 35.137 ADC Contract Manufacturing Market in Colombia: Historical Trends (Since 2023) and Forecasted Estimates (Till 2035) (USD Billion)
- Table 35.138 ADC Contract Manufacturing Market in Israel: Historical Trends (Since 2023) and Forecasted Estimates (Till 2035) (USD Billion)
- Table 35.139 ADC Contract Manufacturing Market in Kenya: Historical Trends (Since 2023) and Forecasted Estimates (Till 2035) (USD Billion)
- Table 35.140 ADC Contract Manufacturing Market in Peru: Historical Trends (Since 2023) and Forecasted Estimates (Till 2035) (USD Billion)
- Table 35.141 ADC Contract Manufacturing Market in South Africa: Historical Trends (Since 2023) and Forecasted Estimates (Till 2035) (USD Billion)
- Table 35.142 ADC Contract Manufacturing Market in Turkey: Historical Trends (Since 2023) and Forecasted Estimates (Till 2035) (USD Billion)
- Table 35.143 ADC Contract Manufacturing Market in Saudi Arabia: Historical Trends (Since 2023) and Forecasted Estimates (Till 2035) (USD Billion)
- Table 35.144 ADC Contract Manufacturing Market in Other Countries: Historical Trends (Since 2023) and Forecasted Estimates (Till 2035) (USD Billion)
- Table 35.145 Commercial ADC Contract Manufacturing Market, Forecasted Estimates, till 2035 (USD Million)
- Table 35.146 Commercial ADC Contract Manufacturing Market: Distribution by Process Component, Forecasted Estimates, till 2035 (USD Million)
- Table 35.147 Commercial ADC Contract Manufacturing Market: Distribution by Type of Payload, Forecasted Estimates, till 2035 (USD Million)
- Table 35.148 Commercial ADC Contract Manufacturing Market: Distribution by Antibody Origin, Forecasted Estimates, till 2035 (USD Million)
- Table 35.149 Commercial ADC Contract Manufacturing Market: Distribution by Antibody Isotype, Forecasted Estimates, till 2035 (USD Million)
- Table 35.150 Commercial ADC Contract Manufacturing Market: Distribution by Target Indication, Forecasted Estimates, till 2035 (USD Million)
- Table 35.151 Commercial ADC Contract Manufacturing Market: Distribution by Type of Linker, Forecasted Estimates, till 2035 (USD Million)
- Table 35.152 Commercial ADC Contract Manufacturing Market: Distribution by Key Geographical Regions, Forecasted Estimates, till 2035 (USD Million)
- Table 35.153 Clinical ADC Contract Manufacturing Market, Forecasted Estimates, till 2035 (USD Million)
- Table 35.154 Clinical ADC Contract Manufacturing Market: Distribution by Phase of Development, Forecasted Estimates, till 2035 (USD Million)
- Table 35.155 Clinical ADC Contract Manufacturing Market: Distribution by Process Component, Forecasted Estimates, till 2035 (USD Million)
- Table 35.156 Clinical ADC Contract Manufacturing Market: Distribution by Type of Payload, Forecasted Estimates, till 2035 (USD Million)
- Table 35.157 Clinical ADC Contract Manufacturing Market: Distribution by Antibody Origin, Forecasted Estimates, till 2035 (USD Million)
- Table 35.158 Clinical ADC Contract Manufacturing Market: Distribution by Antibody Isotype, Forecasted Estimates, till 2035 (USD Million)
- Table 35.159 Clinical ADC Contract Manufacturing Market: Distribution by Target Indication, Forecasted Estimates, till 2035 (USD Million)
- Table 35.160 Clinical ADC Contract Manufacturing Market: Distribution by Type of Linker, Forecasted Estimates, till 2035 (USD Million)
- Table 35.161 Clinical ADC Contract Manufacturing Market: Distribution by Key Geographical Regions, Forecasted Estimates, till 2035 (USD Million)
List of Figures
- Figure 2.1 Research Methodology: Project Methodology
- Figure 2.2 Research Methodology: Data Sources for Secondary Research
- Figure 2.3 Research Methodology: Robust Quality Control
- Figure 3.1 Market Dynamics: Forecast Methodology
- Figure 3.2 Market Dynamics: Market Assessment Framework
- Figure 4.1 Lessons Learnt from Past Recessions
- Figure 5.1 Executive Summary: Market Landscape
- Figure 5.2 Executive Summary: Market Trends
- Figure 5.3 Executive Summary: Capacity and Demand Analysis
- Figure 5.4 Executive Summary: Market Forecast and Opportunity Analysis
- Figure 6.1 Key Components of an ADC
- Figure 6.2 ADC Manufacturing Steps
- Figure 6.3 Key Parameters while Selecting a CMO Partner
- Figure 7.1 ADC Contract Manufacturers: Distribution by Year of Establishment
- Figure 7.2 ADC Contract Manufacturers: Distribution by Company Size
- Figure 7.3 ADC Contract Manufacturers: Distribution by Location of Headquarters
- Figure 7.4 ADC Contract Manufacturers: Distribution by Type of ADC Manufacturing Service Offered
- Figure 7.5 ADC Contract Manufacturers: Distribution by Type of Additional Service Offered
- Figure 7.6 ADC Contract Manufacturers: Distribution by Scale of Operation
- Figure 7.7 ADC Contract Manufacturers: Distribution by Location of Manufacturing Facility
- Figure 8.1 Company Competitiveness Analysis: Overview of Peer Group I
- Figure 8.2 Company Competitiveness Analysis: Overview of Peer Group II
- Figure 8.3 Company Competitiveness Analysis: Overview of Peer Group III
- Figure 8.4 Company Competitiveness Analysis: ADC Contract Manufacturing Services Offered by Companies based in North America
- Figure 8.5 Company Competitiveness Analysis: ADC Contract Manufacturing Services Offered by Companies based in Europe
- Figure 8.6 Company Competitiveness Analysis: ADC Contract Manufacturing Services Offered by Companies based in Asia-Pacific
- Figure 9.1 Lonza: Annual Revenues, (YEN Billion), Since 2021
- Figure 9.2 WuXi Biologics: Annual Revenues, (CHF Billion), Since 2021
- Figure 9.3 Catalent Pharma Solutions: Annual Revenues, (USD Billion), Since 2021
- Figure 10.1 Recent Expansions: Distribution by Year of Expansion
- Figure 10.2 Recent Expansions: Distribution by Type of Expansion
- Figure 10.3 Recent Expansions: Distribution by Purpose of Expansion
- Figure 10.4 Recent Expansions: Distribution by Type of Facility
- Figure 10.5 Recent Expansions: Distribution by Scale of Operation
- Figure 10.6 Recent Expansions: Distribution by Location of Expanded Facility
- Figure 10.7 Most Active Players: Distribution by Number of Expansion Initiatives
- Figure 11.1 Partnerships and Collaborations: Distribution by Year of Partnership
- Figure 11.2 Partnerships and Collaborations: Distribution by Type of Partnership
- Figure 11.3 Partnerships and Collaborations: Distribution by Year and Type of Partnership
- Figure 11.4 Partnerships and Collaborations: Distribution by Purpose of Partnership
- Figure 11.5 Partnerships and Collaborations: Distribution by Scale of Operation
- Figure 11.6 Most Active Players: Distribution by Number of Partnerships
- Figure 11.7 Partnerships and Collaborations: Intercontinental and Intracontinental Agreements
- Figure 11.8 Partnerships and Collaborations: Local and International Agreements
- Figure 12.1 Make versus Buy Decision Making Framework
- Figure 12.2 Make versus Buy Decision Making: Possible Scenario Descriptions
- Figure 13.1 Value Chain Analysis: ADC Development Overview
- Figure 13.2 Value Chain Analysis: ADC Contract Manufacturing Overview
- Figure 13.3 ADC Therapeutics: Distribution by Cost of Raw Material Required for Clinical Stage Manufacturing
- Figure 13.4 Value Chain Analysis: Distribution by Cost
- Figure 13.5 Costs Associated with Antibody Manufacturing
- Figure 13.6 Costs Associated with Payload and Linker Manufacturing
- Figure 13.7 Costs Associated with Conjugation
- Figure 13.8 Costs Associated with Fill / Finish
- Figure 14.1 Global Installed ADC Manufacturing Capacity: Distribution by Company Size
- Figure 14.2 Global Installed ADC Manufacturing Capacity: Distribution by Location of Headquarters
- Figure 14.3 Global Installed ADC Manufacturing Capacity: Distribution by Location of Manufacturing Facility (Region)
- Figure 14.4 Global Installed ADC Manufacturing Capacity: Distribution by Location of Manufacturing Facility (Country)
- Figure 14.5 Global Installed ADC Manufacturing Capacity: Distribution by Key Players
- Figure 15.1 ADC Therapeutics: Distribution by Status of Development
- Figure 15.2 ADC Therapeutics: Distribution by Target Disease Indication
- Figure 15.3 ADC Therapeutics: Distribution by Therapeutic Area
- Figure 15.4 ADC Therapeutics: Distribution by Line of Treatment
- Figure 15.5 ADC Therapeutics: Distribution by Dosing Frequency
- Figure 15.6 ADC Therapeutics: Distribution by Type of Therapy
- Figure 15.7 ADC Therapeutics: Distribution by Target Antigen
- Figure 15.8 ADC Therapeutics: Distribution by Antibody Isotype
- Figure 15.9 ADC Therapeutics: Distribution by Payload / Cytotoxin / Warhead
- Figure 15.10 ADC Therapeutics: Distribution by Type of Payload
- Figure 15.11 ADC Therapeutics: Distribution by Linker
- Figure 15.12 ADC Therapeutics: Distribution by Type of Linker
- Figure 16.1 Clinical Trial Analysis: Cumulative Year-wise Trend, Since 2021
- Figure 16.2 Clinical Trial Analysis: Distribution of Number of Patients Enrolled by Trial Registration Year, Since 2021
- Figure 16.3 Clinical Trial Analysis: Distribution by Trial Phase
- Figure 16.4 Clinical Trial Analysis: Distribution of Number of Patients Enrolled by Trial Phase
- Figure 16.5 Clinical Trial Analysis: Distribution by Trial Status
- Figure 16.6 Clinical Trial Analysis: Distribution by Trial Registration Year and Trial Status, Since 2021
- Figure 16.7 Clinical Trial Analysis: Distribution of Number of Patients Enrolled by Trial Status
- Figure 16.8 Clinical Trial Analysis: Distribution by Patient Gender
- Figure 16.9 Clinical Trial Analysis: Distribution by Type of Allocation
- Figure 16.10 Clinical Trial Analysis: Distribution by Type of Intervention Model
- Figure 16.11 Clinical Trial Analysis: Distribution by Type of Masking
- Figure 16.12 Clinical Trial Analysis: Distribution by Trial Purpose
- Figure 16.13 Clinical Trial Analysis: Distribution by Type of Sponsor / Collaborator
- Figure 16.14 Leading Industry Players: Distribution by Number of Clinical Trials
- Figure 16.15 Leading Non-Industry Players: Distribution by Number of Clinical Trials
- Figure 16.16 Clinical Trial Analysis: Distribution of Clinical Trials by Geography
- Figure 16.17 Clinical Trial Analysis: Distribution of Clinical Trials by Geography and Trial Status
- Figure 16.18 Clinical Trial Analysis: Distribution of Patients Enrolled by Geography and Trial Status
- Figure 18.1 Global Demand for ADC Therapeutics, till 2035 (in kg)
- Figure 18.2 Global Demand for ADC Therapeutics: Distribution by Stage of Development, till 2035 (in kg)
- Figure 18.3 Global Commercial Demand for ADC Therapeutics, till 2035 (in kg)
- Figure 18.4 Global Commercial Demand for ADC Therapeutics: Distribution by Target Indication, till 2035 (in kg)
- Figure 18.5 Global Commercial Demand for ADC Therapeutics: Distribution by Antibody Origin, till 2035 (in kg)
- Figure 18.6 Global Commercial Demand for ADC Therapeutics: Distribution by Antibody Isotype, till 2035 (in kg)
- Figure 18.7 Global Commercial Demand for ADC Therapeutics: Distribution by Type of Payload, till 2035 (in kg)
- Figure 18.8 Global Commercial Demand for ADC Therapeutics: Distribution by Type of Linker, till 2035 (in kg)
- Figure 18.9 Global Commercial Demand for ADC Therapeutics: Distribution by Key Geographical Regions, till 2035 (in kg)
- Figure 18.10 Global Clinical Demand for ADC Therapeutics, till 2035 (in kg)
- Figure 18.11 Global Clinical Demand for ADC Therapeutics: Distribution by Phase of Development, till 2035 (in kg)
- Figure 18.12 Global Clinical Demand for ADC Therapeutics: Distribution by Target Indication, till 2035 (in kg)
- Figure 18.13 Global Clinical Demand for ADC Therapeutics: Distribution by Antibody Origin, till 2035 (in kg)
- Figure 18.14 Global Clinical Demand for ADC Therapeutics: Distribution by Antibody Isotype, till 2035 (in kg)
- Figure 18.15 Global Clinical Demand for ADC Therapeutics: Distribution by Type of Payload, till 2035 (in kg)
- Figure 18.16 Global Clinical Demand for ADC Therapeutics: Distribution by Type of Linker, till 2035 (in kg)
- Figure 18.17 Global Clinical Demand for ADC Therapeutics: Distribution by Key Geographical Regions, till 2035 (in kg)
- Figure 19.1 Regional Capability Analysis: ADC Contract Manufacturing Capabilities in North America
- Figure 19.2 Regional Capability Analysis: ADC Contract Manufacturing Capabilities in Europe
- Figure 19.3 Regional Capability Analysis: ADC Contract Manufacturing Capabilities in Asia-Pacific and Rest of the World
- Figure 20.1 AC Matrix: Pictorial Representation
- Figure 20.2 AC Matrix: Overall ADC Contract Manufacturing Market Scenario (Till 2035)
- Figure 20.3 AC Matrix: ADC Contract Manufacturing Scenario for Type of ADC Manufacturing Service Offered
- Figure 20.4 AC Matrix: ADC Contract Manufacturing Scenario for Key Geographical Regions
- Figure 22.1 Global ADC Contract Manufacturing Market, Historical Trends (Since 2023) and Forecasted Estimates (Till 2035): Base Scenario (USD Billion)
- Figure 22.2 Global ADC Contract Manufacturing Market, Historical Trends (Since 2023) and Forecasted Estimates (Till 2035): Conservative Scenario (USD Billion)
- Figure 22.3 Global ADC Contract Manufacturing Market, Historical Trends (Since 2023) and Forecasted Estimates (Till 2035): Optimistic Scenario (USD Billion)
- Figure 23.1 ADC Contract Manufacturing Market: Distribution by Scale of Operation
- Figure 23.2 ADC Contract Manufacturing Market for Clinical Scale: Historical Trends (Since 2023) and Forecasted Estimates (Till 2035) (USD Billion)
- Figure 23.3 ADC Contract Manufacturing Market for Commercial Scale: Historical Trends (Since 2023) and Forecasted Estimates (Till 2035) (USD Billion)
- Figure 24.1 ADC Contract Manufacturing Market: Distribution by Process Component
- Figure 24.2 ADC Contract Manufacturing Market for Antibodies: Historical Trends (Since 2023) and Forecasted Estimates (Till 2035) (USD Billion)
- Figure 24.3 ADC Contract Manufacturing Market for HPAPI / Cytotoxic Payloads: Historical Trends (Since 2023) and Forecasted Estimates (Till 2035) (USD Billion)
- Figure 24.4 ADC Contract Manufacturing Market for Conjugation / Linkers: Historical Trends (Since 2023) and Forecasted Estimates (Till 2035) (USD Billion)
- Figure 24.5 ADC Contract Manufacturing Market for Fill / Finish: Historical Trends (Since 2023) and Forecasted Estimates (Till 2035) (USD Billion)
- Figure 25.1 ADC Contract Manufacturing Market: Distribution by Type of Payload
- Figure 25.2 ADC Contract Manufacturing Market for Tubulin Inhibitors: Historical Trends (Since 2023) and Forecasted Estimates (Till 2035) (USD Billion)
- Figure 25.3 ADC Contract Manufacturing Market for Topoisomerase Inhibitors: Historical Trends (Since 2023) and Forecasted Estimates (Till 2035) (USD Billion)
- Figure 25.4 ADC Contract Manufacturing Market for DNA Damaging Agents: Historical Trends (Since 2023) and Forecasted Estimates (Till 2035) (USD Billion)
- Figure 25.5 ADC Contract Manufacturing Market for Others: Historical Trends (Since 2023) and Forecasted Estimates (Till 2035) (USD Billion)
- Figure 26.1 ADC Contract Manufacturing Market: Distribution by Antibody Origin
- Figure 26.2 ADC Contract Manufacturing Market for Humanized: Historical Trends (Since 2023) and Forecasted Estimates (Till 2035) (USD Billion)
- Figure 26.3 ADC Contract Manufacturing Market for Chimeric: Historical Trends (Since 2023) and Forecasted Estimates (Till 2035) (USD Billion)
- Figure 26.4 ADC Contract Manufacturing Market for Human: Historical Trends (Since 2023) and Forecasted Estimates (Till 2035) (USD Billion)
- Figure 26.5 ADC Contract Manufacturing Market for Others: Historical Trends (Since 2023) and Forecasted Estimates (Till 2035) (USD Billion)
- Figure 27.1 ADC Contract Manufacturing Market: Distribution by Antibody Isotype
- Figure 27.2 ADC Contract Manufacturing Market for IgG1: Historical Trends (Since 2023) and Forecasted Estimates (Till 2035) (USD Billion)
- Figure 27.3 ADC Contract Manufacturing Market for IgG4: Historical Trends (Since 2023) and Forecasted Estimates (Till 2035) (USD Billion)
- Figure 27.4 ADC Contract Manufacturing Market for Others: Historical Trends (Since 2023) and Forecasted Estimates (Till 2035) (USD Billion)
- Figure 28.1 ADC Contract Manufacturing Market: Distribution by Target Indication
- Figure 28.2 ADC Contract Manufacturing Market for Solid Tumors: Historical Trends (Since 2023) and Forecasted Estimates (Till 2035) (USD Billion)
- Figure 28.3 ADC Contract Manufacturing Market for Hematological Malignancies: Historical Trends (Since 2023) and Forecasted Estimates (Till 2035) (USD Billion)
- Figure 29.1 ADC Contract Manufacturing Market: Distribution by Type of Linker
- Figure 29.2 ADC Contract Manufacturing Market for Valine-citrulline: Historical Trends (Since 2023) and Forecasted Estimates (Till 2035) (USD Billion)
- Figure 29.3 ADC Contract Manufacturing Market for SMCC: Historical Trends (Since 2023) and Forecasted Estimates (Till 2035) (USD Billion)
- Figure 29.4 ADC Contract Manufacturing Market for Hydrazone: Historical Trends (Since 2023) and Forecasted Estimates (Till 2035) (USD Billion)
- Figure 29.5 ADC Contract Manufacturing Market for Maleimide: Historical Trends (Since 2023) and Forecasted Estimates (Till 2035) (USD Billion)
- Figure 29.6 ADC Contract Manufacturing Market for Maleimidocaproyl: Historical Trends (Since 2023) and Forecasted Estimates (Till 2035) (USD Billion)
- Figure 29.7 ADC Contract Manufacturing Market for Tetrapeptide-based Linkers: Historical Trends (Since 2023) and Forecasted Estimates (Till 2035) (USD Billion)
- Figure 29.8 ADC Contract Manufacturing Market for Peptide Linkers: Historical Trends (Since 2023) and Forecasted Estimates (Till 2035) (USD Billion)
- Figure 29.9 ADC Contract Manufacturing Market for Others: Historical Trends (Since 2023) and Forecasted Estimates (Till 2035) (USD Billion)
- Figure 30.1 ADC Contract Manufacturing Market: Distribution by Key Geographical Regions
- Figure 30.2 ADC Contract Manufacturing Market in North America: Historical Trends (Since 2023) and Forecasted Estimates (Till 2035) (USD Billion)
- Figure 30.3 ADC Contract Manufacturing Market in the US: Historical Trends (Since 2023) and Forecasted Estimates (Till 2035) (USD Billion)
- Figure 30.4 ADC Contract Manufacturing Market in Canada: Historical Trends (Since 2023) and Forecasted Estimates (Till 2035) (USD Billion)
- Figure 30.5 ADC Contract Manufacturing Market in Rest of North America: Historical Trends (Since 2023) and Forecasted Estimates (Till 2035) (USD Billion)
- Figure 30.6 ADC Contract Manufacturing Market in Europe: Historical Trends (Since 2023) and Forecasted Estimates (Till 2035) (USD Billion)
- Figure 30.7 ADC Contract Manufacturing Market in the UK: Historical Trends (Since 2023) and Forecasted Estimates (Till 2035) (USD Billion)
- Figure 30.8 ADC Contract Manufacturing Market in Spain: Historical Trends (Since 2023) and Forecasted Estimates (Till 2035) (USD Billion)
- Figure 30.9 ADC Contract Manufacturing Market in Italy: Historical Trends (Since 2023) and Forecasted Estimates (Till 2035) (USD Billion)
- Figure 30.10 ADC Contract Manufacturing Market in Germany: Historical Trends (Since 2023) and Forecasted Estimates (Till 2035) (USD Billion)
- Figure 30.11 ADC Contract Manufacturing Market in France: Historical Trends (Since 2023) and Forecasted Estimates (Till 2035) (USD Billion)
- Figure 30.12 ADC Contract Manufacturing Market in Rest of Europe: Historical Trends (Since 2023) and Forecasted Estimates (Till 2035) (USD Billion)
- Figure 30.13 ADC Contract Manufacturing Market in Asia-Pacific and Rest of the World: Historical Trends (Since 2023) and Forecasted Estimates (Till 2035) (USD Billion)
- Figure 30.14 ADC Contract Manufacturing Market in China: Historical Trends (Since 2023) and Forecasted Estimates (Till 2035) (USD Billion)
- Figure 30.15 ADC Contract Manufacturing Market in Japan: Historical Trends (Since 2023) and Forecasted Estimates (Till 2035) (USD Billion)
- Figure 30.16 ADC Contract Manufacturing Market in India: Historical Trends (Since 2023) and Forecasted Estimates (Till 2035) (USD Billion)
- Figure 30.17 ADC Contract Manufacturing Market in South Korea: Historical Trends (Since 2023) and Forecasted Estimates (Till 2035) (USD Billion)
- Figure 30.18 ADC Contract Manufacturing Market in Australia: Historical Trends (Since 2023) and Forecasted Estimates (Till 2035) (USD Billion)
- Figure 30.19 ADC Contract Manufacturing Market in Argentina: Historical Trends (Since 2023) and Forecasted Estimates (Till 2035) (USD Billion)
- Figure 30.20 ADC Contract Manufacturing Market in Brazil: Historical Trends (Since 2023) and Forecasted Estimates (Till 2035) (USD Billion)
- Figure 30.21 ADC Contract Manufacturing Market in Chile: Historical Trends (Since 2023) and Forecasted Estimates (Till 2035) (USD Billion)
- Figure 30.22 ADC Contract Manufacturing Market in Colombia: Historical Trends (Since 2023) and Forecasted Estimates (Till 2035) (USD Billion)
- Figure 30.23 ADC Contract Manufacturing Market in Israel: Historical Trends (Since 2023) and Forecasted Estimates (Till 2035) (USD Billion)
- Figure 30.24 ADC Contract Manufacturing Market in Kenya: Historical Trends (Since 2023) and Forecasted Estimates (Till 2035) (USD Billion)
- Figure 30.25 ADC Contract Manufacturing Market in Peru: Historical Trends (Since 2023) and Forecasted Estimates (Till 2035) (USD Billion)
- Figure 30.26 ADC Contract Manufacturing Market in South Africa: Historical Trends (Since 2023) and Forecasted Estimates (Till 2035) (USD Billion)
- Figure 30.27 ADC Contract Manufacturing Market in Turkey: Historical Trends (Since 2023) and Forecasted Estimates (Till 2035) (USD Billion)
- Figure 30.28 ADC Contract Manufacturing Market in Saudi Arabia: Historical Trends (Since 2023) and Forecasted Estimates (Till 2035) (USD Billion)
- Figure 30.29 ADC Contract Manufacturing Market in Other Countries: Historical Trends (Since 2023) and Forecasted Estimates (Till 2035) (USD Billion)
- Figure 31.1 Commercial ADC Contract Manufacturing Market, Forecasted Estimates, till 2035 (USD Million)
- Figure 31.2 Commercial ADC Contract Manufacturing Market: Distribution by Process Component, Forecasted Estimates, till 2035 (USD Million)
- Figure 31.3 Commercial ADC Contract Manufacturing Market: Distribution by Type of Payload, Forecasted Estimates, till 2035 (USD Million)
- Figure 31.4 Commercial ADC Contract Manufacturing Market: Distribution by Antibody Origin, Forecasted Estimates, till 2035 (USD Million)
- Figure 31.5 Commercial ADC Contract Manufacturing Market: Distribution by Antibody Isotype, Forecasted Estimates, till 2035 (USD Million)
- Figure 31.6 Commercial ADC Contract Manufacturing Market: Distribution by Target Indication, Forecasted Estimates, till 2035 (USD Million)
- Figure 31.7 Commercial ADC Contract Manufacturing Market: Distribution by Type of Linker, Forecasted Estimates, till 2035 (USD Million)
- Figure 31.8 Commercial ADC Contract Manufacturing Market: Distribution by Key Geographical Regions, Forecasted Estimates, till 2035 (USD Million)
- Figure 32.1 Clinical ADC Contract Manufacturing Market, Forecasted Estimates, till 2035 (USD Million)
- Figure 32.2 Clinical ADC Contract Manufacturing Market: Distribution by Phase of Development, Forecasted Estimates, till 2035 (USD Million)
- Figure 32.3 Clinical ADC Contract Manufacturing Market: Distribution by Process Component, Forecasted Estimates, till 2035 (USD Million)
- Figure 32.4 Clinical ADC Contract Manufacturing Market: Distribution by Type of Payload, Forecasted Estimates, till 2035 (USD Million)
- Figure 32.5 Clinical ADC Contract Manufacturing Market: Distribution by Antibody Origin, Forecasted Estimates, till 2035 (USD Million)
- Figure 32.6 Clinical ADC Contract Manufacturing Market: Distribution by Antibody Isotype, Forecasted Estimates, till 2035 (USD Million)
- Figure 32.7 Clinical ADC Contract Manufacturing Market: Distribution by Target Indication, Forecasted Estimates, till 2035 (USD Million)
- Figure 32.8 Clinical ADC Contract Manufacturing Market: Distribution by Type of Linker, Forecasted Estimates, till 2035 (USD Million)
- Figure 32.9 Clinical ADC Contract Manufacturing Market: Distribution by Key Geographical Regions, Forecasted Estimates, till 2035 (USD Million)
- Figure 33.1 Concluding Remarks: Market Landscape
- Figure 33.2 Concluding Remarks: Recent Expansions
- Figure 33.3 Concluding Remarks: Partnerships and Collaborations
- Figure 33.4 Concluding Remarks: Clinical Trial Analysis
- Figure 33.5 Concluding Remarks: Likely Partner Analysis
- Figure 33.6 Concluding Remarks: Capacity Analysis
- Figure 33.7 Concluding Remarks: Demand Analysis
- Figure 33.8 Concluding Remarks: Market Sizing and Opportunity Analysis (1/3)
- Figure 33.9 Concluding Remarks: Market Sizing and Opportunity Analysis (2/3)
- Figure 33.10 Concluding Remarks: Market Sizing and Opportunity Analysis (3/3)
 全球醫藥契約製造市場:2026-2032年市場預測(依服務類型、分子類型、劑型、治療領域、合約類型、生產規模及製程分類)醫療保健契約製造市場:2026-2032年全球市場預測(按產品類型、服務類型、分子類型、治療領域、公司規模和最終用戶分類)合約研究與生產服務市場:2026-2032年全球市場預測(按服務類型、技術、治療領域、應用和最終用戶分類)契約製造市場:全球市場按服務類型、產品/服務、技術、用戶類型和最終用戶行業分類的預測 - 2026-2032 年藥品無菌運輸市場:依產品類型、系統類型、系統配置及最終用戶分類-2026-2032年全球預測
 脂質奈米顆粒(LNP)CDMO市場分析及至2035年預測:按類型、產品類型、服務、技術、應用、材料類型、製程及最終用戶分類
 生物製藥CMO市場規模、佔有率、成長及全球產業分析:按類型、應用和地區的洞察,2026-2034年預測
 藥品合約生產市場(第五版):趨勢與預測至 2035 年 - 按產品類型、原料藥類型、原料藥濃度、成品製劑、劑型、口服固體製劑、最終用戶、地區和主要公司劃分
 奈米顆粒契約製造服務市場-全球產業規模、佔有率、趨勢、機會及預測(按類型、應用、製造能力、最終用戶、地區和競爭格局分類,2021-2031年)生物製藥CXO市場按產品類型、治療領域、分子類型、給藥途徑、技術平台、最終用戶和分銷管道分類,全球預測,2026-2032年