


 |
市場調查報告書
商品編碼
1857194
智慧照明市場:產業趨勢及全球預測(至 2035 年)-按組件類型、連接類型、照明類型、照明技術類型、安裝類型、應用、銷售管道和主要地區劃分Smart Lighting Market, Till 2035: Distribution by Type of Component, Type of Connectivity, Lighting, Lighting Technology, Installation, Type of Application, Type of Sales Channel, Key Geographical Regions: Industry Trends and Global Forecasts |
||||||
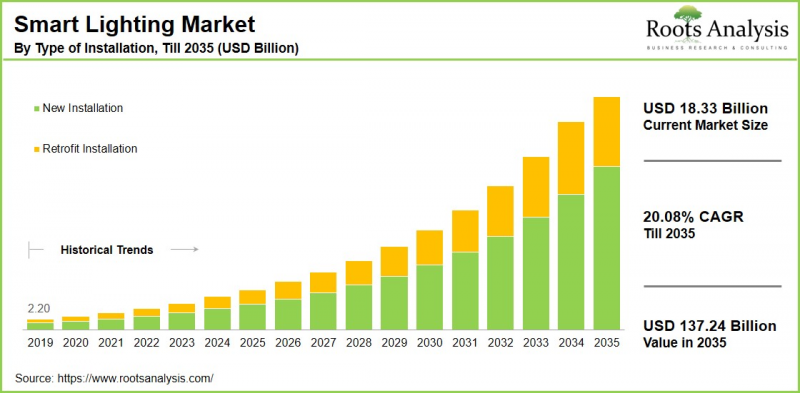
預計全球智慧照明市場在預測期內將以 20.08% 的複合年增長率成長,從目前的 183.3 億美元成長到 2035 年的 1,372.4 億美元。
智慧照明分佈在以下幾個市場區隔:
元件類型
- 硬體設備
- 照明設備
- 照明控制
- 調光器和交換器
- 閘道器
- 人感感測器右
- 集線器連接智慧右
- 軟體
- 雲端基礎
- 內部部署
- 服務
- 諮詢
- 設計&工程
- 安裝
- 維修
連接類型
- 混合
- 有線的
- 數位·可尋址·照明·接口(DALI)
- 電力線控制(PLC)
- 乙太網路供電(PoE)
- 無線
- Bluetooth
- EnOcean
- Wi-Fi
- ZigBee
- 6LoWPAN
照明類型
- 照明設備
- 照明控制
- 智慧燈泡
照明技術類型
- CFL
- 日光燈
- 鹵素
- 白熾燈
- LED
安裝類型
- 新
- 改造
用途
- 室內
- 商業用
- 產業用
- 住宅
- 室外
- 建築物
- 高速公路
- 公共照明
- 運動場
銷售管道
- 直接
- 間接銷售
地區
- 北美
- 美國
- 加拿大
- 墨西哥
- 其他的北美各國
- 歐洲
- 奧地利
- 比利時
- 丹麥
- 法國
- 德國
- 愛爾蘭
- 義大利
- 荷蘭
- 挪威
- 俄羅斯
- 西班牙
- 瑞典
- 瑞士
- 英國
- 其他歐洲各國
- 亞洲
- 中國
- 印度
- 日本
- 新加坡
- 韓國
- 其他亞洲各國
- 南美
- 巴西
- 智利
- 哥倫比亞
- 委內瑞拉
- 其他的南美各國
- 中東·北非
- 埃及
- 伊朗
- 伊拉克
- 以色列
- 科威特
- 沙烏地阿拉伯
- 阿拉伯聯合大公國
- 其他的MENA各國
- 全球其他地區
- 澳洲
- 紐西蘭
- 其他的國家
智慧照明市場成長與趨勢
智慧照明是家庭自動化和能源效率領域的新興趨勢。隨著互聯設備的普及和人們對永續生活需求的不斷增長,智慧照明有望徹底改變我們照亮生活環境的方式。與傳統照明不同,智慧照明可以透過各種先進技術和介面進行管理或自動化,包括語音助理、感測器、行動裝置和網路連接。
智慧照明的優點包括:個人化客製化、遠端管理、自適應照明、節能、增強安全性和提升安全性。這些優勢使其成為極具吸引力的選擇,在包括家庭、工作場所、商業設施和戶外空間在內的各種環境中,都能提供便利性和高效性。
在永續發展方面,智慧照明日益被認為是國家發展和環境影響的重要組成部分。在商業和工業領域實施智慧照明,預計同時改善經濟和環境。根據聯合國 "立即行動" (UN Act Now)的數據,能源供應業佔全球溫室氣體排放量的35%。然而,不斷提高人們對能源消耗環境影響的認識的努力正在促使全球溫室氣體排放量增速放緩,而智慧照明在這一進程中發揮關鍵作用。
透過利用自動化、人工智慧和物聯網技術,利害關係人正在提供具有遠端控制、語音啟動和節能功能的先進智慧照明解決方案。智慧照明的這些特性顯著增強了房主管理照明偏好的能力,使其擁有前所未有的控制力和靈活性。由於上述因素,智慧照明市場預計在預測期內將顯著成長。
目錄
第1章 序文
第2章 調查手法
第3章 經濟以及其他的計劃特有的考慮事項
第4章 宏觀經濟指標
第5章 摘要整理
第6章 簡介
第7章 競爭情形
第8章 企業簡介
- 章概要
- Acuity Brands
- Cisco Systems
- Deco Lighting
- Dialight
- Eaton
- General Electric
- Honeywell International
- Hubbell Incorporated
- LIFX
- Philips Lighting
第9章 價值鏈分析
第10章 SWOT分析
第11章 全球智慧照明市場
第12章 各元件類型的市場機會
第13章 各連接類型的市場機會
第14章 各照明類型的市場機會
第15章 各照明技術類型的市場機會
第16章 安裝各類型的市場機會
第17章 各用途的市場機會
第18章 各銷售管道的市場機會
第19章 北美智慧照明的市場機會
第20章 歐洲的智慧照明的市場機會
第21章 亞洲的智慧照明的市場機會
第22章 中東·北非(MENA)的智慧照明的市場機會
第23章 南美的智慧照明的市場機會
第24章 其他地區的智慧照明的市場機會
第25章 表格形式資料
第26章 企業·團體一覽
第27章 客制化的機會
第28章 ROOT的訂閱服務
第29章 著者詳細內容
Smart Lighting Market Overview
As per Roots Analysis, the global smart lighting market size is estimated to grow from USD 18.33 billion in the current year to USD 137.24 billion by 2035, at a CAGR of 20.08% during the forecast period, till 2035.
The opportunity for smart lighting market has been distributed across the following segments:
Type of Component
- Hardware
- Lights & Luminaires
- Light Control
- Dimmers & Switches
- Gateways
- Motion Sensing Lights
- Smart Lights Connected with Hubs
- Software
- Cloud-Based
- On-Premise
- Service
- Consulting
- Design & Engineering
- Installation
- Maintenance
Type of Capability
- Hybrid
- Wired
- Digital Addressable Lighting Interface (DALI)
- Power Line Control (PLC)
- Power Over Ethernet (PoE)
- Wireless
- Bluetooth
- EnOcean
- Wi-Fi
- ZigBee
- 6LoWPAN
Type of Lighting
- Fixtures
- Lighting Controls
- Smart Bulbs
Type of Lighting Technology
- CFL
- Fluorescent
- Halogen
- Incandescent
- LED
Type of Installation
- New Installation
- Retrofit Installation
Type of Application
- Indoor
- Commercial
- Industrial
- Residential
- Outdoor
- Architectural
- Highways & Roadways
- Lighting for Public Places
- Stadium
Type of Sales Channel
- Direct
- Indirect
Geographical Regions
- North America
- US
- Canada
- Mexico
- Other North American countries
- Europe
- Austria
- Belgium
- Denmark
- France
- Germany
- Ireland
- Italy
- Netherlands
- Norway
- Russia
- Spain
- Sweden
- Switzerland
- UK
- Other European countries
- Asia
- China
- India
- Japan
- Singapore
- South Korea
- Other Asian countries
- Latin America
- Brazil
- Chile
- Colombia
- Venezuela
- Other Latin American countries
- Middle East and North Africa
- Egypt
- Iran
- Iraq
- Israel
- Kuwait
- Saudi Arabia
- UAE
- Other MENA countries
- Rest of the World
- Australia
- New Zealand
- Other countries
Smart Lighting Market: Growth and Trends
Smart lighting represents a new trend in the realm of home automation and energy efficiency. As connected devices become more prevalent and the demand for sustainable living increases, smart lighting is poised to transform how we illuminate our living environments. In contrast to conventional lighting, smart lights can be managed or automated using various sophisticated technologies and interfaces, including voice assistants, sensors, mobile devices, and network connections.
The benefits of smart lighting include customization, remote management, adaptive illumination, energy savings, enhanced security, and improved safety. These benefits make it an attractive option for a range of settings, such as residences, workplaces, commercial properties, and outdoor spaces, offering both convenience and efficiency.
Regarding sustainability, smart lighting is increasingly recognized as a vital component in the development of nations and their environmental impact. Implementing smart lighting in commercial and industrial sectors has the potential to enhance both the economy and the environment. According to information from the United Nations Act Now, the energy supply industry is responsible for 35% of global greenhouse gas emissions. Nevertheless, ongoing efforts to raise awareness about the environmental effects of energy consumption have contributed to a slowdown in the global rate of greenhouse gas emissions, with smart lighting playing a significant role in this progress.
By utilizing automation, AI, and IoT technologies, stakeholders are providing advanced smart lighting solutions that feature remote control, voice activation, and energy-efficient functionalities. These characteristics of smart lighting greatly enhance homeowners' ability to manage their lighting preferences with unparalleled control and flexibility. As a result of the above mentioned factors, the smart lighting market is expected to grow significantly throughout the forecast period.
Smart Lighting Market: Key Segments
Market Share by Type of Component
Based on type of component, the global smart lighting market is segmented into hardware, software, and services. According to our estimates, currently, the hardware components, particularly lights and luminaires, captures the majority of the market share. This can be attributed to the increasing demand and sales for smart bulbs and IoT-connected lighting devices.
However, the software segment is expected to grow at a higher CAGR during the forecast period, due to the rising adoption of IoT technologies integrated with smart lighting has led to higher software demand, which is crucial for controlling smart lights via devices like smartphones and tablets. Additionally, the capability of smart lights to connect with platforms such as Alexa, Google, Siri, and others enhances the growth of this segment by providing voice control features through these systems.
Market Share by Type of Connectivity
Based on type of connectivity, the global smart lighting market is segmented into hybrid, wired, and wireless. According to our estimates, currently, the wired segment captures the majority of the market share during the forecast period. This can be ascribed to the increasing implementation of smart lighting in both commercial and industrial sectors. Additionally, it is widely utilized across various sectors such as office buildings, shopping centers, and educational facilities where reliable and controlled lighting systems are crucial.
On the other hand, the wireless segment, which includes Bluetooth, EnOcean, Wi-Fi, ZigBee, and 6lowpan, is expected to grow at a higher CAGR during the forecast period. This is due to the rising demand for wireless connectivity, which is propelled by its high data transmission rates and capability to connect directly to home networks without the need for extra hubs or gateways.
Moreover, Bluetooth connectivity provides user-friendly direct control via smartphones and tablets without requiring an internet connection, significantly boosting the growth of this segment.
Market Share by Type of Lighting
Based on type of lighting, the global smart lighting market is segmented into fixtures, lighting controls, and smart bulbs. According to our estimates, currently, the smart bulbs segment captures the majority of the market share. Smart bulbs are favored by consumers due to their affordability, user-friendly nature, and broad compatibility, which significantly contributes to the growth of this segment. Additionally, the lower upfront costs and straightforward installation further enhance the demand for smart bulbs, driving market expansion.
On the other hand, the fixtures segment is expected to grow at a higher CAGR during the forecast period. This can be attributed to the rise in new construction within both the residential and commercial sectors, which often require comprehensive lighting solutions where smart fixtures, integrated with smart bulbs and controls, are essential.
Market Share by Type of Lighting Technology
Based on type of lighting technology, the global smart lighting market is segmented into CFL, fluorescent, halogen, incandescent, and LED. According to our estimates, currently, the Light Light-emitting diode (LED) segment captures the majority of the market share. This can be attributed to the advantages of LED, such as cost savings, compatibility with smart technology and energy efficiency.
On the other hand, the incandescent lighting segment is expected to grow at a higher CAGR during the forecast period. Incandescent lighting, one of the earliest forms of electric lighting, continues to be in demand due to its simplicity and compatibility for replacement with existing fixtures, which does not require special controls or devices.
Market Share by Type of Installation
Based on type of installation, the global smart lighting market is segmented into new installation and retrofit installation. According to our estimates, currently, the new installation segment captures the majority of the market share and this trend is unlikely to change in future. This can be attributed to the increased uptake of smart lighting in new buildings, where such systems can be easily integrated into initial construction plans, allowing for optimal wiring and placement.
On the other hand, the retrofit segment is expected to grow at a higher CAGR during the forecast period, driven by the rising consumer interest in SMART LIGHTING technologies aimed at enhancing living spaces with minimal disturbances.
Market Share by Type of Application
Based on type of application, the global smart lighting market is segmented into indoor (commercial, industrial and residential) and outdoor (architectural, highways & roadways, lighting for public places and stadiums). According to our estimates, currently, the indoor segment captures the majority of the market share, due to the rapid urbanization occurring globally. This is especially true in developing nations, which are increasingly incorporating smart lighting systems into their new infrastructure projects, including buildings, schools, hospitals, and more.
On the other hand, the outdoor segment is expected to grow at a higher CAGR during the forecast period. This can be attributed to the rise of smart city initiatives, along with the development of highways and roadways across the globe.
Market Share by Type of Sale Channels
Based on type of sale channels, the global smart lighting market is segmented into direct sales and indirect sales. According to our estimates, currently, the indirect sales channel captures the majority of the market share, due to the rapid urbanization occurring globally. This can be attributed to the collaborations with e-commerce platforms, retailers, and distributors, which have enhanced the availability of smart lighting products. These channels offer extensive consumer reach and logistical support, creating more opportunities for manufacturers in the smart lighting sector.
Market Share by Geographical Regions
Based on geographical regions, the smart lighting market is segmented into North America, Europe, Asia, Latin America, Middle East and North Africa, and the rest of the world. According to our estimates, currently, Europe captures the majority share of the market, due to the widespread adoption of smart lighting technology and a strong focus on energy efficiency and sustainability. However, the market in Asia Pacific is expected to grow at relatively higher CAGR during the forecast period.
Example Players in Smart Lighting Market
- Acuity Brands
- Cisco Systems
- Cree
- Deco Lighting
- Dialight
- Eaton
- General Electric
- Honeywell International
- Hubbell Incorporated
- Koninklijke Philips
- LIFX
- Lutron Electronics
- Osram Licht
- Philips Lighting
- Samsung Electronics
- Syska
Smart Lighting Market: Research Coverage
The report on the smart lighting market features insights on various sections, including:
- Market Sizing and Opportunity Analysis: An in-depth analysis of the smart lighting market, focusing on key market segments, including [A] type of component, [B] type of connectivity, [C] type of lighting, [D] type of lighting technology, [E] type of installation, [F] type of application, [G] type of sales channel and [H] key geographical regions.
- Competitive Landscape: A comprehensive analysis of the companies engaged in the smart lighting market, based on several relevant parameters, such as [A] year of establishment, [B] company size, [C] location of headquarters and [D] ownership structure.
- Company Profiles: Elaborate profiles of prominent players engaged in the smart lighting market, providing details on [A] location of headquarters, [B] company size, [C] company mission, [D] company footprint, [E] management team, [F] contact details, [G] financial information, [H] operating business segments, [I] smart lighting portfolio, [J] moat analysis, [K] recent developments, and an informed future outlook.
- SWOT Analysis: An insightful SWOT framework, highlighting the strengths, weaknesses, opportunities and threats in the domain. Additionally, it provides Harvey ball analysis, highlighting the relative impact of each SWOT parameter.
- Value Chain Analysis: A comprehensive analysis of the value chain, providing information on the different phases and stakeholders involved in the smart lighting market
Key Questions Answered in this Report
- How many companies are currently engaged in smart lighting market?
- Which are the leading companies in this market?
- What factors are likely to influence the evolution of this market?
- What is the current and future market size?
- What is the CAGR of this market?
- How is the current and future market opportunity likely to be distributed across key market segments?
Reasons to Buy this Report
- The report provides a comprehensive market analysis, offering detailed revenue projections of the overall market and its specific sub-segments. This information is valuable to both established market leaders and emerging entrants.
- Stakeholders can leverage the report to gain a deeper understanding of the competitive dynamics within the market. By analyzing the competitive landscape, businesses can make informed decisions to optimize their market positioning and develop effective go-to-market strategies.
- The report offers stakeholders a comprehensive overview of the market, including key drivers, barriers, opportunities, and challenges. This information empowers stakeholders to stay abreast of market trends and make data-driven decisions to capitalize on growth prospects.
Additional Benefits
- Complimentary Excel Data Packs for all Analytical Modules in the Report
- 15% Free Content Customization
- Detailed Report Walkthrough Session with Research Team
- Free Updated report if the report is 6-12 months old or older
TABLE OF CONTENTS
1. PREFACE
- 1.1. Introduction
- 1.2. Market Share Insights
- 1.3. Key Market Insights
- 1.4. Report Coverage
- 1.5. Key Questions Answered
- 1.6. Chapter Outlines
2. RESEARCH METHODOLOGY
- 2.1. Chapter Overview
- 2.2. Research Assumptions
- 2.3. Database Building
- 2.3.1. Data Collection
- 2.3.2. Data Validation
- 2.3.3. Data Analysis
- 2.4. Project Methodology
- 2.4.1. Secondary Research
- 2.4.1.1. Annual Reports
- 2.4.1.2. Academic Research Papers
- 2.4.1.3. Company Websites
- 2.4.1.4. Investor Presentations
- 2.4.1.5. Regulatory Filings
- 2.4.1.6. White Papers
- 2.4.1.7. Industry Publications
- 2.4.1.8. Conferences and Seminars
- 2.4.1.9. Government Portals
- 2.4.1.10. Media and Press Releases
- 2.4.1.11. Newsletters
- 2.4.1.12. Industry Databases
- 2.4.1.13. Roots Proprietary Databases
- 2.4.1.14. Paid Databases and Sources
- 2.4.1.15. Social Media Portals
- 2.4.1.16. Other Secondary Sources
- 2.4.2. Primary Research
- 2.4.2.1. Introduction
- 2.4.2.2. Types
- 2.4.2.2.1. Qualitative
- 2.4.2.2.2. Quantitative
- 2.4.2.3. Advantages
- 2.4.2.4. Techniques
- 2.4.2.4.1. Interviews
- 2.4.2.4.2. Surveys
- 2.4.2.4.3. Focus Groups
- 2.4.2.4.4. Observational Research
- 2.4.2.4.5. Social Media Interactions
- 2.4.2.5. Stakeholders
- 2.4.2.5.1. Company Executives (CXOs)
- 2.4.2.5.2. Board of Directors
- 2.4.2.5.3. Company Presidents and Vice Presidents
- 2.4.2.5.4. Key Opinion Leaders
- 2.4.2.5.5. Research and Development Heads
- 2.4.2.5.6. Technical Experts
- 2.4.2.5.7. Subject Matter Experts
- 2.4.2.5.8. Scientists
- 2.4.2.5.9. Doctors and Other Healthcare Providers
- 2.4.2.6. Ethics and Integrity
- 2.4.2.6.1. Research Ethics
- 2.4.2.6.2. Data Integrity
- 2.4.3. Analytical Tools and Databases
- 2.4.1. Secondary Research
3. ECONOMIC AND OTHER PROJECT SPECIFIC CONSIDERATIONS
- 3.1. Forecast Methodology
- 3.1.1. Top-Down Approach
- 3.1.2. Bottom-Up Approach
- 3.1.3. Hybrid Approach
- 3.2. Market Assessment Framework
- 3.2.1. Total Addressable Market (TAM)
- 3.2.2. Serviceable Addressable Market (SAM)
- 3.2.3. Serviceable Obtainable Market (SOM)
- 3.2.4. Currently Acquired Market (CAM)
- 3.3. Forecasting Tools and Techniques
- 3.3.1. Qualitative Forecasting
- 3.3.2. Correlation
- 3.2.3. Regression
- 3.3.4. Time Series Analysis
- 3.3.5. Extrapolation
- 3.3.6. Convergence
- 3.3.7. Forecast Error Analysis
- 3.3.8. Data Visualization
- 3.3.9. Scenario Planning
- 3.3.10. Sensitivity Analysis
- 3.4. Key Considerations
- 3.4.1. Demographics
- 3.4.2. Market Access
- 3.4.3. Reimbursement Scenarios
- 3.4.4. Industry Consolidation
- 3.5. Robust Quality Control
- 3.6. Key Market Segmentations
- 3.7 Limitations
4. MACRO-ECONOMIC INDICATORS
- 4.1. Chapter Overview
- 4.2. Market Dynamics
- 4.2.1. Time Period
- 4.2.1.1. Historical Trends
- 4.2.1.2. Current and Forecasted Estimates
- 4.2.2. Currency Coverage
- 4.2.2.1. Overview of Major Currencies Affecting the Market
- 4.2.2.2. Impact of Currency Fluctuations on the Industry
- 4.2.3. Foreign Exchange Impact
- 4.2.3.1. Evaluation of Foreign Exchange Rates and Their Impact on Market
- 4.2.3.2. Strategies for Mitigating Foreign Exchange Risk
- 4.2.4. Recession
- 4.2.4.1. Historical Analysis of Past Recessions and Lessons Learnt
- 4.2.4.2. Assessment of Current Economic Conditions and Potential Impact on the Market
- 4.2.5. Inflation
- 4.2.5.1. Measurement and Analysis of Inflationary Pressures in the Economy
- 4.2.5.2. Potential Impact of Inflation on the Market Evolution
- 4.2.6. Interest Rates
- 4.2.5.1. Overview of Interest Rates and Their Impact on the Market
- 4.2.5.2. Strategies for Managing Interest Rate Risk
- 4.2.7. Commodity Flow Analysis
- 4.2.7.1. Type of Commodity
- 4.2.7.2. Origins and Destinations
- 4.2.7.3. Values and Weights
- 4.2.7.4. Modes of Transportation
- 4.2.8. Global Trade Dynamics
- 4.2.8.1. Import Scenario
- 4.2.8.2. Export Scenario
- 4.2.9. War Impact Analysis
- 4.2.9.1. Russian-Ukraine War
- 4.2.9.2. Israel-Hamas War
- 4.2.10. COVID Impact / Related Factors
- 4.2.10.1. Global Economic Impact
- 4.2.10.2. Industry-specific Impact
- 4.2.10.3. Government Response and Stimulus Measures
- 4.2.10.4. Future Outlook and Adaptation Strategies
- 4.2.11. Other Indicators
- 4.2.11.1. Fiscal Policy
- 4.2.11.2. Consumer Spending
- 4.2.11.3. Gross Domestic Product (GDP)
- 4.2.11.4. Employment
- 4.2.11.5. Taxes
- 4.2.11.6. R&D Innovation
- 4.2.11.7. Stock Market Performance
- 4.2.11.8. Supply Chain
- 4.2.11.9. Cross-Border Dynamics
- 4.2.1. Time Period
5. EXECUTIVE SUMMARY
6. INTRODUCTION
- 6.1. Chapter Overview
- 6.2. Overview of Smart Lighting
- 6.2.1. Type of Component
- 6.2.2. Type of Connectivity
- 6.2.3. Type of Lighting
- 6.2.4. Type of Lighting Technology
- 6.2.5. Type of Installation
- 6.2.6. Type of Application
- 6.2.7. Type of Sales Channel
- 6.3. Future Perspective
7. COMPETITIVE LANDSCAPE
- 7.1. Chapter Overview
- 7.2. Smart Lighting: Overall Market Landscape
- 7.2.1. Analysis by Year of Establishment
- 7.2.2. Analysis by Company Size
- 7.2.3. Analysis by Location of Headquarters
- 7.2.4. Analysis by Ownership Structure
8. COMPANY PROFILES
- 8.1. Chapter Overview
- 8.2.1. Acuity Brands*
- 8.2.1.1. Company Overview
- 8.2.1.2. Company Mission
- 8.2.1.3. Company Footprint
- 8.2.1.4. Management Team
- 8.2.1.5. Contact Details
- 8.2.1.6. Financial Performance
- 8.2.1.7. Operating Business Segments
- 8.2.1.8. Service / Product Portfolio (project specific)
- 8.2.1.9. MOAT Analysis
- 8.2.1.10. Recent Developments and Future Outlook
- 8.2.2. Cisco Systems
- 8.2.3. Deco Lighting
- 8.2.4. Dialight
- 8.2.5. Eaton
- 8.2.6. General Electric
- 8.2.7. Honeywell International
- 8.2.8. Hubbell Incorporated
- 8.2.9. LIFX
- 8.2.10. Philips Lighting
- 8.2.1. Acuity Brands*
9. VALUE CHAIN ANALYSIS
10. SWOT ANALYSIS
11. GLOBAL Smart Lighting Market
- 11.1. Chapter Overview
- 11.2. Key Assumptions and Methodology
- 11.3. Trends Disruption Impacting Market
- 11.4. Global Smart Lighting Market, Historical Trends (Since 2019) and Forecasted Estimates (Till 2035)
- 11.5. Multivariate Scenario Analysis
- 11.5.1. Conservative Scenario
- 11.5.2. Optimistic Scenario
- 11.6. Key Market Segmentations
12. MARKET OPPORTUNITIES BASED ON TYPE OF COMPONENT
- 12.1. Chapter Overview
- 12.2. Key Assumptions and Methodology
- 12.3. Revenue Shift Analysis
- 12.4. Market Movement Analysis
- 12.5. Penetration-Growth (P-G) Matrix
- 12.6. Smart Lighting Market for Hardware: Historical Trends (Since 2019) and Forecasted Estimates (Till 2035)
- 12.7. Smart Lighting Market for Software: Historical Trends (Since 2019) and Forecasted Estimates (Till 2035)
- 12.8. Smart Lighting Market for Service: Historical Trends (Since 2019) and Forecasted Estimates (Till 2035)
- 12.9. Data Triangulation and Validation
13. MARKET OPPORTUNITIES BASED ON TYPE OF CONNECTIVITY
- 13.1. Chapter Overview
- 13.2. Key Assumptions and Methodology
- 13.3. Revenue Shift Analysis
- 13.4. Market Movement Analysis
- 13.5. Penetration-Growth (P-G) Matrix
- 13.6. Smart Lighting Market for Hybrid: Historical Trends (Since 2019) and Forecasted Estimates (Till 2035)
- 13.7. Smart Lighting Market for Wired: Historical Trends (Since 2019) and Forecasted Estimates (Till 2035)
- 13.8. Smart Lighting Market for Wireless: Historical Trends (Since 2019) and Forecasted Estimates (Till 2035)
- 13.9. Data Triangulation and Validation
14. MARKET OPPORTUNITIES BASED ON TYPE OF LIGHTING
- 14.1. Chapter Overview
- 14.2. Key Assumptions and Methodology
- 14.3. Revenue Shift Analysis
- 14.4. Market Movement Analysis
- 14.5. Penetration-Growth (P-G) Matrix
- 14.6. Smart Lighting Market for Fixtures: Historical Trends (Since 2019) and Forecasted Estimates (Till 2035)
- 14.7. Smart Lighting Market for Lighting Controls: Historical Trends (Since 2019) and Forecasted Estimates (Till 2035)
- 14.8. Smart Lighting Market for Smart Bulbs: Historical Trends (Since 2019) and Forecasted Estimates (Till 2035)
- 14.9. Data Triangulation and Validation
15. MARKET OPPORTUNITIES BASED ON TYPE OF LIGHTINHG TECHNOLOGY
- 15.1. Chapter Overview
- 15.2. Key Assumptions and Methodology
- 15.3. Revenue Shift Analysis
- 15.4. Market Movement Analysis
- 15.5. Penetration-Growth (P-G) Matrix
- 15.6. Smart Lighting Market for CFL: Historical Trends (Since 2019) and Forecasted Estimates (Till 2035)
- 15.7. Smart Lighting Market for Fluorescent: Historical Trends (Since 2019) and Forecasted Estimates (Till 2035)
- 15.8. Smart Lighting Market for Halogen: Historical Trends (Since 2019) and Forecasted Estimates (Till 2035)
- 15.9 Smart Lighting Market for Incandescent: Historical Trends (Since 2019) and Forecasted Estimates (Till 2035)
- 15.10. Smart Lighting Market for LED: Historical Trends (Since 2019) and Forecasted Estimates (Till 2035)
- 15.11. Data Triangulation and Validation
16. MARKET OPPORTUNITIES BASED ON TYPE OF INSTALLATION
- 16.1. Chapter Overview
- 16.2. Key Assumptions and Methodology
- 16.3. Revenue Shift Analysis
- 16.4. Market Movement Analysis
- 16.5. Penetration-Growth (P-G) Matrix
- 16.6. Smart Lighting Market for New Installation: Historical Trends (Since 2019) and Forecasted Estimates (Till 2035)
- 16.7. Smart Lighting Market for Retrofit Installation: Historical Trends (Since 2019) and Forecasted Estimates (Till 2035)
- 16.8. Data Triangulation and Validation
17. MARKET OPPORTUNITIES BASED ON TYPE OF APPLICATION
- 17.1. Chapter Overview
- 17.2. Key Assumptions and Methodology
- 17.3. Revenue Shift Analysis
- 17.4. Market Movement Analysis
- 17.5. Penetration-Growth (P-G) Matrix
- 17.6. Smart Lighting Market for Indoor: Historical Trends (Since 2019) and Forecasted Estimates (Till 2035)
- 17.7. Smart Lighting Market for Outdoor: Historical Trends (Since 2019) and Forecasted Estimates (Till 2035)
- 17.8. Data Triangulation and Validation
18. MARKET OPPORTUNITIES BASED ON TYPE OF SALES CHANNEL
- 18.1. Chapter Overview
- 18.2. Key Assumptions and Methodology
- 18.3. Revenue Shift Analysis
- 18.4. Market Movement Analysis
- 18.5. Penetration-Growth (P-G) Matrix
- 18.6. Smart Lighting Market for Direct Sales Channels: Historical Trends (Since 2019) and Forecasted Estimates (Till 2035)
- 18.7. Smart Lighting Market for Indirect Sales Channels: Historical Trends (Since 2019) and Forecasted Estimates (Till 2035)
- 18.8. Data Triangulation and Validation
19. MARKET OPPORTUNITIES FOR SMART LIGHTING IN NORTH AMERICA
- 19.1. Chapter Overview
- 19.2. Key Assumptions and Methodology
- 19.3. Revenue Shift Analysis
- 19.4. Market Movement Analysis
- 19.5. Penetration-Growth (P-G) Matrix
- 19.6. Smart Lighting Market in North America: Historical Trends (Since 2019) and Forecasted Estimates (Till 2035)
- 19.6.1. Smart Lighting Market in the US: Historical Trends (Since 2019) and Forecasted Estimates (Till 2035)
- 19.6.2. Smart Lighting Market in Canada: Historical Trends (Since 2019) and Forecasted Estimates (Till 2035)
- 19.6.3. Smart Lighting Market in Mexico: Historical Trends (Since 2019) and Forecasted Estimates (Till 2035)
- 19.6.4. Smart Lighting Market in Other North American Countries: Historical Trends (Since 2019) and Forecasted Estimates (Till 2035)
- 19.7. Data Triangulation and Validation
20. MARKET OPPORTUNITIES FOR SMART LIGHTING IN EUROPE
- 20.1. Chapter Overview
- 20.2. Key Assumptions and Methodology
- 20.3. Revenue Shift Analysis
- 20.4. Market Movement Analysis
- 20.5. Penetration-Growth (P-G) Matrix
- 20.6. Smart Lighting Market in Europe: Historical Trends (Since 2019) and Forecasted Estimates (Till 2035)
- 20.6.1. Smart Lighting Market in the Austria: Historical Trends (Since 2019) and Forecasted Estimates (Till 2035)
- 20.6.2. Smart Lighting Market in Belgium: Historical Trends (Since 2019) and Forecasted Estimates (Till 2035)
- 20.6.3. Smart Lighting Market in Denmark: Historical Trends (Since 2019) and Forecasted Estimates (Till 2035)
- 20.6.4. Smart Lighting Market in France: Historical Trends (Since 2019) and Forecasted Estimates (Till 2035)
- 20.6.5. Smart Lighting Market in Germany: Historical Trends (Since 2019) and Forecasted Estimates (Till 2035)
- 20.6.6. Smart Lighting Market in Ireland: Historical Trends (Since 2019) and Forecasted Estimates (Till 2035)
- 20.6.7. Smart Lighting Market in Italy: Historical Trends (Since 2018) and Forecasted Estimates (Till 2035)
- 20.6.8. Smart Lighting Market in Netherlands: Historical Trends (Since 2019) and Forecasted Estimates (Till 2035)
- 20.6.9. Smart Lighting Market in Norway: Historical Trends (Since 2019) and Forecasted Estimates (Till 2035)
- 20.6.10. Smart Lighting Market in Russia: Historical Trends (Since 2019) and Forecasted Estimates (Till 2035)
- 20.6.11. Smart Lighting Market in Spain: Historical Trends (Since 2019) and Forecasted Estimates (Till 2035)
- 20.6.12. Smart Lighting Market in Sweden: Historical Trends (Since 2019) and Forecasted Estimates (Till 2035)
- 20.6.13. Smart Lighting Market in Switzerland: Historical Trends(Since 2019) and Forecasted Estimates (Till 2035)
- 20.6.14. Smart Lighting Market in the UK: Historical Trends (Since 2019) and Forecasted Estimates (Till 2035)
- 20.6.15. Smart Lighting Market in Other European Countries: Historical Trends (Since 2019) and Forecasted Estimates (Till 2035)
- 20.7. Data Triangulation and Validation
21. MARKET OPPORTUNITIES FOR SMART LIGHTING IN ASIA
- 21.1. Chapter Overview
- 21.2. Key Assumptions and Methodology
- 21.3. Revenue Shift Analysis
- 21.4. Market Movement Analysis
- 21.5. Penetration-Growth (P-G) Matrix
- 21.6. Smart Lighting Market in Asia: Historical Trends (Since 2018) and Forecasted Estimates (Till 2035)
- 21.6.1. Smart Lighting Market in China: Historical Trends (Since 2019) and Forecasted Estimates (Till 2035)
- 21.6.2. Smart Lighting Market in India: Historical Trends (Since 2018) and Forecasted Estimates (Till 2035)
- 21.6.3. Smart Lighting Market in Japan: Historical Trends (Since 2019) and Forecasted Estimates (Till 2035)
- 21.6.4. Smart Lighting Market in Singapore: Historical Trends (Since 2019) and Forecasted Estimates (Till 2035)
- 21.6.5. Smart Lighting Market in South Korea: Historical Trends (Since 2019) and Forecasted Estimates (Till 2035)
- 21.6.6. Smart Lighting Market in Other Asian Countries: Historical Trends (Since 2019) and Forecasted Estimates (Till 2035)
- 21.7. Data Triangulation and Validation
22. MARKET OPPORTUNITIES FOR SMART LIGHTING IN MIDDLE EAST AND NORTH AFRICA (MENA)
- 22.1. Chapter Overview
- 22.2. Key Assumptions and Methodology
- 22.3. Revenue Shift Analysis
- 22.4. Market Movement Analysis
- 22.5. Penetration-Growth (P-G) Matrix
- 22.6. Smart Lighting Market in Middle East and North Africa (MENA): Historical Trends (Since 2019) and Forecasted Estimates (Till 2035)
- 22.6.1. Smart Lighting Market in Egypt: Historical Trends (Since 2019) and Forecasted Estimates (Till 205)
- 22.6.2. Smart Lighting Market in Iran: Historical Trends (Since 2018) and Forecasted Estimates (Till 2035)
- 22.6.3. Smart Lighting Market in Iraq: Historical Trends (Since 2018) and Forecasted Estimates (Till 2035)
- 22.6.4. Smart Lighting Market in Israel: Historical Trends (Since 2019) and Forecasted Estimates (Till 2035)
- 22.6.5. Smart Lighting Market in Kuwait: Historical Trends (Since 2019) and Forecasted Estimates (Till 2035)
- 22.6.6. Smart Lighting Market in Saudi Arabia: Historical Trends (Since 2019) and Forecasted Estimates (Till 2035)
- 22.6.7. Smart Lighting Market in United Arab Emirates (UAE): Historical Trends (Since 2019) and Forecasted Estimates (Till 2035)
- 22.6.8. Smart Lighting Market in Other MENA Countries: Historical Trends (Since 2019) and Forecasted Estimates (Till 2035)
- 22.7. Data Triangulation and Validation
23. MARKET OPPORTUNITIES FOR SMART LIGHTING IN LATIN AMERICA
- 23.1. Chapter Overview
- 23.2. Key Assumptions and Methodology
- 23.3. Revenue Shift Analysis
- 23.4. Market Movement Analysis
- 23.5. Penetration-Growth (P-G) Matrix
- 23.6. Smart Lighting Market in Latin America: Historical Trends (Since 2019) and Forecasted Estimates (Till 2035)
- 23.6.1. Smart Lighting Market in Argentina: Historical Trends (Since 2019) and Forecasted Estimates (Till 2035)
- 23.6.2. Smart Lighting Market in Brazil: Historical Trends (Since 2019) and Forecasted Estimates (Till 2035)
- 23.6.3. Smart Lighting Market in Chile: Historical Trends (Since 2019) and Forecasted Estimates (Till 2035)
- 23.6.4. Smart Lighting Market in Colombia Historical Trends (Since 2019) and Forecasted Estimates (Till 2035)
- 23.6.5. Smart Lighting Market in Venezuela: Historical Trends (Since 2019) and Forecasted Estimates (Till 2035)
- 23.6.6. Smart Lighting Market in Other Latin American Countries: Historical Trends (Since 2019) and Forecasted Estimates (Till 2035)
- 23.7. Data Triangulation and Validation
24. MARKET OPPORTUNITIES FOR SMART LIGHTING IN REST OF THE WORLD
- 24.1. Chapter Overview
- 24.2. Key Assumptions and Methodology
- 24.3. Revenue Shift Analysis
- 24.4. Market Movement Analysis
- 24.5. Penetration-Growth (P-G) Matrix
- 24.6. Smart Lighting Market in Rest of the World: Historical Trends (Since 2019) and Forecasted Estimates (Till 2035)
- 24.6.1. Smart Lighting Market in Australia: Historical Trends (Since 2019) and Forecasted Estimates (Till 2035)
- 24.6.2. Smart Lighting Market in New Zealand: Historical Trends (Since 2019) and Forecasted Estimates (Till 2035)
- 24.6.3. Smart Lighting Market in Other Countries
- 24.7. Data Triangulation and Validation
25. TABULATED DATA
26. LIST OF COMPANIES AND ORGANIZATIONS
27. CUSTOMIZATION OPPORTUNITIES
28. ROOTS SUBSCRIPTION SERVICES
29. AUTHOR DETAIL
 全球智慧照明市場:依產品、技術、光源、終端用戶、國家及地區分類-產業分析、市場規模、市場佔有率及2025-2032年未來預測
 智慧照明市場分析及預測(至2035年):依類型、產品類型、服務、技術、組件、應用、形式、最終用戶、功能及安裝類型分類
 2026年全球智慧照明市場報告2026年全球智慧照明控制系統市場報告
 AOI三色光源市場(按光源類型、應用、最終用戶和銷售管道),全球預測,2026-2032年室內智慧燈帶市場:2026-2032年全球預測(依控制方式、燈光顏色、價格範圍、應用及銷售管道)智慧家庭照明市場按產品類型、連接方式、安裝類型、最終用戶和應用分類-2026-2032年全球預測
 戶外智慧照明市場-全球產業規模、佔有率、趨勢、機會及預測(依產品、通訊技術、安裝類型、地區及競爭格局分類,2021-2031年預測)
 日本智慧照明市場規模、佔有率、趨勢及預測(按產品、通訊技術、安裝類型、光源、應用和地區分類),2026-2034年戶外LED智慧照明解決方案市場-全球產業規模、佔有率、趨勢、機會和預測,按安裝類型、組件、最終用戶、地區和競爭格局分類,2020-2030年預測