


 |
市場調查報告書
商品編碼
1857192
電力電子市場:產業趨勢及全球預測(至 2035 年)-依元件類型、材料類型、電壓類型、最終使用者類型和地區劃分Power Electronics Market, Till 2035: Distribution by Type of Device, Type of Material, Type of Voltage, Type of End User, and Geographical Regions: Industry Trends and Global Forecasts |
||||||
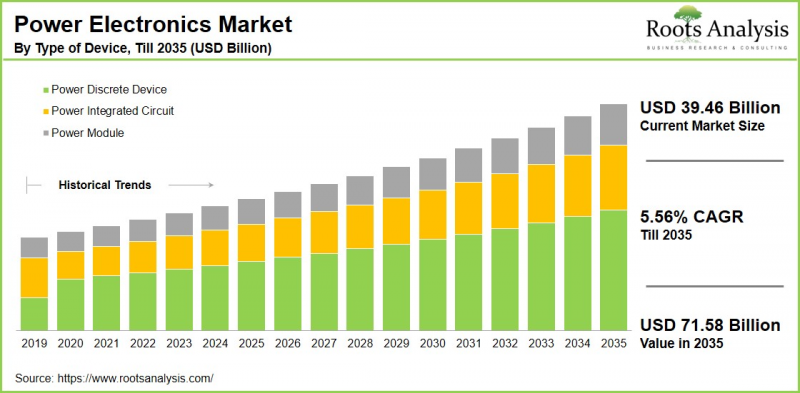
全球電力電子市場預計在預測期內將以 5.56% 的複合年增長率增長,從目前的 394.6 億美元增長到 2035 年的 715.8 億美元。
電力電子技術市場機會分佈在以下的市場區隔。
設備類型
- 電力·分離式·設備
- 電力積體電路
- 電力·模組
材料類型
- 氮化鎵
- 矽
- 碳化矽(SiC)
電壓範圍
- 高電壓
- 低壓電
- 中壓電
終端用戶
- 航太
- 汽車
- 生物醫學·醫療保健
- 消費者·電子產品
- 電子產品
- 產業
- 再生能源
- 電訊
- 其他
地區
- 北美
- 美國
- 加拿大
- 墨西哥
- 其他的北美各國
- 歐洲
- 奧地利
- 比利時
- 丹麥
- 法國
- 德國
- 愛爾蘭
- 義大利
- 荷蘭
- 挪威
- 俄羅斯
- 西班牙
- 瑞典
- 瑞士
- 英國
- 其他歐洲各國
- 亞洲
- 中國
- 印度
- 日本
- 新加坡
- 韓國
- 其他亞洲各國
- 南美
- 巴西
- 智利
- 哥倫比亞
- 委內瑞拉
- 其他的南美各國
- 中東·北非
- 埃及
- 伊朗
- 伊拉克
- 以色列
- 科威特
- 沙烏地阿拉伯
- 阿拉伯聯合大公國
- 其他的MENA各國
- 全球其他地區
- 澳洲
- 紐西蘭
- 其他的國家
電力電子市場成長與趨勢
電力電子是電氣工程領域的交叉學科,專注於設計、研究和控制用於高效轉換、調節和管理電能的電子設備和電路。該領域的核心目標是為各種應用中的能量轉換和控制創造緊湊、可靠且經濟高效的解決方案。電力電子系統透過處理高電壓和大電流來為各種電氣設備和裝置供電。
該領域的關鍵組件包括功率積體電路 (IC)、分立元件、功率二極體、電晶體、功率模組和閘極關斷閘流管。隨著智慧功率模組等先進技術的發展,電力電子的應用範圍正從消費性和工業電源管理擴展到電池管理系統及其他領域。
電動車的快速普及、智慧電網基礎設施的進步以及再生能源的併網,都顯著提升了電力電子的重要性。據估計,到2030年,全球近80%的電力生產和消費將由電力電子技術驅動。
因此,未來幾年電力電子市場可望顯著成長。對再生能源解決方案的需求不斷增長以及提高能源效率的努力是推動這一增長的關鍵因素。此外,全球範圍內節能和環境永續發展意識的不斷提高,預計也將在預測期內顯著促進電力電子市場的成長。
目錄
章節I:報告概要
第1章 序文
第2章 調查手法
第3章 市場動態
第4章 宏觀經濟指標
章節II:定性性的洞察
第5章 摘要整理
第6章 簡介
第7章 法規Scenario
章節III:市場概要
第8章 主要加入企業整體性資料庫
第9章 競爭情形
第10章 閒置頻段分析
第11章 企業競爭力分析
第12章 電力電子技術市場上Start-Ups生態系統
章節IV:企業簡介
第13章 企業簡介
- 章概要
- ABB
- Allegro Microsystems
- Analog Devices
- Applied Energy Systems
- Diodes Incorporated
- Eaton
- Fuji Electric
- Infineon Technologies
- Maxim Integrated
- Microchip Technology
- Mitsubishi Electric
- NXP Semiconductors
- ON Semiconductor
- Siemens
- Sila Nanotechnologies
- STMicroelectronics
- Texas Instruments
- Toshiba
- Vishay
章節V:市場趨勢
第14章 兆趨勢分析
第15章 未滿足需求的分析
第16章 專利分析
第17章 最近的趨勢
章節VI:市場機會分析
第18章 全球電力電子技術市場
第19章 不同設備類型的市場機會
第20章 各材料類型的市場機會
第21章 電壓各類型市場機會
第22章 各終端用戶類型的市場機會
第23章 北美電力電子技術的市場機會
第24章 歐洲的電力電子技術的市場機會
第25章 亞洲的電力電子技術的市場機會
第26章 中東·北非(MENA)的電力電子技術的市場機會
第27章 南美的電力電子技術的市場機會
第28章 全球其他地區的電力電子技術的市場機會
第29章 市場集中分析:主要加入企業分佈
第30章 鄰近市場分析
章節VII:策略工具
第31章 重要的勝利策略
第32章 波特的五力分析
第33章 SWOT分析
第34章 價值鏈分析
第35章 始祖策略建議
章節VIII:其他獨家洞察
第36章 初步研究洞察
第37章 報告書的結論
章節IX:附錄
第38章 表格形式資料
第39章 企業·團體一覽
第40章 客制化的機會
第41章 ROOT的訂閱服務
第42章 著者詳細內容
Power Electronics Market Overview
As per Roots Analysis, the global power electronics market size is estimated to grow from USD 39.46 billion in the current year to USD 71.58 billion by 2035, at a CAGR of 5.56% during the forecast period, till 2035.
The opportunity for power electronics market has been distributed across the following segments:
Type of Device
- Power Discrete Devices
- Power Integrated Circuit
- Power Modules
Type of Material
- Gallium Nitride
- Silicon
- Silicon Carbide (SiC)
Type of Voltage Range
- High Voltage
- Low Voltage
- Medium Voltage
Type of End User
- Aerospace
- Automotive
- Biomedical & Healthcare
- Consumer Electronics
- Electronics
- Industrial
- Renewable Energy
- Telecom
- Others
Geographical Regions
- North America
- US
- Canada
- Mexico
- Other North American countries
- Europe
- Austria
- Belgium
- Denmark
- France
- Germany
- Ireland
- Italy
- Netherlands
- Norway
- Russia
- Spain
- Sweden
- Switzerland
- UK
- Other European countries
- Asia
- China
- India
- Japan
- Singapore
- South Korea
- Other Asian countries
- Latin America
- Brazil
- Chile
- Colombia
- Venezuela
- Other Latin American countries
- Middle East and North Africa
- Egypt
- Iran
- Iraq
- Israel
- Kuwait
- Saudi Arabia
- UAE
- Other MENA countries
- Rest of the World
- Australia
- New Zealand
- Other countries
Power Electronics Market: Growth and Trends
Power electronics is a multidisciplinary domain within electrical engineering that focuses on the design, study, and control of electronic devices and circuits used to efficiently convert, regulate, and manage electrical power. The core objective of this field is to create compact, reliable, and cost-effective solutions for energy conversion and control across various applications. Power electronic systems function by handling high voltages and currents to supply power to diverse electrical equipment and devices.
Key components in this field include power ICs, discrete devices, power diodes, transistors, power modules, and gate turn-off thyristors. The development of advanced technologies, such as intelligent power modules, has further expanded the applications of power electronics-from consumer products and industrial power management to battery management systems and beyond.
With the rapid adoption of electric vehicles, advancements in smart grid infrastructure, and the integration of renewable energy sources, the importance of power electronics has increased significantly. By 2030, it is estimated that nearly 80% of global electric power generation and consumption will be enabled by power electronics technology.
Consequently, the power electronics market is poised for substantial growth in the coming years. Rising demand for renewable energy solutions and stronger initiatives targeting energy efficiency are among the key driving forces shaping this expansion. Further, owing to the growing awareness of energy conservation and environmental sustainability worldwide, the power electronics market is expected to grow significantly during the forecast period.
Power Electronics Market: Key Segments
Market Share by Type of Device
Based on type of device, the global power electronics market is segmented into power discrete devices, power integrated circuits, and power modules. According to our estimates, currently, the power discrete segment captures the majority of the market share. This can be attributed to the wide-ranging applications of discrete components such as metal-oxide-semiconductor field-effect transistors (MOSFETs) and insulated gate bipolar transistors (IGBTs), which are extensively used in low- to medium-power applications.
On the other hand, the power integrated circuits segment is expected to grow at a higher CAGR during the forecast period, owing to the rising demand across consumer electronics and the significant expansion of the automotive electronics sector.
Market Share by Type of Material
Based on type of material, the global power electronics market is segmented into gallium nitride, silicon, and silicon carbide. According to our estimates, currently, the silicon segment captures the majority of the market share during the forecast period. This can be attributed to its long-standing position as the industry's standard material, supported by well-established manufacturing processes, cost-effectiveness, and a wide range of applications, which continue to sustain strong demand worldwide.
However, the silicon carbide (SiC) segment is anticipated to grow at a relatively higher rate during the forecast period. This growth can be attributed to the superior performance of SiC in high-temperature and high-voltage applications, making it particularly suitable for use in electric vehicles, solar inverters, and industrial motor drives.
Market Share by Type of Voltage Range
Based on type of voltage range, the global power electronics market is segmented into high voltage, low voltage, and medium voltage. According to our estimates, currently, the low voltage segment captures the majority of the market share. This can be attributed to the strong demand from consumer electronics. Devices such as smartphones, wearables, and other consumer applications typically operate within the low-voltage range (up to 1000V).
However, the medium voltage segment is anticipated to grow at a relatively higher rate during the forecast period. This growth is primarily associated with its extensive adoption in industrial motors, power distribution systems, and heavy machinery, where efficient power management at medium voltage is critical.
Market Share by Type of End User
Based on type of end user, the global power electronics market is segmented into automotive, biomedical & healthcare, consumer electronics, electronics, industrial, renewable energy, telecom, and others. According to our estimates, currently, the consumer electronics segment captures the majority of the market share. This can be attributed to the rising demand for energy-efficient devices and components such as converters, voltage regulators, and advanced power management systems.
On the other hand, the automotive sector is expected to grow at a higher CAGR during the forecast period, fueled by the increasing penetration of electric and hybrid vehicles.
Market Share by Geographical Regions
Based on geographical regions, the power electronics market is segmented into North America, Europe, Asia, Latin America, Middle East and North Africa, and the rest of the world. According to our estimates, currently, Asia captures the majority share of the market, driven by the rapid industrialization, consumer electronics demand, and large-scale renewable energy adoption.
In contrast, the market in North America is expected to grow at relatively higher CAGR during the forecast period. This can be attributed to the strong automotive industry, a well-established industrial base, and considerable investments in renewable energy.
Example Players in Power Electronics Market
- ABB
- Allegro
- Analog Devices
- Applied Energy
- Diodes Incorporated
- Eaton
- Fuji Electric
- Infineon
- Maxim Integrated
- Microchip Technology
- Mitsubishi
- NXP
- ON Semiconductors
- Onsemi
- Renesas Electronics
- ROHM
- Semiconductor Components
- Siemens
- Sila Nanotechnologies
- STMicroelectronics
- Texas Instruments
- Toshiba
- Vishay
Power Electronics Market: Research Coverage
The report on the power electronics market features insights on various sections, including:
- Market Sizing and Opportunity Analysis: An in-depth analysis of the power electronics market, focusing on key market segments, including [A] type of device, [B] type of material, [C] type of voltage, [D] type of end user, and [E] geographical regions.
- Competitive Landscape: A comprehensive analysis of the companies engaged in the power electronics market, based on several relevant parameters, such as [A] year of establishment, [B] company size, [C] location of headquarters and [D] ownership structure.
- Company Profiles: Elaborate profiles of prominent players engaged in the power electronics market, providing details on [A] location of headquarters, [B] company size, [C] company mission, [D] company footprint, [E] management team, [F] contact details, [G] financial information, [H] operating business segments, [I] power electronics portfolio, [J] moat analysis, [K] recent developments, and an informed future outlook.
- Megatrends: An evaluation of ongoing megatrends in the power electronics industry.
- Patent Analysis: An insightful analysis of patents filed / granted in the power electronics domain, based on relevant parameters, including [A] type of patent, [B] patent publication year, [C] patent age and [D] leading players.
- Recent Developments: An overview of the recent developments made in the power electronics market, along with analysis based on relevant parameters, including [A] year of initiative, [B] type of initiative, [C] geographical distribution and [D] most active players.
- Porter's Five Forces Analysis: An analysis of five competitive forces prevailing in the power electronics market, including threats of new entrants, bargaining power of buyers, bargaining power of suppliers, threats of substitute products and rivalry among existing competitors.
- SWOT Analysis: An insightful SWOT framework, highlighting the strengths, weaknesses, opportunities and threats in the domain. Additionally, it provides Harvey ball analysis, highlighting the relative impact of each SWOT parameter.
- Value Chain Analysis: A comprehensive analysis of the value chain, providing information on the different phases and stakeholders involved in the power electronics market
Key Questions Answered in this Report
- How many companies are currently engaged in power electronics market?
- Which are the leading companies in this market?
- What factors are likely to influence the evolution of this market?
- What is the current and future market size?
- What is the CAGR of this market?
- How is the current and future market opportunity likely to be distributed across key market segments?
Reasons to Buy this Report
- The report provides a comprehensive market analysis, offering detailed revenue projections of the overall market and its specific sub-segments. This information is valuable to both established market leaders and emerging entrants.
- Stakeholders can leverage the report to gain a deeper understanding of the competitive dynamics within the market. By analyzing the competitive landscape, businesses can make informed decisions to optimize their market positioning and develop effective go-to-market strategies.
- The report offers stakeholders a comprehensive overview of the market, including key drivers, barriers, opportunities, and challenges. This information empowers stakeholders to stay abreast of market trends and make data-driven decisions to capitalize on growth prospects.
Additional Benefits
- Complimentary Excel Data Packs for all Analytical Modules in the Report
- 15% Free Content Customization
- Detailed Report Walkthrough Session with Research Team
- Free Updated report if the report is 6-12 months old or older
TABLE OF CONTENTS
SECTION I: REPORT OVERVIEW
1. PREFACE
- 1.1. Introduction
- 1.2. Market Share Insights
- 1.3. Key Market Insights
- 1.4. Report Coverage
- 1.5. Key Questions Answered
- 1.6. Chapter Outlines
2. RESEARCH METHODOLOGY
- 2.1. Chapter Overview
- 2.2. Research Assumptions
- 2.3. Database Building
- 2.3.1. Data Collection
- 2.3.2. Data Validation
- 2.3.3. Data Analysis
- 2.4. Project Methodology
- 2.4.1. Secondary Research
- 2.4.1.1. Annual Reports
- 2.4.1.2. Academic Research Papers
- 2.4.1.3. Company Websites
- 2.4.1.4. Investor Presentations
- 2.4.1.5. Regulatory Filings
- 2.4.1.6. White Papers
- 2.4.1.7. Industry Publications
- 2.4.1.8. Conferences and Seminars
- 2.4.1.9. Government Portals
- 2.4.1.10. Media and Press Releases
- 2.4.1.11. Newsletters
- 2.4.1.12. Industry Databases
- 2.4.1.13. Roots Proprietary Databases
- 2.4.1.14. Paid Databases and Sources
- 2.4.1.15. Social Media Portals
- 2.4.1.16. Other Secondary Sources
- 2.4.2. Primary Research
- 2.4.2.1. Introduction
- 2.4.2.2. Types
- 2.4.2.2.1. Qualitative
- 2.4.2.2.2. Quantitative
- 2.4.2.3. Advantages
- 2.4.2.4. Techniques
- 2.4.2.4.1. Interviews
- 2.4.2.4.2. Surveys
- 2.4.2.4.3. Focus Groups
- 2.4.2.4.4. Observational Research
- 2.4.2.4.5. Social Media Interactions
- 2.4.2.5. Stakeholders
- 2.4.2.5.1. Company Executives (CXOs)
- 2.4.2.5.2. Board of Directors
- 2.4.2.5.3. Company Presidents and Vice Presidents
- 2.4.2.5.4. Key Opinion Leaders
- 2.4.2.5.5. Research and Development Heads
- 2.4.2.5.6. Technical Experts
- 2.4.2.5.7. Subject Matter Experts
- 2.4.2.5.8. Scientists
- 2.4.2.5.9. Doctors and Other Healthcare Providers
- 2.4.2.6. Ethics and Integrity
- 2.4.2.6.1. Research Ethics
- 2.4.2.6.2. Data Integrity
- 2.4.3. Analytical Tools and Databases
- 2.4.1. Secondary Research
3. MARKET DYNAMICS
- 3.1. Forecast Methodology
- 3.1.1. Top-Down Approach
- 3.1.2. Bottom-Up Approach
- 3.1.3. Hybrid Approach
- 3.2. Market Assessment Framework
- 3.2.1. Total Addressable Market (TAM)
- 3.2.2. Serviceable Addressable Market (SAM)
- 3.2.3. Serviceable Obtainable Market (SOM)
- 3.2.4. Currently Acquired Market (CAM)
- 3.3. Forecasting Tools and Techniques
- 3.3.1. Qualitative Forecasting
- 3.3.2. Correlation
- 3.3.3. Regression
- 3.3.4. Time Series Analysis
- 3.3.5. Extrapolation
- 3.3.6. Convergence
- 3.3.7. Forecast Error Analysis
- 3.3.8. Data Visualization
- 3.3.9. Scenario Planning
- 3.3.10. Sensitivity Analysis
- 3.4. Key Considerations
- 3.4.1. Demographics
- 3.4.2. Market Access
- 3.4.3. Reimbursement Scenarios
- 3.4.4. Industry Consolidation
- 3.5. Robust Quality Control
- 3.6. Key Market Segmentations
- 3.7. Limitations
4. MACRO-ECONOMIC INDICATORS
- 4.1. Chapter Overview
- 4.2. Market Dynamics
- 4.2.1. Time Period
- 4.2.1.1. Historical Trends
- 4.2.1.2. Current and Forecasted Estimates
- 4.2.2. Currency Coverage
- 4.2.2.1. Overview of Major Currencies Affecting the Market
- 4.2.2.2. Impact of Currency Fluctuations on the Industry
- 4.2.3. Foreign Exchange Impact
- 4.2.3.1. Evaluation of Foreign Exchange Rates and Their Impact on Market
- 4.2.3.2. Strategies for Mitigating Foreign Exchange Risk
- 4.2.4. Recession
- 4.2.4.1. Historical Analysis of Past Recessions and Lessons Learnt
- 4.2.4.2. Assessment of Current Economic Conditions and Potential Impact on the Market
- 4.2.5. Inflation
- 4.2.5.1. Measurement and Analysis of Inflationary Pressures in the Economy
- 4.2.5.2. Potential Impact of Inflation on the Market Evolution
- 4.2.6. Interest Rates
- 4.2.6.1. Overview of Interest Rates and Their Impact on the Market
- 4.2.6.2. Strategies for Managing Interest Rate Risk
- 4.2.7. Commodity Flow Analysis
- 4.2.7.1. Type of Commodity
- 4.2.7.2. Origins and Destinations
- 4.2.7.3. Values and Weights
- 4.2.7.4. Modes of Transportation
- 4.2.8. Global Trade Dynamics
- 4.2.8.1. Import Scenario
- 4.2.8.2. Export Scenario
- 4.2.9. War Impact Analysis
- 4.2.9.1. Russian-Ukraine War
- 4.2.9.2. Israel-Hamas War
- 4.2.10. COVID Impact / Related Factors
- 4.2.10.1. Global Economic Impact
- 4.2.10.2. Industry-specific Impact
- 4.2.10.3. Government Response and Stimulus Measures
- 4.2.10.4. Future Outlook and Adaptation Strategies
- 4.2.11. Other Indicators
- 4.2.11.1. Fiscal Policy
- 4.2.11.2. Consumer Spending
- 4.2.11.3. Gross Domestic Product (GDP)
- 4.2.11.4. Employment
- 4.2.11.5. Taxes
- 4.2.11.6. R&D Innovation
- 4.2.11.7. Stock Market Performance
- 4.2.11.8. Supply Chain
- 4.2.11.9. Cross-Border Dynamics
- 4.2.1. Time Period
SECTION II: QUALITATIVE INSIGHTS
5. EXECUTIVE SUMMARY
6. INTRODUCTION
- 6.1. Chapter Overview
- 6.2. Overview of Power Electronics Market
- 6.2.1. Type of Device
- 6.2.2. Type of Material
- 6.2.3. Type of Voltage
- 6.2.4. Type of End User
- 6.3. Future Perspective
7. REGULATORY SCENARIO
SECTION III: MARKET OVERVIEW
8. COMPREHENSIVE DATABASE OF LEADING PLAYERS
9. COMPETITIVE LANDSCAPE
- 9.1. Chapter Overview
- 9.2. Power Electronics: Overall Market Landscape
- 9.2.1. Analysis by Year of Establishment
- 9.2.2. Analysis by Company Size
- 9.2.3. Analysis by Location of Headquarters
- 9.2.4. Analysis by Ownership Structure
10. WHITE SPACE ANALYSIS
11. COMPANY COMPETITIVENESS ANALYSIS
12. STARTUP ECOSYSTEM IN THE POWER ELECTRONICS MARKET
- 12.1. Power Electronics: Market Landscape of Startups
- 12.1.1. Analysis by Year of Establishment
- 12.1.2. Analysis by Company Size
- 12.1.3. Analysis by Company Size and Year of Establishment
- 12.1.4. Analysis by Location of Headquarters
- 12.1.5. Analysis by Company Size and Location of Headquarters
- 12.1.6. Analysis by Ownership Structure
- 12.2. Key Findings
SECTION IV: COMPANY PROFILES
13. COMPANY PROFILES
- 13.1. Chapter Overview
- 13.2. ABB*
- 13.2.1. Company Overview
- 13.2.2. Company Mission
- 13.2.3. Company Footprint
- 13.2.4. Management Team
- 13.2.5. Contact Details
- 13.2.6. Financial Performance
- 13.2.7. Operating Business Segments
- 13.2.8. Service / Product Portfolio (project specific)
- 13.2.9. MOAT Analysis
- 13.2.10. Recent Developments and Future Outlook
- 13.3. Allegro Microsystems
- 13.4. Analog Devices
- 13.5. Applied Energy Systems
- 13.6. Diodes Incorporated
- 13.7. Eaton
- 13.8. Fuji Electric
- 13.9. Infineon Technologies
- 13.10. Maxim Integrated
- 13.11. Microchip Technology
- 13.12. Mitsubishi Electric
- 13.13. NXP Semiconductors
- 13.14. ON Semiconductor
- 13.15. Siemens
- 13.16. Sila Nanotechnologies
- 13.17. STMicroelectronics
- 13.18. Texas Instruments
- 13.19. Toshiba
- 13.20. Vishay
SECTION V: MARKET TRENDS
14. MEGA TRENDS ANALYSIS
15. UNMEET NEED ANALYSIS
16. PATENT ANALYSIS
17. RECENT DEVELOPMENTS
- 17.1. Chapter Overview
- 17.2. Recent Funding
- 17.3. Recent Partnerships
- 17.4. Other Recent Initiatives
SECTION VI: MARKET OPPORTUNITY ANALYSIS
18. GLOBAL POWER ELECTRONICS MARKET
- 18.1. Chapter Overview
- 18.2. Key Assumptions and Methodology
- 18.3. Trends Disruption Impacting Market
- 18.4. Demand Side Trends
- 18.5. Supply Side Trends
- 18.6. Global Power Electronics Market, Historical Trends (Since 2019) and Forecasted Estimates (Till 2035)
- 18.7. Multivariate Scenario Analysis
- 18.7.1. Conservative Scenario
- 18.7.2. Optimistic Scenario
- 18.8. Investment Feasibility Index
- 18.9. Key Market Segmentations
19. MARKET OPPORTUNITIES BASED ON TYPE OF DEVICE
- 19.1. Chapter Overview
- 19.2. Key Assumptions and Methodology
- 19.3. Revenue Shift Analysis
- 19.4. Market Movement Analysis
- 19.5. Penetration-Growth (P-G) Matrix
- 19.6. Power Electronics Market for Power Discrete Devices: Historical Trends (Since 2019) and Forecasted Estimates (Till 2035)
- 19.7. Power Electronics Market for Power Integrated Circuit: Historical Trends (Since 2019) and Forecasted Estimates (Till 2035)
- 19.8. Power Electronics Market for Power Modules: Historical Trends (Since 2019) and Forecasted Estimates (Till 2035)
- 19.9. Data Triangulation and Validation
- 19.9.1. Secondary Sources
- 19.9.2. Primary Sources
- 19.9.3. Statistical Modeling
20. MARKET OPPORTUNITIES BASED ON TYPE OF MATERIAL
- 20.1. Chapter Overview
- 20.2. Key Assumptions and Methodology
- 20.3. Revenue Shift Analysis
- 20.4. Market Movement Analysis
- 20.5. Penetration-Growth (P-G) Matrix
- 20.6. Power Electronics Market for Gallium Nitride: Historical Trends (Since 2019) and Forecasted Estimates (Till 2035)
- 20.7. Power Electronics Market for Silicon: Historical Trends (Since 2019) and Forecasted Estimates (Till 2035)
- 20.8. Power Electronics Market for Silicon Carbide: Historical Trends (Since 2019) and Forecasted Estimates (Till 2035)
- 20.9. Data Triangulation and Validation
- 20.9.1. Secondary Sources
- 20.9.2. Primary Sources
- 20.9.3. Statistical Modeling
21. MARKET OPPORTUNITIES BASED ON TYPE OF VOLTAGE
- 21.1. Chapter Overview
- 21.2. Key Assumptions and Methodology
- 21.3. Revenue Shift Analysis
- 21.4. Market Movement Analysis
- 21.5. Penetration-Growth (P-G) Matrix
- 21.6. Power Electronics Market for High Voltage: Historical Trends (Since 2019) and Forecasted Estimates (Till 2035)
- 21.7. Power Electronics Market for Low Voltage: Historical Trends (Since 2019) and Forecasted Estimates (Till 2035)
- 21.8. Power Electronics Market for Medium Voltage: Historical Trends (Since 2019) and Forecasted Estimates (Till 2035)
- 21.9. Data Triangulation and Validation
- 21.9.1. Secondary Sources
- 21.9.2. Primary Sources
- 21.9.3. Statistical Modeling
22. MARKET OPPORTUNITIES BASED ON TYPE OF END USER
- 22.1. Chapter Overview
- 22.2. Key Assumptions and Methodology
- 22.3. Revenue Shift Analysis
- 22.4. Market Movement Analysis
- 22.5. Penetration-Growth (P-G) Matrix
- 22.6. Power Electronics Market for Automotive: Historical Trends (Since 2019) and Forecasted Estimates (Till 2035)
- 22.7. Power Electronics Market for Biomedical & Healthcare: Historical Trends (Since 2019) and Forecasted Estimates (Till 2035)
- 22.8. Power Electronics Market for Consumer Electronics: Historical Trends (Since 2019) and Forecasted Estimates (Till 2035)
- 22.9. Power Electronics Market for Industrial: Historical Trends (Since 2019) and Forecasted Estimates (Till 2035)
- 22.10. Power Electronics Market for Renewable Energy: Historical Trends (Since 2019) and Forecasted Estimates (Till 2035)
- 22.11. Power Electronics Market for Telecom: Historical Trends (Since 2019) and Forecasted Estimates (Till 2035)
- 22.12. Power Electronics Market for Others: Historical Trends (Since 2019) and Forecasted Estimates (Till 2035)
- 22.13. Data Triangulation and Validation
- 22.13.1. Secondary Sources
- 22.13.2. Primary Sources
- 22.13.3. Statistical Modeling
23. MARKET OPPORTUNITIES FOR POWER ELECTRONICS IN NORTH AMERICA
- 23.1. Chapter Overview
- 23.2. Key Assumptions and Methodology
- 23.3. Revenue Shift Analysis
- 23.4. Market Movement Analysis
- 23.5. Penetration-Growth (P-G) Matrix
- 23.6. Power Electronics Market in North America: Historical Trends (Since 2019) and Forecasted Estimates (Till 2035)
- 23.6.1. Power Electronics Market in the US: Historical Trends (Since 2019) and Forecasted Estimates (Till 2035)
- 23.6.2. Power Electronics Market in Canada: Historical Trends (Since 2019) and Forecasted Estimates (Till 2035)
- 23.6.3. Power Electronics Market in Mexico: Historical Trends (Since 2019) and Forecasted Estimates (Till 2035)
- 23.6.4. Power Electronics Market in Other North American Countries: Historical Trends (Since 2019) and Forecasted Estimates (Till 2035)
- 23.7. Data Triangulation and Validation
24. MARKET OPPORTUNITIES FOR POWER ELECTRONICS IN EUROPE
- 24.1. Chapter Overview
- 24.2. Key Assumptions and Methodology
- 24.3. Revenue Shift Analysis
- 24.4. Market Movement Analysis
- 24.5. Penetration-Growth (P-G) Matrix
- 24.6. Power Electronics Market in Europe: Historical Trends (Since 2019) and Forecasted Estimates (Till 2035)
- 24.6.1. Power Electronics Market in Austria: Historical Trends (Since 2019) and Forecasted Estimates (Till 2035)
- 24.6.2. Power Electronics Market in Belgium: Historical Trends (Since 2019) and Forecasted Estimates (Till 2035)
- 24.6.3. Power Electronics Market in Denmark: Historical Trends (Since 2019) and Forecasted Estimates (Till 2035)
- 24.6.4. Power Electronics Market in France: Historical Trends (Since 2019) and Forecasted Estimates (Till 2035)
- 24.6.5. Power Electronics Market in Germany: Historical Trends (Since 2019) and Forecasted Estimates (Till 2035)
- 24.6.6. Power Electronics Market in Ireland: Historical Trends (Since 2019) and Forecasted Estimates (Till 2035)
- 24.6.7. Power Electronics Market in Italy: Historical Trends (Since 2019) and Forecasted Estimates (Till 2035)
- 24.6.8. Power Electronics Market in Netherlands: Historical Trends (Since 2019) and Forecasted Estimates (Till 2035)
- 24.6.9. Power Electronics Market in Norway: Historical Trends (Since 2019) and Forecasted Estimates (Till 2035)
- 24.6.10. Power Electronics Market in Russia: Historical Trends (Since 2019) and Forecasted Estimates (Till 2035)
- 24.6.11. Power Electronics Market in Spain: Historical Trends (Since 2019) and Forecasted Estimates (Till 2035)
- 24.6.12. Power Electronics Market in Sweden: Historical Trends (Since 2019) and Forecasted Estimates (Till 2035)
- 24.6.13. Power Electronics Market in Switzerland: Historical Trends (Since 2019) and Forecasted Estimates (Till 2035)
- 24.6.14. Power Electronics Market in the UK: Historical Trends (Since 2019) and Forecasted Estimates (Till 2035)
- 24.6.15. Power Electronics Market in Other European Countries: Historical Trends (Since 2019) and Forecasted Estimates (Till 2035)
- 24.7. Data Triangulation and Validation
25. MARKET OPPORTUNITIES FOR POWER ELECTRONICS IN ASIA
- 25.1. Chapter Overview
- 25.2. Key Assumptions and Methodology
- 25.3. Revenue Shift Analysis
- 25.4. Market Movement Analysis
- 25.5. Penetration-Growth (P-G) Matrix
- 25.6. Power Electronics Market in Asia: Historical Trends (Since 2019) and Forecasted Estimates (Till 2035)
- 25.6.1. Power Electronics Market in China: Historical Trends (Since 2019) and Forecasted Estimates (Till 2035)
- 25.6.2. Power Electronics Market in India: Historical Trends (Since 2019) and Forecasted Estimates (Till 2035)
- 25.6.3. Power Electronics Market in Japan: Historical Trends (Since 2019) and Forecasted Estimates (Till 2035)
- 25.6.4. Power Electronics Market in Singapore: Historical Trends (Since 2019) and Forecasted Estimates (Till 2035)
- 25.6.5. Power Electronics Market in South Korea: Historical Trends (Since 2019) and Forecasted Estimates (Till 2035)
- 25.6.6. Power Electronics Market in Other Asian Countries: Historical Trends (Since 2019) and Forecasted Estimates (Till 2035)
- 25.7. Data Triangulation and Validation
26. MARKET OPPORTUNITIES FOR POWER ELECTRONICS IN MIDDLE EAST AND NORTH AFRICA (MENA)
- 26.1. Chapter Overview
- 26.2. Key Assumptions and Methodology
- 26.3. Revenue Shift Analysis
- 26.4. Market Movement Analysis
- 26.5. Penetration-Growth (P-G) Matrix
- 26.6. Power Electronics Market in Middle East and North Africa (MENA): Historical Trends (Since 2019) and Forecasted Estimates (Till 2035)
- 26.6.1. Power Electronics Market in Egypt: Historical Trends (Since 2019) and Forecasted Estimates (Till 205)
- 26.6.2. Power Electronics Market in Iran: Historical Trends (Since 2019) and Forecasted Estimates (Till 2035)
- 26.6.3. Power Electronics Market in Iraq: Historical Trends (Since 2019) and Forecasted Estimates (Till 2035)
- 26.6.4. Power Electronics Market in Israel: Historical Trends (Since 2019) and Forecasted Estimates (Till 2035)
- 26.6.5. Power Electronics Market in Kuwait: Historical Trends (Since 2019) and Forecasted Estimates (Till 2035)
- 26.6.6. Power Electronics Market in Saudi Arabia: Historical Trends (Since 2019) and Forecasted Estimates (Till 2035)
- 26.6.7. Neuromorphic Computing Marke in United Arab Emirates (UAE): Historical Trends (Since 2019) and Forecasted Estimates (Till 2035)
- 26.6.8. Power Electronics Market in Other MENA Countries: Historical Trends (Since 2019) and Forecasted Estimates (Till 2035)
- 26.7. Data Triangulation and Validation
27. MARKET OPPORTUNITIES FOR POWER ELECTRONICS IN LATIN AMERICA
- 27.1. Chapter Overview
- 27.2. Key Assumptions and Methodology
- 27.3. Revenue Shift Analysis
- 27.4. Market Movement Analysis
- 27.5. Penetration-Growth (P-G) Matrix
- 27.6. Power Electronics Market in Latin America: Historical Trends (Since 2019) and Forecasted Estimates (Till 2035)
- 27.6.1. Power Electronics Market in Argentina: Historical Trends (Since 2019) and Forecasted Estimates (Till 2035)
- 27.6.2. Power Electronics Market in Brazil: Historical Trends (Since 2019) and Forecasted Estimates (Till 2035)
- 27.6.3. Power Electronics Market in Chile: Historical Trends (Since 2019) and Forecasted Estimates (Till 2035)
- 27.6.4. Power Electronics Market in Colombia Historical Trends (Since 2019) and Forecasted Estimates (Till 2035)
- 27.6.5. Power Electronics Market in Venezuela: Historical Trends (Since 2019) and Forecasted Estimates (Till 2035)
- 27.6.6. Power Electronics Market in Other Latin American Countries: Historical Trends (Since 2019) and Forecasted Estimates (Till 2035)
- 27.7. Data Triangulation and Validation
28. MARKET OPPORTUNITIES FOR POWER ELECTRONICS IN REST OF THE WORLD
- 28.1. Chapter Overview
- 28.2. Key Assumptions and Methodology
- 28.3. Revenue Shift Analysis
- 28.4. Market Movement Analysis
- 28.5. Penetration-Growth (P-G) Matrix
- 28.6. Power Electronics Market in Rest of the World: Historical Trends (Since 2019) and Forecasted Estimates (Till 2035)
- 28.6.1. Power Electronics Market in Australia: Historical Trends (Since 2019) and Forecasted Estimates (Till 2035)
- 28.6.2. Power Electronics Market in New Zealand: Historical Trends (Since 2019) and Forecasted Estimates (Till 2035)
- 28.6.3. Power Electronics Market in Other Countries
- 28.7. Data Triangulation and Validation
29. MARKET CONCENTRATION ANALYSIS: DISTRIBUTION BY LEADING PLAYERS
- 29.1. Leading Player 1
- 29.2. Leading Player 2
- 29.3. Leading Player 3
- 29.4. Leading Player 4
- 29.5. Leading Player 5
- 29.6. Leading Player 6
- 29.7. Leading Player 7
- 29.8. Leading Player 8
30. ADJACENT MARKET ANALYSIS
SECTION VII: STRATEGIC TOOLS
31. KEY WINNING STRATEGIES
32. PORTER FIVE FORCES ANALYSIS
33. SWOT ANALYSIS
34. VALUE CHAIN ANALYSIS
35. ROOTS STRATEGIC RECOMMENDATIONS
SECTION VIII: OTHER EXCLUSIVE INSIGHTS
36. INSIGHTS FROM PRIMARY RESEARCH
37. REPORT CONCLUSION
SECTION IX: APPENDIX
38. TABULATED DATA
39. LIST OF COMPANIES AND ORGANIZATIONS
40. CUSTOMIZATION OPPORTUNITIES
41. ROOTS SUBSCRIPTION SERVICES
42. AUTHOR DETAILS
 2025年全球車聯網(V2B)電力電子市場報告
 電力電子轉換器市場-2025年至2030年預測全球電力電子市場-2025年至2030年預測
 2025 年至 2033 年電力電子市場規模、佔有率、趨勢及預測(按設備、材料、應用、電壓、最終用途行業和地區)
 電力電子設備冷卻系統市場-全球產業規模、佔有率、趨勢、機會和預測,按冷卻類型、按功率等級、按應用、按地區和按競爭進行細分,2020-2030 年
 全球電力電子軟體市場規模、佔有率、產業分析報告:按技術、應用、類型和地區分類的展望和預測,2025年~2032年2025年電力電子全球市場報告
 電力電子市場:2025-2030 年全球預測(按組件、技術、功能、設備類型、應用和最終用戶)
 2021-2031年亞太地區抗輻射馬達控制器和馬達驅動器市場報告(範圍、細分、動態和競爭分析)
 2021-2031年北美抗輻射馬達控制器和馬達驅動器市場報告(範圍、細分、動態和競爭分析)