


 |
市場調查報告書
商品編碼
1830270
碳中和的全球市場(~2035年):各活動類型,各元件類型,各對象產業,各類型企業,各地區,產業趨勢,預測Carbon Neutrality Market, Till 2035: Distribution by Type of Activity, Type of Component, Industries Served, Type of Enterprise, and Geographical Regions: Industry Trends and Global Forecasts |
||||||
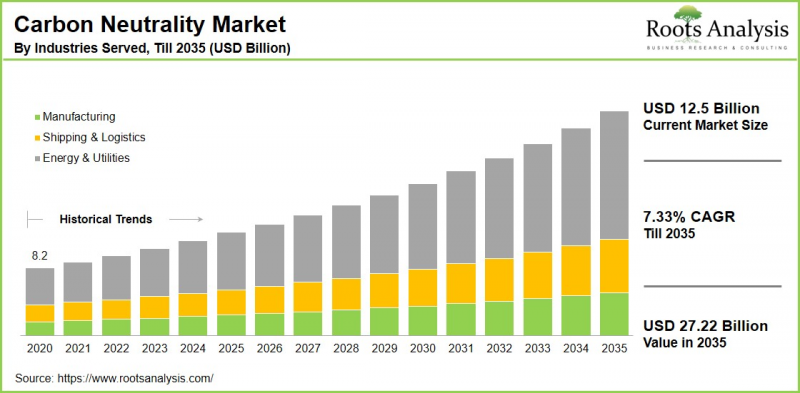
預計到 2035 年,全球碳中和市場規模將從目前的 125 億美元增長至 272.2 億美元,預測期內複合年增長率為 7.33%。
碳中與市場:成長與趨勢
碳中和是指透過旨在減少公司碳足跡的策略來實現淨零碳排放,即釋放到大氣中的二氧化碳量等於移除的二氧化碳量。重要的是,實現碳中和的好處不僅可以解決氣候變遷的負面影響,還可以減少環境污染、改善公眾健康、透過創造綠色就業來促進經濟成長、提高糧食安全和保護生物多樣性。
預計全球碳中和市場在預測期內將保持穩定成長,這主要得益於中國和印度等發展中國家需求的成長。此外,碳中和產品的進步和創新,包括碳捕獲與封存 (CCS) 和直接空氣捕獲,正在引領潮流,幫助各行各業減少排放。微軟等公司正大力投資碳中和工作,並加速這些技術的進步,展現出實現企業永續發展目標的強勁動能。
受上述因素影響,碳中和市場預計在預測期內將大幅成長。
本報告探討了全球碳中和市場,並提供了市場規模估算、機會分析、競爭格局和公司簡介等資訊。
目錄
章節1 報告概要
第1章 序文
第2章 調查手法
第3章 市場動態
第4章 宏觀經濟指標
章節2 定性研究結果
第5章 摘要整理
第6章 簡介
第7章 法規Scenario
章節3 市場概要
第8章 主要企業整體性資料庫
第9章 競爭情形
第10章 閒置頻段的分析
第11章 企業的競爭力的分析
第12章 碳中和市場上Start-Ups生態系統
章節4 企業簡介
第13章 企業簡介
- 章概要
- Carbon Footprint
- Climate Impact
- ClimeCo
- EcoAct
- ENGIE
- ESG Enterprise
- Green Mountain Energy
- SAP
- Schneider Electric
- Terrapass
章節5 市場趨勢
第14章 大趨勢的分析
第15章 未滿足需求的分析
第16章 專利分析
第17章 近幾年的發展
章節6 市場機會分析
第18章 全球碳中和市場
第19章 市場機會:各活動類型
第20章 市場機會:各元件類型
第21章 市場機會:各對象產業
第22章 市場機會:各類型企業
第23章 北美的碳中和市場機會
第24章 歐洲的碳中和市場機會
第25章 亞洲的碳中和市場機會
第26章 中東·北非(MENA)的碳中和市場機會
第27章 南美的碳中和市場機會
第28章 其他地區的碳中和市場機會
第29章 市場集中的分析:各主要企業
第30章 鄰近市場的分析
章節7 策略性工具
第31章 重要的勝利策略
第32章 波特的五力分析
第33章 SWOT的分析
第34章 價值鏈的分析
第35章 Roots的策略性建議
章節8 其他獨家知識和見識
第36章 初步研究結果
第37章 報告的結論
章節9 附錄
Carbon Neutrality Market Overview
As per Roots Analysis, the global carbon neutrality market size is estimated to grow from USD 12.5 billion in the current year USD 27.22 billion by 2035, at a CAGR of 7.33% during the forecast period, till 2035.
The opportunity for carbon neutrality market has been distributed across the following segments:
Type of Activity
- Emissions Reduction
- Renewable Energy Use
Type of Component
- Services
- Solutions
Industries Served
- Manufacturing
- Shipping & Logistics
- Energy & Utilities
Type of Enterprise
- Large Enterprise
- Small and Medium Enterprise
Geographical Regions
- North America
- US
- Canada
- Mexico
- Other North American countries
- Europe
- Austria
- Belgium
- Denmark
- France
- Germany
- Ireland
- Italy
- Netherlands
- Norway
- Russia
- Spain
- Sweden
- Switzerland
- UK
- Other European countries
- Asia
- China
- India
- Japan
- Singapore
- South Korea
- Other Asian countries
- Latin America
- Brazil
- Chile
- Colombia
- Venezuela
- Other Latin American countries
- Middle East and North Africa
- Egypt
- Iran
- Iraq
- Israel
- Kuwait
- Saudi Arabia
- UAE
- Other MENA countries
- Rest of the World
- Australia
- New Zealand
- Other countries
Carbon Neutrality Market: Growth and Trends
Carbon neutrality refers to a condition in which the quantity of carbon dioxide released into the atmosphere matches the amount that is taken out, resulting in a net-zero carbon emissions level through strategies aimed at reducing carbon footprints. Importantly, the benefits of achieving carbon neutrality not only address the negative impacts of climate change but also contribute to decreased environmental pollution, enhanced public health, economic growth through the creation of green jobs, improved food security, and the protection of biodiversity.
The market for carbon neutrality worldwide is projected to experience steady growth during the forecast period, driven by increasing demand in developing nations such as China and India. Further, advancements and innovations in carbon neutrality products, including carbon capture and storage (CCS) as well as direct air capture, are leading this initiative, allowing industries to lower their emissions. Significantly, companies like Microsoft are making considerable investments in carbon neutrality initiatives to speed up the advancement of these technologies, illustrating a trend toward corporate sustainability objectives in attaining carbon neutrality.
Owing to the above mentioned factors, the carbon neutrality market is expected to grow significantly during the forecast period.
Carbon Neutrality Market: Key Segments
Market Share by Type of Activity
Based on type of activity, the global carbon neutrality market is segmented into emissions reduction and renewable energy use. According to our estimates, currently, the naphthenic segment captures the majority of the market share. This is due to its holistic strategy for tackling greenhouse gas emissions across multiple sectors, especially in industries that are heavy on energy consumption.
On the other hand, the renewable energy use segment is projected to experience a comparatively higher CAGR during the forecast period. This growth can be attributed to the rising global energy needs, and increased concerns about energy security.
Market Share by Type of Component
Based on type of component, the global carbon neutrality market is segmented into services and solutions. According to our estimates, currently, the services segment captures the majority of the market share. This is due to the rising complexity of carbon management and the increasing need for expert assistance among organizations aiming to reach their sustainability objectives.
Market Share by Industries Served
Based on industries served, the global carbon neutrality market is segmented into manufacturing, shipping & logistics and energy & utilities. According to our estimates, currently, the energy & utilities segment captures the majority of the market share. Additionally, this segment is anticipated to experience a faster growth rate during the forecast period. This can be attributed to its critical role in developing strategies aimed at reducing greenhouse gas emissions, as it is among the largest sources of carbon emissions.
Market Share by Type of Enterprise
Based on type of enterprise, the global carbon neutrality market is segmented into large enterprise and small and medium enterprises. According to our estimates, currently, the large enterprise segment captures the majority of the market share. This trend can be attributed to their substantial financial resources, allowing them to invest in cutting-edge technologies and carbon neutrality programs.
Market Share by Geographical Regions
Based on geographical regions, the carbon neutrality market is segmented into North America, Europe, Asia, Latin America, Middle East and North Africa, and the rest of the world. According to our estimates, currently, North America captures the majority share of the market. Conversely, Asia is expected to experience a notably higher compound annual growth rate (CAGR) during the forecast period. The primary drivers of this swift growth include strong government commitments from China, Japan, and South Korea to attain net-zero emissions.
Example Players in Carbon Neutrality Market
- Carbon Footprint
- Climate Impact
- ClimeCo
- EcoAct
- ENGIE
- ESG Enterprise
- Green Mountain Energy
- SAP
- Schneider Electric
- Terrapass
Carbon Neutrality Market: Research Coverage
The report on the carbon neutrality market features insights on various sections, including:
- Market Sizing and Opportunity Analysis: An in-depth analysis of the carbon neutrality market, focusing on key market segments, including [A] type of activity, [B] type of component, [C] industries served, [D] type of enterprise, and [E] geographical regions.
- Competitive Landscape: A comprehensive analysis of the companies engaged in the carbon neutrality market, based on several relevant parameters, such as [A] year of establishment, [B] company size, [C] location of headquarters and [D] ownership structure.
- Company Profiles: Elaborate profiles of prominent players engaged in the carbon neutrality market, providing details on [A] location of headquarters, [B] company size, [C] company mission, [D] company footprint, [E] management team, [F] contact details, [G] financial information, [H] operating business segments, [I] carbon neutrality portfolio, [J] moat analysis, [K] recent developments, and an informed future outlook.
- Megatrends: An evaluation of ongoing megatrends in the carbon neutrality industry.
- Patent Analysis: An insightful analysis of patents filed / granted in the carbon neutrality domain, based on relevant parameters, including [A] type of patent, [B]patent publication year, [C] patent age and [D] leading players.
- Recent Developments: An overview of the recent developments made in the carbon neutrality market, along with analysis based on relevant parameters, including [A] year of initiative, [B] type of initiative, [C] geographical distribution and [D] most active players.
- Porter's Five Forces Analysis: An analysis of five competitive forces prevailing in the carbon neutrality market, including threats of new entrants, bargaining power of buyers, bargaining power of suppliers, threats of substitute products and rivalry among existing competitors.
- SWOT Analysis: An insightful SWOT framework, highlighting the strengths, weaknesses, opportunities and threats in the domain. Additionally, it provides Harvey ball analysis, highlighting the relative impact of each SWOT parameter.
- Value Chain Analysis: A comprehensive analysis of the value chain, providing information on the different phases and stakeholders involved in the carbon neutrality market.
Key Questions Answered in this Report
- How many companies are currently engaged in carbon neutrality market?
- Which are the leading companies in this market?
- What factors are likely to influence the evolution of this market?
- What is the current and future market size?
- What is the CAGR of this market?
- How is the current and future market opportunity likely to be distributed across key market segments?
Reasons to Buy this Report
- The report provides a comprehensive market analysis, offering detailed revenue projections of the overall market and its specific sub-segments. This information is valuable to both established market leaders and emerging entrants.
- Stakeholders can leverage the report to gain a deeper understanding of the competitive dynamics within the market. By analyzing the competitive landscape, businesses can make informed decisions to optimize their market positioning and develop effective go-to-market strategies.
- The report offers stakeholders a comprehensive overview of the market, including key drivers, barriers, opportunities, and challenges. This information empowers stakeholders to stay abreast of market trends and make data-driven decisions to capitalize on growth prospects.
Additional Benefits
- Complimentary Excel Data Packs for all Analytical Modules in the Report
- 15% Free Content Customization
- Detailed Report Walkthrough Session with Research Team
- Free Updated report if the report is 6-12 months old or older
TABLE OF CONTENTS
SECTION I: REPORT OVERVIEW
1. PREFACE
- 1.1. Introduction
- 1.2. Market Share Insights
- 1.3. Key Market Insights
- 1.4. Report Coverage
- 1.5. Key Questions Answered
- 1.6. Chapter Outlines
2. RESEARCH METHODOLOGY
- 2.1. Chapter Overview
- 2.2. Research Assumptions
- 2.3. Database Building
- 2.3.1. Data Collection
- 2.3.2. Data Validation
- 2.3.3. Data Analysis
- 2.4. Project Methodology
- 2.4.1. Secondary Research
- 2.4.1.1. Annual Reports
- 2.4.1.2. Academic Research Papers
- 2.4.1.3. Company Websites
- 2.4.1.4. Investor Presentations
- 2.4.1.5. Regulatory Filings
- 2.4.1.6. White Papers
- 2.4.1.7. Industry Publications
- 2.4.1.8. Conferences and Seminars
- 2.4.1.9. Government Portals
- 2.4.1.10. Media and Press Releases
- 2.4.1.11. Newsletters
- 2.4.1.12. Industry Databases
- 2.4.1.13. Roots Proprietary Databases
- 2.4.1.14. Paid Databases and Sources
- 2.4.1.15. Social Media Portals
- 2.4.1.16. Other Secondary Sources
- 2.4.2. Primary Research
- 2.4.2.1. Introduction
- 2.4.2.2. Types
- 2.4.2.2.1. Qualitative
- 2.4.2.2.2. Quantitative
- 2.4.2.3. Advantages
- 2.4.2.4. Techniques
- 2.4.2.4.1. Interviews
- 2.4.2.4.2. Surveys
- 2.4.2.4.3. Focus Groups
- 2.4.2.4.4. Observational Research
- 2.4.2.4.5. Social Media Interactions
- 2.4.2.5. Stakeholders
- 2.4.2.5.1. Company Executives (CXOs)
- 2.4.2.5.2. Board of Directors
- 2.4.2.5.3. Company Presidents and Vice Presidents
- 2.4.2.5.4. Key Opinion Leaders
- 2.4.2.5.5. Research and Development Heads
- 2.4.2.5.6. Technical Experts
- 2.4.2.5.7. Subject Matter Experts
- 2.4.2.5.8. Scientists
- 2.4.2.5.9. Doctors and Other Healthcare Providers
- 2.4.2.6. Ethics and Integrity
- 2.4.2.6.1. Research Ethics
- 2.4.2.6.2. Data Integrity
- 2.4.3. Analytical Tools and Databases
- 2.4.1. Secondary Research
3. MARKET DYNAMICS
- 3.1. Forecast Methodology
- 3.1.1. Top-Down Approach
- 3.1.2. Bottom-Up Approach
- 3.1.3. Hybrid Approach
- 3.2. Market Assessment Framework
- 3.2.1. Total Addressable Market (TAM)
- 3.2.2. Serviceable Addressable Market (SAM)
- 3.2.3. Serviceable Obtainable Market (SOM)
- 3.2.4. Currently Acquired Market (CAM)
- 3.3. Forecasting Tools and Techniques
- 3.3.1. Qualitative Forecasting
- 3.3.2. Correlation
- 3.3.3. Regression
- 3.3.4. Time Series Analysis
- 3.3.5. Extrapolation
- 3.3.6. Convergence
- 3.3.7. Forecast Error Analysis
- 3.3.8. Data Visualization
- 3.3.9. Scenario Planning
- 3.3.10. Sensitivity Analysis
- 3.4. Key Considerations
- 3.4.1. Demographics
- 3.4.2. Market Access
- 3.4.3. Reimbursement Scenarios
- 3.4.4. Industry Consolidation
- 3.5. Robust Quality Control
- 3.6. Key Market Segmentations
- 3.7. Limitations
4. MACRO-ECONOMIC INDICATORS
- 4.1. Chapter Overview
- 4.2. Market Dynamics
- 4.2.1. Time Period
- 4.2.1.1. Historical Trends
- 4.2.1.2. Current and Forecasted Estimates
- 4.2.2. Currency Coverage
- 4.2.2.1. Overview of Major Currencies Affecting the Market
- 4.2.2.2. Impact of Currency Fluctuations on the Industry
- 4.2.3. Foreign Exchange Impact
- 4.2.3.1. Evaluation of Foreign Exchange Rates and Their Impact on Market
- 4.2.3.2. Strategies for Mitigating Foreign Exchange Risk
- 4.2.4. Recession
- 4.2.4.1. Historical Analysis of Past Recessions and Lessons Learnt
- 4.2.4.2. Assessment of Current Economic Conditions and Potential Impact on the Market
- 4.2.5. Inflation
- 4.2.5.1. Measurement and Analysis of Inflationary Pressures in the Economy
- 4.2.5.2. Potential Impact of Inflation on the Market Evolution
- 4.2.6. Interest Rates
- 4.2.6.1. Overview of Interest Rates and Their Impact on the Market
- 4.2.6.2. Strategies for Managing Interest Rate Risk
- 4.2.7. Commodity Flow Analysis
- 4.2.7.1. Type of Commodity
- 4.2.7.2. Origins and Destinations
- 4.2.7.3. Values and Weights
- 4.2.7.4. Modes of Transportation
- 4.2.8. Global Trade Dynamics
- 4.2.8.1. Import Scenario
- 4.2.8.2. Export Scenario
- 4.2.9. War Impact Analysis
- 4.2.9.1. Russian-Ukraine War
- 4.2.9.2. Israel-Hamas War
- 4.2.10. COVID Impact / Related Factors
- 4.2.10.1. Global Economic Impact
- 4.2.10.2. Industry-specific Impact
- 4.2.10.3. Government Response and Stimulus Measures
- 4.2.10.4. Future Outlook and Adaptation Strategies
- 4.2.11. Other Indicators
- 4.2.11.1. Fiscal Policy
- 4.2.11.2. Consumer Spending
- 4.2.11.3. Gross Domestic Product (GDP)
- 4.2.11.4. Employment
- 4.2.11.5. Taxes
- 4.2.11.6. R&D Innovation
- 4.2.11.7. Stock Market Performance
- 4.2.11.8. Supply Chain
- 4.2.11.9. Cross-Border Dynamics
- 4.2.1. Time Period
SECTION II: QUALITATIVE INSIGHTS
5. EXECUTIVE SUMMARY
6. INTRODUCTION
- 6.1. Chapter Overview
- 6.2. Overview of Carbon Neutrality Market
- 6.2.1. Type of Component
- 6.2.2. Type of Industries Served
- 6.2.3. Type of Enterprise
- 6.3. Future Perspective
7. REGULATORY SCENARIO
SECTION III: MARKET OVERVIEW
8. COMPREHENSIVE DATABASE OF LEADING PLAYERS
9. COMPETITIVE LANDSCAPE
- 9.1. Chapter Overview
- 9.2. Carbon Neutrality: Overall Market Landscape
- 9.2.1. Analysis by Year of Establishment
- 9.2.2. Analysis by Company Size
- 9.2.3. Analysis by Location of Headquarters
- 9.2.4. Analysis by Ownership Structure
10. WHITE SPACE ANALYSIS
11. COMPANY COMPETITIVENESS ANALYSIS
12. STARTUP ECOSYSTEM IN THE CARBON NEUTRALITY MARKET
- 12.1. Carbon Neutrality Market: Market Landscape of Startups
- 12.1.1. Analysis by Year of Establishment
- 12.1.2. Analysis by Company Size
- 12.1.3. Analysis by Company Size and Year of Establishment
- 12.1.4. Analysis by Location of Headquarters
- 12.1.5. Analysis by Company Size and Location of Headquarters
- 12.1.6. Analysis by Ownership Structure
- 12.2. Key Findings
SECTION IV: COMPANY PROFILES
13. COMPANY PROFILES
- 13.1. Chapter Overview
- 13.2. Carbon Footprint*
- 13.2.1. Company Overview
- 13.2.2. Company Mission
- 13.2.3. Company Footprint
- 13.2.4. Management Team
- 13.2.5. Contact Details
- 13.2.6. Financial Performance
- 13.2.7. Operating Business Segments
- 13.2.8. Service / Product Portfolio (project specific)
- 13.2.9. MOAT Analysis
- 13.2.10. Recent Developments and Future Outlook
- 13.3. Climate Impact
- 13.4. ClimeCo
- 13.5. EcoAct
- 13.6. ENGIE
- 13.7. ESG Enterprise
- 13.8. Green Mountain Energy
- 13.9. SAP
- 13.10. Schneider Electric
- 13.11. Terrapass
SECTION V: MARKET TRENDS
14. MEGA TRENDS ANALYSIS
15. UNMET NEED ANALYSIS
16. PATENT ANALYSIS
17. RECENT DEVELOPMENTS
- 17.1. Chapter Overview
- 17.2. Recent Funding
- 17.3. Recent Partnerships
- 17.4. Other Recent Initiatives
SECTION VI: MARKET OPPORTUNITY ANALYSIS
18. GLOBAL CARBON NEUTRALITY MARKET
- 18.1. Chapter Overview
- 18.2. Key Assumptions and Methodology
- 18.3. Trends Disruption Impacting Market
- 18.4. Demand Side Trends
- 18.5. Supply Side Trends
- 18.6. Global Carbon Neutrality Market, Historical Trends (Since 2020) and Forecasted Estimates (Till 2035)
- 18.7. Multivariate Scenario Analysis
- 18.7.1. Conservative Scenario
- 18.7.2. Optimistic Scenario
- 18.8. Investment Feasibility Index
- 18.9. Key Market Segmentations
19. MARKET OPPORTUNITIES BASED ON TYPE OF ACTIVITY
- 19.1. Chapter Overview
- 19.2. Key Assumptions and Methodology
- 19.3. Revenue Shift Analysis
- 19.4. Market Movement Analysis
- 19.5. Penetration-Growth (P-G) Matrix
- 19.6. Carbon Neutrality Market for Emissions Reduction: Historical Trends (Since 2020) and Forecasted Estimates (Till 2035)
- 19.7. Carbon Neutrality Market for Renewable Energy Use: Historical Trends (Since 2020) and Forecasted Estimates (Till 2035)
- 19.8. Data Triangulation and Validation
- 19.8.1. Secondary Sources
- 19.8.2. Primary Sources
- 19.8.3. Statistical Modeling
20. MARKET OPPORTUNITIES BASED ON TYPE OF COMPONENT
- 20.1. Chapter Overview
- 20.2. Key Assumptions and Methodology
- 20.3. Revenue Shift Analysis
- 20.4. Market Movement Analysis
- 20.5. Penetration-Growth (P-G) Matrix
- 20.6. Carbon Neutrality Market for Services: Historical Trends (Since 2020) and Forecasted Estimates (Till 2035)
- 20.7. Carbon Neutrality Market for Solutions: Historical Trends (Since 2020) and Forecasted Estimates (Till 2035)
- 20.8. Data Triangulation and Validation
- 20.8.1. Secondary Sources
- 20.8.2. Primary Sources
- 20.8.3. Statistical Modeling
21. MARKET OPPORTUNITIES BASED ON INDUSTRIES SERVED
- 21.1. Chapter Overview
- 21.2. Key Assumptions and Methodology
- 21.3. Revenue Shift Analysis
- 21.4. Market Movement Analysis
- 21.5. Penetration-Growth (P-G) Matrix
- 21.6. Carbon Neutrality Market for Manufacturing: Historical Trends (Since 2020) and Forecasted Estimates (Till 2035)
- 21.7. Carbon Neutrality Market for Shipping & Logistics: Historical Trends (Since 2020) and Forecasted Estimates (Till 2035)
- 21.8. Carbon Neutrality Market for Energy & Utilities: Historical Trends (Since 2020) and Forecasted Estimates (Till 2035)
- 21.9. Data Triangulation and Validation
- 21.9.1. Secondary Sources
- 21.9.2. Primary Sources
- 21.9.3. Statistical Modeling
22. MARKET OPPORTUNITIES BASED ON TYPE OF ENTERPRISE
- 22.1. Chapter Overview
- 22.2. Key Assumptions and Methodology
- 22.3. Revenue Shift Analysis
- 22.4. Market Movement Analysis
- 22.5. Penetration-Growth (P-G) Matrix
- 22.6. Carbon Neutrality Market for Large Enterprise: Historical Trends (Since 2020) and Forecasted Estimates (Till 2035)
- 22.7. Carbon Neutrality Market for Small and Medium Enterprise: Historical Trends (Since 2020) and Forecasted Estimates (Till 2035)
- 22.8. Data Triangulation and Validation
- 22.8.1. Secondary Sources
- 22.8.2. Primary Sources
- 22.8.3. Statistical Modeling
23. MARKET OPPORTUNITIES FOR CARBON NEUTRALITY IN NORTH AMERICA
- 23.1. Chapter Overview
- 23.2. Key Assumptions and Methodology
- 23.3. Revenue Shift Analysis
- 23.4. Market Movement Analysis
- 23.5. Penetration-Growth (P-G) Matrix
- 23.6. Carbon Neutrality Market in North America: Historical Trends (Since 2020) and Forecasted Estimates (Till 2035)
- 23.6.1. Carbon Neutrality Market in the US: Historical Trends (Since 2020) and Forecasted Estimates (Till 2035)
- 23.6.2. Carbon Neutrality Market in Canada: Historical Trends (Since 2020) and Forecasted Estimates (Till 2035)
- 23.6.3. Carbon Neutrality Market in Mexico: Historical Trends (Since 2020) and Forecasted Estimates (Till 2035)
- 23.6.4. Carbon Neutrality Market in Other North American Countries: Historical Trends (Since 2020) and Forecasted Estimates (Till 2035)
- 23.7. Data Triangulation and Validation
24. MARKET OPPORTUNITIES FOR CARBON NEUTRALITY IN EUROPE
- 24.1. Chapter Overview
- 24.2. Key Assumptions and Methodology
- 24.3. Revenue Shift Analysis
- 24.4. Market Movement Analysis
- 24.5. Penetration-Growth (P-G) Matrix
- 24.6. Carbon Neutrality Market in Europe: Historical Trends (Since 2020) and Forecasted Estimates (Till 2035)
- 24.6.1. Carbon Neutrality Market in Austria: Historical Trends (Since 2020) and Forecasted Estimates (Till 2035)
- 24.6.2. Carbon Neutrality Market in Belgium: Historical Trends (Since 2020) and Forecasted Estimates (Till 2035)
- 24.6.3. Carbon Neutrality Market in Denmark: Historical Trends (Since 2020) and Forecasted Estimates (Till 2035)
- 24.6.4. Carbon Neutrality Market in France: Historical Trends (Since 2020) and Forecasted Estimates (Till 2035)
- 24.6.5. Carbon Neutrality Market in Germany: Historical Trends (Since 2020) and Forecasted Estimates (Till 2035)
- 24.6.6. Carbon Neutrality Market in Ireland: Historical Trends (Since 2020) and Forecasted Estimates (Till 2035)
- 24.6.7. Carbon Neutrality Market in Italy: Historical Trends (Since 2020) and Forecasted Estimates (Till 2035)
- 24.6.8. Carbon Neutrality Market in Netherlands: Historical Trends (Since 2020) and Forecasted Estimates (Till 2035)
- 24.6.9. Carbon Neutrality Market in Norway: Historical Trends (Since 2020) and Forecasted Estimates (Till 2035)
- 24.6.10. Carbon Neutrality Market in Russia: Historical Trends (Since 2020) and Forecasted Estimates (Till 2035)
- 24.6.11. Carbon Neutrality Market in Spain: Historical Trends (Since 2020) and Forecasted Estimates (Till 2035)
- 24.6.12. Carbon Neutrality Market in Sweden: Historical Trends (Since 2020) and Forecasted Estimates (Till 2035)
- 24.6.13. Carbon Neutrality Market in Switzerland: Historical Trends (Since 2020) and Forecasted Estimates (Till 2035)
- 24.6.14. Carbon Neutrality Market in the UK: Historical Trends (Since 2020) and Forecasted Estimates (Till 2035)
- 24.6.15. Carbon Neutrality Market in Other European Countries: Historical Trends (Since 2020) and Forecasted Estimates (Till 2035)
- 24.7. Data Triangulation and Validation
25. MARKET OPPORTUNITIES FOR CARBON NEUTRALITY IN ASIA
- 25.1. Chapter Overview
- 25.2. Key Assumptions and Methodology
- 25.3. Revenue Shift Analysis
- 25.4. Market Movement Analysis
- 25.5. Penetration-Growth (P-G) Matrix
- 25.6. Carbon Neutrality Market in Asia: Historical Trends (Since 2020) and Forecasted Estimates (Till 2035)
- 25.6.1. Carbon Neutrality Market in China: Historical Trends (Since 2020) and Forecasted Estimates (Till 2035)
- 25.6.2. Carbon Neutrality Market in India: Historical Trends (Since 2020) and Forecasted Estimates (Till 2035)
- 25.6.3. Carbon Neutrality Market in Japan: Historical Trends (Since 2020) and Forecasted Estimates (Till 2035)
- 25.6.4. Carbon Neutrality Market in Singapore: Historical Trends (Since 2020) and Forecasted Estimates (Till 2035)
- 25.6.5. Carbon Neutrality Market in South Korea: Historical Trends (Since 2020) and Forecasted Estimates (Till 2035)
- 25.6.6. Carbon Neutrality Market in Other Asian Countries: Historical Trends (Since 2020) and Forecasted Estimates (Till 2035)
- 25.7. Data Triangulation and Validation
26. MARKET OPPORTUNITIES FOR CARBON NEUTRALITY IN MIDDLE EAST AND NORTH AFRICA (MENA)
- 26.1. Chapter Overview
- 26.2. Key Assumptions and Methodology
- 26.3. Revenue Shift Analysis
- 26.4. Market Movement Analysis
- 26.5. Penetration-Growth (P-G) Matrix
- 26.6. Carbon Neutrality Market in Middle East and North Africa (MENA): Historical Trends (Since 2020) and Forecasted Estimates (Till 2035)
- 26.6.1. Carbon Neutrality Market in Egypt: Historical Trends (Since 2020) and Forecasted Estimates (Till 205)
- 26.6.2. Carbon Neutrality Market in Iran: Historical Trends (Since 2020) and Forecasted Estimates (Till 2035)
- 26.6.3. Carbon Neutrality Market in Iraq: Historical Trends (Since 2020) and Forecasted Estimates (Till 2035)
- 26.6.4. Carbon Neutrality Market in Israel: Historical Trends (Since 2020) and Forecasted Estimates (Till 2035)
- 26.6.5. Carbon Neutrality Market in Kuwait: Historical Trends (Since 2020) and Forecasted Estimates (Till 2035)
- 26.6.6. Carbon Neutrality Market in Saudi Arabia: Historical Trends (Since 2020) and Forecasted Estimates (Till 2035)
- 26.6.7. Carbon Neutrality Market in United Arab Emirates (UAE): Historical Trends (Since 2020) and Forecasted Estimates (Till 2035)
- 26.6.8. Carbon Neutrality Market in Other MENA Countries: Historical Trends (Since 2020) and Forecasted Estimates (Till 2035)
- 26.7. Data Triangulation and Validation
27. MARKET OPPORTUNITIES FOR CARBON NEUTRALITY IN LATIN AMERICA
- 27.1. Chapter Overview
- 27.2. Key Assumptions and Methodology
- 27.3. Revenue Shift Analysis
- 27.4. Market Movement Analysis
- 27.5. Penetration-Growth (P-G) Matrix
- 27.6. Carbon Neutrality Market in Latin America: Historical Trends (Since 2020) and Forecasted Estimates (Till 2035)
- 27.6.1. Carbon Neutrality Market in Argentina: Historical Trends (Since 2020) and Forecasted Estimates (Till 2035)
- 27.6.2. Carbon Neutrality Market in Brazil: Historical Trends (Since 2020) and Forecasted Estimates (Till 2035)
- 27.6.3. Carbon Neutrality Market in Chile: Historical Trends (Since 2020) and Forecasted Estimates (Till 2035)
- 27.6.4. Carbon Neutrality Market in Colombia Historical Trends (Since 2020) and Forecasted Estimates (Till 2035)
- 27.6.5. Carbon Neutrality Market in Venezuela: Historical Trends (Since 2020) and Forecasted Estimates (Till 2035)
- 27.6.6. Carbon Neutrality Market in Other Latin American Countries: Historical Trends (Since 2020) and Forecasted Estimates (Till 2035)
- 27.7. Data Triangulation and Validation
28. MARKET OPPORTUNITIES FOR CARBON NEUTRALITY IN REST OF THE WORLD
- 28.1. Chapter Overview
- 28.2. Key Assumptions and Methodology
- 28.3. Revenue Shift Analysis
- 28.4. Market Movement Analysis
- 28.5. Penetration-Growth (P-G) Matrix
- 28.6. Carbon Neutrality Market in Rest of the World: Historical Trends (Since 2020) and Forecasted Estimates (Till 2035)
- 28.6.1. Carbon Neutrality Market in Australia: Historical Trends (Since 2020) and Forecasted Estimates (Till 2035)
- 28.6.2. Carbon Neutrality Market in New Zealand: Historical Trends (Since 2020) and Forecasted Estimates (Till 2035)
- 28.6.3. Carbon Neutrality Market in Other Countries
- 28.7. Data Triangulation and Validation
29. MARKET CONCENTRATION ANALYSIS: DISTRIBUTION BY LEADING PLAYERS
- 29.1. Leading Player 1
- 29.2. Leading Player 2
- 29.3. Leading Player 3
- 29.4. Leading Player 4
- 29.5. Leading Player 5
- 29.6. Leading Player 6
- 29.7. Leading Player 7
- 29.8. Leading Player 8
30. ADJACENT MARKET ANALYSIS
SECTION VII: STRATEGIC TOOLS
31. KEY WINNING STRATEGIES
32. PORTER'S FIVE FORCES ANALYSIS
33. SWOT ANALYSIS
34. VALUE CHAIN ANALYSIS
35. ROOTS STRATEGIC RECOMMENDATIONS
- 35.1. Chapter Overview
- 35.2. Key Business-related Strategies
- 35.2.1. Research & Development
- 35.2.2. Product Manufacturing
- 35.2.3. Commercialization / Go-to-Market
- 35.2.4. Sales and Marketing
- 35.3. Key Operations-related Strategies
- 35.3.1. Risk Management
- 35.3.2. Workforce
- 35.3.3. Finance
- 35.3.4. Others
SECTION VIII: OTHER EXCLUSIVE INSIGHTS
36. INSIGHTS FROM PRIMARY RESEARCH
37. REPORT CONCLUSION
SECTION IX: APPENDIX
38. TABULATED DATA
39. LIST OF COMPANIES AND ORGANIZATIONS
40. CUSTOMIZATION OPPORTUNITIES
41. ROOTS SUBSCRIPTION SERVICES
42. AUTHOR DETAILS
 碳中和能源系統市場預測至2034年—全球能源來源、系統類型、儲能整合、組件、應用、最終用戶和區域分析碳中和製造市場預測至2034年——按部署類型、行業、技術、應用、最終用戶和地區分類的全球分析——行業特定分析碳去除技術市場預測至2034年—按類型、組件、儲存形式、應用、最終用戶和地區分類的全球分析
 2026年全球二氧化碳(CO2)礦化市場報告2026年全球低碳智慧職場通勤市場報告
 二氧化碳去除市場:按技術、儲存方法、應用和最終用途行業分類的全球市場預測,2026-2032年
 通訊能源永續性 (TES) 供應商追蹤器 | 範圍 1、2 和 3 碳排放和 ESG 基準
 二氧化碳礦化製程市場分析及預測(至2035年):依類型、產品、服務、技術、組件、應用、原料、製程、最終用戶、安裝類型分類碳中和市場分析及預測(至2035年):按類型、產品類型、服務、技術、組件、應用、最終用戶、解決方案分類
 2026-2034年全球脫碳工業熱系統中心市場規模、佔有率、趨勢與成長分析報告