


 |
市場調查報告書
商品編碼
1821520
界面活性劑的全球市場(~2035年):各類型原料,各界面活性劑類型,各用途類型,各流通管道類型,各地區,產業趨勢,預測Surfactant Market, Till 2035: Distribution by Type of Source, Type of Surfactant, Type of Application, Type of Distribution Channel, and Geographical Regions: Industry Trends and Global Forecasts |
||||||
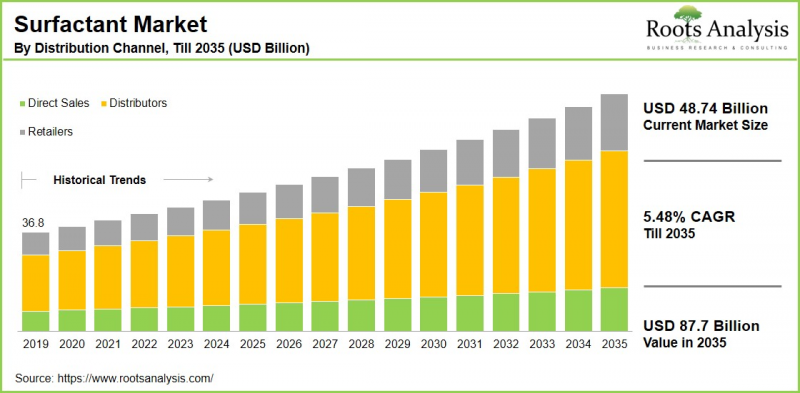
預計到 2035 年,全球界面活性劑市場規模將從目前的 487.4 億美元增長至 877 億美元,預測期內複合年增長率為 5.48%。
界面活性劑市場:成長與趨勢
界面活性劑的生產方法包括化學法和生物法,大致分為兩類:合成界面活性劑和生物界面活性劑。合成界面活性劑因其能夠形成膠束的能力而受到青睞,這有助於混合不相溶物質、提高溶解度並穩定乳液。界面活性劑應用於各種行業,包括洗滌劑、潤滑劑、藥品和化妝品。在各種類型的表面活性劑中,兩性表面活性劑以其pH響應性和溫和性而著稱,非常適合用於個人護理產品。
預計在預測期內,全球表面活性劑市場將大幅成長,這主要得益於中國和印度等新興國家工業的快速發展。這一增長也有望推動全球表面活性劑的銷售。此外,表面活性劑產品的最新創新和製造流程進步包括技術改進、對生物基表面活性劑的需求不斷增長以及生產過程中自動化和人工智慧的引入。
重要的是,人們對廢水風險(尤其是在製藥和個人護理領域)的環境擔憂日益加劇,促使各國政府和監管機構強制使用生物基界面活性劑。此外,提高採收率 (EOR) 技術的進步正在推動新型界面活性劑的開發,這些界面活性劑能夠在嚴苛的油藏條件下有效發揮作用,並實現超低界面張力,從而提高採收率。
本報告研究了全球界面活性劑市場,提供了市場規模估算、機會分析、競爭格局和公司概況。
目錄
章節1 報告概要
第1章 序文
第2章 調查手法
第3章 市場動態
第4章 宏觀經濟指標
章節2 定性知識和見解
第5章 摘要整理
第6章 簡介
第7章 法規Scenario
章節3 市場概要
第8章 主要企業整體性資料庫
第9章 競爭情形
第10章 閒置頻段的分析
第11章 企業的競爭力的分析
第12章 界面活性劑市場上Start-Ups生態系統
章節4 企業簡介
第13章 企業簡介
- 章概要
- Akzo Nobel
- BASF
- Bayer
- Clariant
- Croda International
- Dow
- El Dupont De Nemours
- Evonik Industries
- Huntsman International
- Kao Corporation
- Koppert
- Nouryon
- Nufarm
- Solvay
- Som Phytopharma
- Stepan Company
- UPL
- Valent Biosciences
章節5 市場趨勢
第14章 大趨勢的分析
第15章 未滿足需求的分析
第16章 專利分析
第17章 近幾年的發展
章節6 市場機會分析
第18章 全球界面活性劑市場
第19章 市場機會:各類型原料
第20章 市場機會:各界面活性劑類型
第21章 市場機會:各用途類型
第22章 市場機會:各流通管道類型
第23章 北美的界面活性劑市場機會
第24章 歐洲的界面活性劑市場機會
第25章 亞洲的界面活性劑市場機會
第26章 中東·北非(MENA)的界面活性劑市場機會
第27章 南美的界面活性劑市場機會
第28章 其他地區的界面活性劑市場機會
第29章 市場集中的分析:各主要企業
第30章 鄰近市場的分析
章節7 策略性工具
第31章 重要的勝利策略
第32章 波特的五力分析
第33章 SWOT的分析
第34章 價值鏈的分析
第35章 Roots的策略性建議
章節8 其他獨家知識和見解
第36章 初步研究結果
第37章 報告的結論
章節9 附錄
Surfactant Market Overview
As per Roots Analysis, the global surfactant market size is estimated to grow from USD 48.74 billion in the current year to USD 87.7 billion by 2035, at a CAGR of 5.48% during the forecast period, till 2035.
The opportunity for surfactant market has been distributed across the following segments:
Type of Source
- Biobased
- Synthetic
Type of Surfactant
- Amphoteric
- Anionic
- Cationic
- Nonionic
Type of Application
- Food & Beverages
- Home Care
- Industrial & Institutional Cleaning
- Personal Care
- Plastics
- Textile
- Others
Type of Distribution Channel
- Direct Sales
- Distributors
- Retailers
Geographical Regions
- North America
- US
- Canada
- Mexico
- Other North American countries
- Europe
- Austria
- Belgium
- Denmark
- France
- Germany
- Ireland
- Italy
- Netherlands
- Norway
- Russia
- Spain
- Sweden
- Switzerland
- UK
- Other European countries
- Asia
- China
- India
- Japan
- Singapore
- South Korea
- Other Asian countries
- Latin America
- Brazil
- Chile
- Colombia
- Venezuela
- Other Latin American countries
- Middle East and North Africa
- Egypt
- Iran
- Iraq
- Israel
- Kuwait
- Saudi Arabia
- UAE
- Other MENA countries
- Rest of the World
- Australia
- New Zealand
- Other countries
Surfactant Market: Growth and Trends
Surfactants are produced through chemical methods as well as biological approaches, leading to two primary types, namely synthetic surfactants and biosurfactants. It is important to note that synthetic surfactants are preferred due to their ability to create micelles, which aids in the mixing of immiscible substances, improves solubility, and stabilizes emulsions. Surfactants have applications in a range of industries, including detergents, lubricants, pharmaceuticals, and cosmetics. Among the various types of surfactants, amphoteric surfactants are distinguished by their pH responsiveness and gentleness, making them suitable for personal care products.
The global market for surfactants is projected to experience significant growth during the forecast period, driven by rapid industrial development in emerging nations like China and India. This growth is also expected to boost global surfactant sales. Furthermore, recent innovations in surfactant products and advancements in manufacturing techniques include improved technologies, rising demand for bio-based surfactants, and the incorporation of automation and AI in production processes.
Importantly, increasing environmental concerns regarding wastewater risks, particularly in the pharmaceuticals and personal care sectors, have led various national authorities and regulatory bodies to require the use of bio-based surfactants. Moreover, advancements in enhanced oil recovery (EOR) have led to the development of new categories of surfactants that function effectively in difficult reservoir conditions, achieving ultra-low interfacial tension and improving oil recovery.
Surfactant Market: Key Segments
Market Share by Type of Source
Based on type of source, the global surfactant market is segmented into biobased and synthetic. According to our estimates, currently, the biobased segment captures the majority of the market share. Moreover, this segment is anticipated to grow at a faster pace throughout the forecast period, owing to the growing consumer awareness and a preference for sustainable products.
Market Share by Type of Surfactant
Based on type of surfactant, the global surfactant market is segmented into amphoteric, anionic, cationic and nonionic. According to our estimates, currently, the anionic segment captures the majority of the market share. This can be attributed to their exceptional cleaning and foaming capabilities, making them highly efficient for various applications, especially in household and industrial cleaning products.
Market Share by Type of Application
Based on type of application, the global surfactant market is segmented into food & beverages, home care, industrial & institutional cleaning, personal care, plastics, textile and others. According to our estimates, currently, the industrial & institutional cleaning segment captures the majority of the market share. This trend is primarily due to the heightened emphasis on workplace hygiene, especially after COVID-19 pandemic.
However, the personal care segment is expected to grow at a relatively higher CAGR during the forecast period. This can be attributed to increased consumer awareness regarding hygiene and cleanliness, resulting in a higher demand for products like shampoos and body washes that incorporate surfactants for their cleansing abilities.
Market Share by Type of Distribution Channel
Based on type of distribution channel, the global surfactant market is segmented direct sales, distributors and retailers. According to our estimates, currently, the distributors segment captures the majority of the market share. This can be attributed to their capability to manage large quantities of surfactants and provide extensive coverage across various markets, as well as the rising global demand for efficient supply chain solutions in the industrial surfactant sector.
Market Share by Geographical Regions
Based on geographical regions, the surfactant market is segmented into North America, Europe, Asia, Latin America, Middle East and North Africa, and the rest of the world. According to our estimates, currently, Asia captures the majority share of the market. This can be attributed to rapid industrialization, urban growth, and an expanding population that boosts demand in various sectors such as personal care, household cleaning, and industrial uses.
Example Players in Surfactant Market
- Akzonobel
- BASF
- Bayer
- Clariant
- Croda International
- Dow
- El Dupont De Nemours
- Evonik Industries
- Huntsman International
- Kao Corporation
- Koppert
- Nouryon
- Nufarm
- Solvay
- Som Phytopharma
- Stepan Company
- UPL
- Valent Biosciences
Surfactant Market: Research Coverage
The report on the surfactant market features insights on various sections, including:
- Market Sizing and Opportunity Analysis: An in-depth analysis of the surfactant market, focusing on key market segments, including [A] type of source, [B] type of surfactant, [C] type of application, [D] type of distribution channel, and [E] geographical regions.
- Competitive Landscape: A comprehensive analysis of the companies engaged in the surfactant market, based on several relevant parameters, such as [A] year of establishment, [B] company size, [C] location of headquarters and [D] ownership structure.
- Company Profiles: Elaborate profiles of prominent players engaged in the surfactant market, providing details on [A] location of headquarters, [B] company size, [C] company mission, [D] company footprint, [E] management team, [F] contact details, [G] financial information, [H] operating business segments, [I] surfactant portfolio, [J] moat analysis, [K] recent developments, and an informed future outlook.
- Megatrends: An evaluation of ongoing megatrends in the surfactant industry.
- Patent Analysis: An insightful analysis of patents filed / granted in the surfactant domain, based on relevant parameters, including [A] type of patent, [B] patent publication year, [C] patent age and [D] leading players.
- Recent Developments: An overview of the recent developments made in the surfactant market, along with analysis based on relevant parameters, including [A] year of initiative, [B] type of initiative, [C] geographical distribution and [D] most active players.
- Porter's Five Forces Analysis: An analysis of five competitive forces prevailing in the surfactant market, including threats of new entrants, bargaining power of buyers, bargaining power of suppliers, threats of substitute products and rivalry among existing competitors
- SWOT Analysis: An insightful SWOT framework, highlighting the strengths, weaknesses, opportunities and threats in the domain. Additionally, it provides Harvey ball analysis, highlighting the relative impact of each SWOT parameter.
- Value Chain Analysis: A comprehensive analysis of the value chain, providing information on the different phases and stakeholders involved in the surfactant market.
Key Questions Answered in this Report
- How many companies are currently engaged in surfactant market?
- Which are the leading companies in this market?
- What factors are likely to influence the evolution of this market?
- What is the current and future market size?
- What is the CAGR of this market?
- How is the current and future market opportunity likely to be distributed across key market segments?
Reasons to Buy this Report
- The report provides a comprehensive market analysis, offering detailed revenue projections of the overall market and its specific sub-segments. This information is valuable to both established market leaders and emerging entrants.
- Stakeholders can leverage the report to gain a deeper understanding of the competitive dynamics within the market. By analyzing the competitive landscape, businesses can make informed decisions to optimize their market positioning and develop effective go-to-market strategies.
- The report offers stakeholders a comprehensive overview of the market, including key drivers, barriers, opportunities, and challenges. This information empowers stakeholders to stay abreast of market trends and make data-driven decisions to capitalize on growth prospects.
Additional Benefits
- Complimentary Excel Data Packs for all Analytical Modules in the Report
- 15% Free Content Customization
- Detailed Report Walkthrough Session with Research Team
- Free Updated report if the report is 6-12 months old or older
TABLE OF CONTENTS
SECTION I: REPORT OVERVIEW
1. PREFACE
- 1.1. Introduction
- 1.2. Market Share Insights
- 1.3. Key Market Insights
- 1.4. Report Coverage
- 1.5. Key Questions Answered
- 1.6. Chapter Outlines
2. RESEARCH METHODOLOGY
- 2.1. Chapter Overview
- 2.2. Research Assumptions
- 2.3. Database Building
- 2.3.1. Data Collection
- 2.3.2. Data Validation
- 2.3.3. Data Analysis
- 2.4. Project Methodology
- 2.4.1. Secondary Research
- 2.4.1.1. Annual Reports
- 2.4.1.2. Academic Research Papers
- 2.4.1.3. Company Websites
- 2.4.1.4. Investor Presentations
- 2.4.1.5. Regulatory Filings
- 2.4.1.6. White Papers
- 2.4.1.7. Industry Publications
- 2.4.1.8. Conferences and Seminars
- 2.4.1.9. Government Portals
- 2.4.1.10. Media and Press Releases
- 2.4.1.11. Newsletters
- 2.4.1.12. Industry Databases
- 2.4.1.13. Roots Proprietary Databases
- 2.4.1.14. Paid Databases and Sources
- 2.4.1.15. Social Media Portals
- 2.4.1.16. Other Secondary Sources
- 2.4.2. Primary Research
- 2.4.2.1. Introduction
- 2.4.2.2. Types
- 2.4.2.2.1. Qualitative
- 2.4.2.2.2. Quantitative
- 2.4.2.3. Advantages
- 2.4.2.4. Techniques
- 2.4.2.4.1. Interviews
- 2.4.2.4.2. Surveys
- 2.4.2.4.3. Focus Groups
- 2.4.2.4.4. Observational Research
- 2.4.2.4.5. Social Media Interactions
- 2.4.2.5. Stakeholders
- 2.4.2.5.1. Company Executives (CXOs)
- 2.4.2.5.2. Board of Directors
- 2.4.2.5.3. Company Presidents and Vice Presidents
- 2.4.2.5.4. Key Opinion Leaders
- 2.4.2.5.5. Research and Development Heads
- 2.4.2.5.6. Technical Experts
- 2.4.2.5.7. Subject Matter Experts
- 2.4.2.5.8. Scientists
- 2.4.2.5.9. Doctors and Other Healthcare Providers
- 2.4.2.6. Ethics and Integrity
- 2.4.2.6.1. Research Ethics
- 2.4.2.6.2. Data Integrity
- 2.4.3. Analytical Tools and Databases
- 2.4.1. Secondary Research
3. MARKET DYNAMICS
- 3.1. Forecast Methodology
- 3.1.1. Top-Down Approach
- 3.1.2. Bottom-Up Approach
- 3.1.3. Hybrid Approach
- 3.2. Market Assessment Framework
- 3.2.1. Total Addressable Market (TAM)
- 3.2.2. Serviceable Addressable Market (SAM)
- 3.2.3. Serviceable Obtainable Market (SOM)
- 3.2.4. Currently Acquired Market (CAM)
- 3.3. Forecasting Tools and Techniques
- 3.3.1. Qualitative Forecasting
- 3.3.2. Correlation
- 3.3.3. Regression
- 3.3.4. Time Series Analysis
- 3.3.5. Extrapolation
- 3.3.6. Convergence
- 3.3.7. Forecast Error Analysis
- 3.3.8. Data Visualization
- 3.3.9. Scenario Planning
- 3.3.10. Sensitivity Analysis
- 3.4. Key Considerations
- 3.4.1. Demographics
- 3.4.2. Market Access
- 3.4.3. Reimbursement Scenarios
- 3.4.4. Industry Consolidation
- 3.5. Robust Quality Control
- 3.6. Key Market Segmentations
- 3.7. Limitations
4. MACRO-ECONOMIC INDICATORS
- 4.1. Chapter Overview
- 4.2. Market Dynamics
- 4.2.1. Time Period
- 4.2.1.1. Historical Trends
- 4.2.1.2. Current and Forecasted Estimates
- 4.2.2. Currency Coverage
- 4.2.2.1. Overview of Major Currencies Affecting the Market
- 4.2.2.2. Impact of Currency Fluctuations on the Industry
- 4.2.3. Foreign Exchange Impact
- 4.2.3.1. Evaluation of Foreign Exchange Rates and Their Impact on Market
- 4.2.3.2. Strategies for Mitigating Foreign Exchange Risk
- 4.2.4. Recession
- 4.2.4.1. Historical Analysis of Past Recessions and Lessons Learnt
- 4.2.4.2. Assessment of Current Economic Conditions and Potential Impact on the Market
- 4.2.5. Inflation
- 4.2.5.1. Measurement and Analysis of Inflationary Pressures in the Economy
- 4.2.5.2. Potential Impact of Inflation on the Market Evolution
- 4.2.6. Interest Rates
- 4.2.6.1. Overview of Interest Rates and Their Impact on the Market
- 4.2.6.2. Strategies for Managing Interest Rate Risk
- 4.2.7. Commodity Flow Analysis
- 4.2.7.1. Type of Commodity
- 4.2.7.2. Origins and Destinations
- 4.2.7.3. Values and Weights
- 4.2.7.4. Modes of Transportation
- 4.2.8. Global Trade Dynamics
- 4.2.8.1. Import Scenario
- 4.2.8.2. Export Scenario
- 4.2.9. War Impact Analysis
- 4.2.9.1. Russian-Ukraine War
- 4.2.9.2. Israel-Hamas War
- 4.2.10. COVID Impact / Related Factors
- 4.2.10.1. Global Economic Impact
- 4.2.10.2. Industry-specific Impact
- 4.2.10.3. Government Response and Stimulus Measures
- 4.2.10.4. Future Outlook and Adaptation Strategies
- 4.2.11. Other Indicators
- 4.2.11.1. Fiscal Policy
- 4.2.11.2. Consumer Spending
- 4.2.11.3. Gross Domestic Product (GDP)
- 4.2.11.4. Employment
- 4.2.11.5. Taxes
- 4.2.11.6. R&D Innovation
- 4.2.11.7. Stock Market Performance
- 4.2.11.8. Supply Chain
- 4.2.11.9. Cross-Border Dynamics
- 4.2.1. Time Period
SECTION II: QUALITATIVE INSIGHTS
5. EXECUTIVE SUMMARY
6. INTRODUCTION
- 6.1. Chapter Overview
- 6.2. Overview of Source Market
- 6.2.1. Type of Source
- 6.2.2. Type of Surfactants
- 6.2.3. Type of Application
- 6.2.4. Type of Distribution Channel
- 6.3. Future Perspective
7. REGULATORY SCENARIO
SECTION III: MARKET OVERVIEW
8. COMPREHENSIVE DATABASE OF LEADING PLAYERS
9. COMPETITIVE LANDSCAPE
- 9.1. Chapter Overview
- 9.2. Surfactant: Overall Market Landscape
- 9.2.1. Analysis by Year of Establishment
- 9.2.2. Analysis by Company Size
- 9.2.3. Analysis by Location of Headquarters
- 9.2.4. Analysis by Ownership Structure
10. WHITE SPACE ANALYSIS
11. COMPANY COMPETITIVENESS ANALYSIS
12. STARTUP ECOSYSTEM IN THE SURFACTANT MARKET
- 12.1. Surfactant Market: Market Landscape of Startups
- 12.1.1. Analysis by Year of Establishment
- 12.1.2. Analysis by Company Size
- 12.1.3. Analysis by Company Size and Year of Establishment
- 12.1.4. Analysis by Location of Headquarters
- 12.1.5. Analysis by Company Size and Location of Headquarters
- 12.1.6. Analysis by Ownership Structure
- 12.2. Key Findings
SECTION IV: COMPANY PROFILES
13. COMPANY PROFILES
- 13.1. Chapter Overview
- 13.2. Akzo Nobel*
- 13.2.1. Company Overview
- 13.2.2. Company Mission
- 13.2.3. Company Footprint
- 13.2.4. Management Team
- 13.2.5. Contact Details
- 13.2.6. Financial Performance
- 13.2.7. Operating Business Segments
- 13.2.8. Service / Product Portfolio (project specific)
- 13.2.9. MOAT Analysis
- 13.2.10. Recent Developments and Future Outlook
- 13.3. BASF
- 13.4. Bayer
- 13.5. Clariant
- 13.6. Croda International
- 13.7. Dow
- 13.8. El Dupont De Nemours
- 13.9. Evonik Industries
- 13.10. Huntsman International
- 13.11. Kao Corporation
- 13.12. Koppert
- 13.13. Nouryon
- 13.14. Nufarm
- 13.15. Solvay
- 13.16. Som Phytopharma
- 13.17. Stepan Company
- 13.18. UPL
- 13.19. Valent Biosciences
SECTION V: MARKET TRENDS
14. MEGA TRENDS ANALYSIS
15. UNMET NEED ANALYSIS
16. PATENT ANALYSIS
17. RECENT DEVELOPMENTS
- 17.1. Chapter Overview
- 17.2. Recent Funding
- 17.3. Recent Partnerships
- 17.4. Other Recent Initiatives
SECTION VI: MARKET OPPORTUNITY ANALYSIS
18. GLOBAL SURFACTANT MARKET
- 18.1. Chapter Overview
- 18.2. Key Assumptions and Methodology
- 18.3. Trends Disruption Impacting Market
- 18.4. Demand Side Trends
- 18.5. Supply Side Trends
- 18.6. Global Surfactant Market, Historical Trends (Since 2019) and Forecasted Estimates (Till 2035)
- 18.7. Multivariate Scenario Analysis
- 18.7.1. Conservative Scenario
- 18.7.2. Optimistic Scenario
- 18.8. Investment Feasibility Index
- 18.9. Key Market Segmentations
19. MARKET OPPORTUNITIES BASED ON TYPE OF SOURCE
- 19.1. Chapter Overview
- 19.2. Key Assumptions and Methodology
- 19.3. Revenue Shift Analysis
- 19.4. Market Movement Analysis
- 19.5. Penetration-Growth (P-G) Matrix
- 19.6. Surfactant Market for Biobased: Historical Trends (Since 2019) and Forecasted Estimates (Till 2035)
- 19.7. Surfactant Market for Synthetic: Historical Trends (Since 2019) and Forecasted Estimates (Till 2035)
- 19.8. Data Triangulation and Validation
- 19.8.1. Secondary Sources
- 19.8.2. Primary Sources
- 19.8.3. Statistical Modeling
20. MARKET OPPORTUNITIES BASED ON TYPE OF SURFACTANT
- 20.1. Chapter Overview
- 20.2. Key Assumptions and Methodology
- 20.3. Revenue Shift Analysis
- 20.4. Market Movement Analysis
- 20.5. Penetration-Growth (P-G) Matrix
- 20.6. Surfactant Market for Amphoteric: Historical Trends (Since 2019) and Forecasted Estimates (Till 2035)
- 20.7. Surfactant Market for Anionic: Historical Trends (Since 2019) and Forecasted Estimates (Till 2035)
- 20.8. Surfactant Market for Cationic: Historical Trends (Since 2019) and Forecasted Estimates (Till 2035)
- 20.9. Surfactant Market for Nonionic: Historical Trends (Since 2019) and Forecasted Estimates (Till 2035)
- 20.10. Data Triangulation and Validation
- 20.10.1. Secondary Sources
- 20.10.2. Primary Sources
- 20.10.3. Statistical Modeling
21. MARKET OPPORTUNITIES BASED ON TYPE OF APPLICATION
- 21.1. Chapter Overview
- 21.2. Key Assumptions and Methodology
- 21.3. Revenue Shift Analysis
- 21.4. Market Movement Analysis
- 21.5. Penetration-Growth (P-G) Matrix
- 21.6. Surfactant Market for Food & Beverages: Historical Trends (Since 2019) and Forecasted Estimates (Till 2035)
- 21.7. Surfactant Market for Home Care: Historical Trends (Since 2019) and Forecasted Estimates (Till 2035)
- 21.8. Surfactant Market for Industrial & Institutional Cleaning: Historical Trends (Since 2019) and Forecasted Estimates (Till 2035)
- 21.9. Surfactant Market for Personal Care: Historical Trends (Since 2019) and Forecasted Estimates (Till 2035)
- 21.10. Surfactant Market for Plastics: Historical Trends (Since 2019) and Forecasted Estimates (Till 2035)
- 21.11. Surfactant Market for Textile: Historical Trends (Since 2019) and Forecasted Estimates (Till 2035)
- 21.12. Surfactant Market for Others: Historical Trends (Since 2019) and Forecasted Estimates (Till 2035)
- 21.13. Data Triangulation and Validation
- 21.13.1. Secondary Sources
- 21.13.2. Primary Sources
- 21.13.3. Statistical Modeling
22. MARKET OPPORTUNITIES BASED ON TYPE OF DISTRIBUTION CHANNEL
- 22.1. Chapter Overview
- 22.2. Key Assumptions and Methodology
- 22.3. Revenue Shift Analysis
- 22.4. Market Movement Analysis
- 22.5. Penetration-Growth (P-G) Matrix
- 22.6. Surfactant Market for Direct Sales: Historical Trends (Since 2019) and Forecasted Estimates (Till 2035)
- 22.7. Surfactant Market for Distributors: Historical Trends (Since 2019) and Forecasted Estimates (Till 2035)
- 22.8. Surfactant Market for Retailers: Historical Trends (Since 2019) and Forecasted Estimates (Till 2035)
- 22.9. Data Triangulation and Validation
- 22.9.1. Secondary Sources
- 22.9.2. Primary Sources
- 22.9.3. Statistical Modeling
23. MARKET OPPORTUNITIES FOR SURFACTANTS IN NORTH AMERICA
- 23.1. Chapter Overview
- 23.2. Key Assumptions and Methodology
- 23.3. Revenue Shift Analysis
- 23.4. Market Movement Analysis
- 23.5. Penetration-Growth (P-G) Matrix
- 23.6. Surfactant Market in North America: Historical Trends (Since 2019) and Forecasted Estimates (Till 2035)
- 23.6.1. Surfactant Market in the US: Historical Trends (Since 2019) and Forecasted Estimates (Till 2035)
- 23.6.2. Surfactant Market in Canada: Historical Trends (Since 2019) and Forecasted Estimates (Till 2035)
- 23.6.3. Surfactant Market in Mexico: Historical Trends (Since 2019) and Forecasted Estimates (Till 2035)
- 23.6.4. Surfactant Market in Other North American Countries: Historical Trends (Since 2019) and Forecasted Estimates (Till 2035)
- 23.7. Data Triangulation and Validation
24. MARKET OPPORTUNITIES FOR SURFACTANTS IN EUROPE
- 24.1. Chapter Overview
- 24.2. Key Assumptions and Methodology
- 24.3. Revenue Shift Analysis
- 24.4. Market Movement Analysis
- 24.5. Penetration-Growth (P-G) Matrix
- 24.6. Surfactant Market in Europe: Historical Trends (Since 2019) and Forecasted Estimates (Till 2035)
- 24.6.1. Surfactant Market in Austria: Historical Trends (Since 2019) and Forecasted Estimates (Till 2035)
- 24.6.2. Surfactant Market in Belgium: Historical Trends (Since 2019) and Forecasted Estimates (Till 2035)
- 24.6.3. Surfactant Market in Denmark: Historical Trends (Since 2019) and Forecasted Estimates (Till 2035)
- 24.6.4. Surfactant Market in France: Historical Trends (Since 2019) and Forecasted Estimates (Till 2035)
- 24.6.5. Surfactant Market in Germany: Historical Trends (Since 2019) and Forecasted Estimates (Till 2035)
- 24.6.6. Surfactant Market in Ireland: Historical Trends (Since 2019) and Forecasted Estimates (Till 2035)
- 24.6.7. Surfactant Market in Italy: Historical Trends (Since 2019) and Forecasted Estimates (Till 2035)
- 24.6.8. Surfactant Market in Netherlands: Historical Trends (Since 2019) and Forecasted Estimates (Till 2035)
- 24.6.9. Surfactant Market in Norway: Historical Trends (Since 2019) and Forecasted Estimates (Till 2035)
- 24.6.10. Surfactant Market in Russia: Historical Trends (Since 2019) and Forecasted Estimates (Till 2035)
- 24.6.11. Surfactant Market in Spain: Historical Trends (Since 2019) and Forecasted Estimates (Till 2035)
- 24.6.12. Surfactant Market in Sweden: Historical Trends (Since 2019) and Forecasted Estimates (Till 2035)
- 24.6.13. Surfactant Market in Switzerland: Historical Trends (Since 2019) and Forecasted Estimates (Till 2035)
- 24.6.14. Surfactant Market in the UK: Historical Trends (Since 2019) and Forecasted Estimates (Till 2035)
- 24.6.15. Surfactant Market in Other European Countries: Historical Trends (Since 2019) and Forecasted Estimates (Till 2035)
- 24.7. Data Triangulation and Validation
25. MARKET OPPORTUNITIES FOR SURFACTANTS IN ASIA
- 25.1. Chapter Overview
- 25.2. Key Assumptions and Methodology
- 25.3. Revenue Shift Analysis
- 25.4. Market Movement Analysis
- 25.5. Penetration-Growth (P-G) Matrix
- 25.6. Surfactant Market in Asia: Historical Trends (Since 2019) and Forecasted Estimates (Till 2035)
- 25.6.1. Surfactant Market in China: Historical Trends (Since 2019) and Forecasted Estimates (Till 2035)
- 25.6.2. Surfactant Market in India: Historical Trends (Since 2019) and Forecasted Estimates (Till 2035)
- 25.6.3. Surfactant Market in Japan: Historical Trends (Since 2019) and Forecasted Estimates (Till 2035)
- 25.6.4. Surfactant Market in Singapore: Historical Trends (Since 2019) and Forecasted Estimates (Till 2035)
- 25.6.5. Surfactant Market in South Korea: Historical Trends (Since 2019) and Forecasted Estimates (Till 2035)
- 25.6.6. Surfactant Market in Other Asian Countries: Historical Trends (Since 2019) and Forecasted Estimates (Till 2035)
- 25.7. Data Triangulation and Validation
26. MARKET OPPORTUNITIES FOR SURFACTANTS IN MIDDLE EAST AND NORTH AFRICA (MENA)
- 26.1. Chapter Overview
- 26.2. Key Assumptions and Methodology
- 26.3. Revenue Shift Analysis
- 26.4. Market Movement Analysis
- 26.5. Penetration-Growth (P-G) Matrix
- 26.6. Surfactant Market in Middle East and North Africa (MENA): Historical Trends (Since 2019) and Forecasted Estimates (Till 2035)
- 26.6.1. Surfactant Market in Egypt: Historical Trends (Since 2019) and Forecasted Estimates (Till 205)
- 26.6.2. Surfactant Market in Iran: Historical Trends (Since 2019) and Forecasted Estimates (Till 2035)
- 26.6.3. Surfactant Market in Iraq: Historical Trends (Since 2019) and Forecasted Estimates (Till 2035)
- 26.6.4. Surfactant Market in Israel: Historical Trends (Since 2019) and Forecasted Estimates (Till 2035)
- 26.6.5. Surfactant Market in Kuwait: Historical Trends (Since 2019) and Forecasted Estimates (Till 2035)
- 26.6.6. Surfactant Market in Saudi Arabia: Historical Trends (Since 2019) and Forecasted Estimates (Till 2035)
- 26.6.7. Surfactant Market in United Arab Emirates (UAE): Historical Trends (Since 2019) and Forecasted Estimates (Till 2035)
- 26.6.8. Surfactant Market in Other MENA Countries: Historical Trends (Since 2019) and Forecasted Estimates (Till 2035)
- 26.7. Data Triangulation and Validation
27. MARKET OPPORTUNITIES FOR SURFACTANTS IN LATIN AMERICA
- 27.1. Chapter Overview
- 27.2. Key Assumptions and Methodology
- 27.3. Revenue Shift Analysis
- 27.4. Market Movement Analysis
- 27.5. Penetration-Growth (P-G) Matrix
- 27.6. Surfactant Market in Latin America: Historical Trends (Since 2019) and Forecasted Estimates (Till 2035)
- 27.6.1. Surfactant Market in Argentina: Historical Trends (Since 2019) and Forecasted Estimates (Till 2035)
- 27.6.2. Surfactant Market in Brazil: Historical Trends (Since 2019) and Forecasted Estimates (Till 2035)
- 27.6.3. Surfactant Market in Chile: Historical Trends (Since 2019) and Forecasted Estimates (Till 2035)
- 27.6.4. Surfactant Market in Colombia Historical Trends (Since 2019) and Forecasted Estimates (Till 2035)
- 27.6.5. Surfactant Market in Venezuela: Historical Trends (Since 2019) and Forecasted Estimates (Till 2035)
- 27.6.6. Surfactant Market in Other Latin American Countries: Historical Trends (Since 2019) and Forecasted Estimates (Till 2035)
- 27.7. Data Triangulation and Validation
28. MARKET OPPORTUNITIES FOR SURFACTANTS IN REST OF THE WORLD
- 28.1. Chapter Overview
- 28.2. Key Assumptions and Methodology
- 28.3. Revenue Shift Analysis
- 28.4. Market Movement Analysis
- 28.5. Penetration-Growth (P-G) Matrix
- 28.6. Surfactant Market in Rest of the World: Historical Trends (Since 2019) and Forecasted Estimates (Till 2035)
- 28.6.1. Surfactant Market in Australia: Historical Trends (Since 2019) and Forecasted Estimates (Till 2035)
- 28.6.2. Surfactant Market in New Zealand: Historical Trends (Since 2019) and Forecasted Estimates (Till 2035)
- 28.6.3. Surfactant Market in Other Countries
- 28.7. Data Triangulation and Validation
29. MARKET CONCENTRATION ANALYSIS: DISTRIBUTION BY LEADING PLAYERS
- 29.1. Leading Player 1
- 29.2. Leading Player 2
- 29.3. Leading Player 3
- 29.4. Leading Player 4
- 29.5. Leading Player 5
- 29.6. Leading Player 6
- 29.7. Leading Player 7
- 29.8. Leading Player 8
30. ADJACENT MARKET ANALYSIS
SECTION VII: STRATEGIC TOOLS
31. KEY WINNING STRATEGIES
32. PORTER'S FIVE FORCES ANALYSIS
33. SWOT ANALYSIS
34. VALUE CHAIN ANALYSIS
35. ROOTS STRATEGIC RECOMMENDATIONS
- 35.1. Chapter Overview
- 35.2. Key Business-related Strategies
- 35.2.1. Research & Development
- 35.2.2. Product Manufacturing
- 35.2.3. Commercialization / Go-to-Market
- 35.2.4. Sales and Marketing
- 35.3. Key Operations-related Strategies
- 35.3.1. Risk Management
- 35.3.2. Workforce
- 35.3.3. Finance
- 35.3.4. Others
SECTION VIII: OTHER EXCLUSIVE INSIGHTS
36. INSIGHTS FROM PRIMARY RESEARCH
37. REPORT CONCLUSION
SECTION IX: APPENDIX
38. TABULATED DATA
39. LIST OF COMPANIES AND ORGANIZATIONS
40. CUSTOMIZATION OPPORTUNITIES
41. ROOTS SUBSCRIPTION SERVICES
42. AUTHOR DETAILS
 兩性界面活性劑市場-全球產業規模、佔有率、趨勢、機會和預測,按類型、應用、地區和競爭格局分類,2020-2030年預測
 界面活性劑市場:2025-2032 年全球預測(按產品、原料、功能和應用)界面活性劑提高採收率市場按類型、來源、技術、等級、功能和應用分類-全球預測,2025-2032年
 全球界面活性劑市場:2025-2030 年預測
 界面活性劑市場規模、佔有率和趨勢分析報告:按來源、產品、應用、地區和細分市場預測,2025-2033 年
 2025年微生物生物界面活性劑全球市場報告
 全球陽離子界面活性劑市場需求、預測分析(2018-2034)2025年表面活性劑全球市場報告
 界面活性劑市場規模、佔有率、成長分析(按類型、表面活性劑、應用、地區)- 2025-2032 年產業預測
 過度潤濕界面活性劑市場報告:趨勢、預測和競爭分析(至 2031 年)