


 |
市場調查報告書
商品編碼
1821505
抗肥胖藥市場:2035年前的產業趨勢和全球預測 - 各分子類型,-+化合物,各作用機制,各促效劑類型,各作用途徑,各給藥途徑,各地區,預測銷售額,主要企業Anti-Obesity Drugs Market: Industry Trends and Global Forecasts, till 2035 - Distribution by Type of Molecule, Active Compound Used, Mechanism of Action, Agonist, Action Pathway, Route of Administration, Regions, Sales Forecast and Key Players |
||||||
減肥藥市場:概覽
預計到2035年,全球減肥藥市場規模將從目前的196億美元成長至1,049億美元,預測期內複合年增長率達18.3%。
市場區隔按以下參數細分市場規模與市場機會:
分子類型
- 生技藥品
- 低分子
使用活性化合物
- Tirzepatide
- Semaglutide
- Retatrutide
- Survodutide
- Cagrilintide and Semaglutide
- Orforglipron
- Liraglutide
- 其他的活性化合物
作用機制
- GLP-1促效劑/GIP促效劑
- GLP-1促效劑/GCGR促效劑
- GLP-1促效劑
- GLP-1促效劑/Amylin類比
- GLP-1/GCGR/GIP促效劑
- 其他的作用機制
促效劑類型
- 單一促效劑
- 雙重促效劑
- 三重促效劑
作用途徑
- 中樞性作用
- 末梢性作用
- 中樞性作用和末梢性作用
給藥途徑
- 口服
- 非口服
地區
- 北美
- 歐洲
- 亞洲
- 南美
- 中東·北非
醫藥品預測銷售額
- Contrave/Mysimba
- Feisumei
- Imcivree
- LOMAIRA
- QSYMIA
- Saxenda
- Wegovy/Ozempic
- Zepbound/Mounjaro
- BI 456906
- CagriSema
- HM11260C
- HRS-9531
- IBI362
- LM-008
- LY3437943
- LY3502970
- TG103
- Semaglutide 7.2 mg (Subcutaneous)
- Semaglutide (Oral)
- XW003
減肥藥市場成長與趨勢
全球肥胖症已成為一個迫切問題,刺激了減肥藥市場的發展。推動這一趨勢的因素包括肥胖症的流行、可支配收入的增加以及醫療服務可近性的改善。近年來,越來越多的減肥藥獲得批准,拓寬了患者的治療選擇。這是一個令人不安的統計數據:大約40%的美國成年人被歸類為肥胖,其體重指數 (BMI) 為30或更高。
減肥藥物透過調節食慾、脂肪吸收和代謝過程來達到減肥的目的。這些藥物包括各種旨在幫助控制肥胖及其相關症狀的治療方案。隨著全球肥胖率的上升以及人們對糖尿病、心血管疾病和某些癌症等相關健康風險的認識不斷提高,對有效減肥藥物的需求日益增長。值得注意的是,近年來許多新型減重藥物已獲得監管部門的批准,這擴大了患者的選擇,並為外科手術減重提供了替代方案。
減重藥物對於增強減重效果至關重要,尤其對於有嚴重肥胖相關健康問題的患者。此外,這些藥物還可以透過預防肥胖相關併發症來改善生活品質並降低醫療成本。藥物配方和給藥系統的創新,以及新型化合物的整合,正在加速開發更安全、更有效的減肥藥物。個人化醫療和藥物基因組學日益受到重視,進一步提升了根據患者個體需求量身定制治療的潛力。此外,遠距醫療服務和數位治療應用的興起,正在促進患者更好地參與並更好地遵守治療計劃。
公私部門正在積極投資減重領域的研發,促進創新並開發尖端療法。隨著肥胖作為一種需要長期管理的慢性疾病越來越受到關注,預計減肥藥物市場將在未來幾年經歷顯著增長,並為利益相關者提供重大機會。
減肥藥市場關鍵洞見
本報告深入探討了減肥藥物市場的現狀,並指出了該行業的潛在成長機會。主要發現包括:
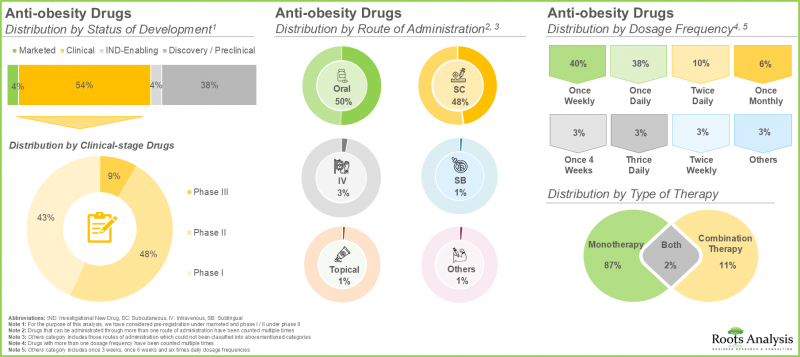
- 目前,市面上或正在研發的減肥藥物近225種,其中約50%為口服藥物。
- 目前,約55%的減重藥物處於臨床開發階段,其中大多數正在評估單藥治療的效果。
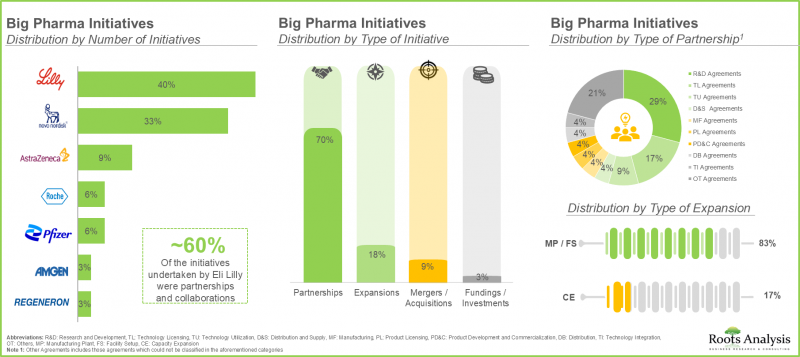
- 相當一部分(70%)的大型製藥公司已經建立了各種合作夥伴關係,以擴大其減肥藥物組合。這些合作關係中,大多數(約30%)是研發協議。
- 患者對肥胖相關健康風險以及肥胖流行病的認識不斷提高,推動了抗肥胖藥物市場的發展,預計該市場在短期內將實現穩定增長。
- 預計到2035年,抗肥胖藥物市場的複合年增長率 (CAGR) 將達到21.1%,其中北美市場預計將佔大部分市場佔有率 (60%)。
- 目前,中樞作用的抗肥胖藥物佔市場主導地位,但預計到2035年,腸外給藥將佔大部分市場佔有率 (85%)。
抗肥胖藥市場:主要市場區隔
依分子類型劃分,抗肥胖藥物市場分為多種分子類型,包括生物製劑和小分子藥物。小分子藥物因其療效確切、易於服用、生產成本低、易於獲取且安全性得到確認,佔了大部分市場佔有率(54%)。然而,隨著生物製劑成為一種有前景且更有效的治療肥胖相關生物途徑的替代方案,這種情況預計將有所改變。
從分子角度來看,減肥藥市場細分為各種活性化合物,包括索馬魯肽、雷他肽、薩爾沃度肽、卡格列肽、奧格列酮、利拉魯肽等。由於其在體重管理和糖尿病控制方面的強效作用,索馬魯肽目前佔減肥藥市場的主導地位。然而,隨著研究的進展,替澤帕肽因其作為GLP-1和GIP受體激動劑的雙重作用而備受關注,並在臨床試驗中展現出卓越的減肥效果。這種創新方法針對多種代謝途徑,為肥胖症提供了更全面的治療方案。由於其更高的療效和改善患者預後的潛力,預計替澤帕肽將在未來幾年最終佔並成為最大的市場佔有率。
依作用機制,抗肥胖/減肥藥物市場可細分為GLP-1激動劑/GIP激動劑、GLP-1激動劑/GCGR激動劑、GLP-1激動劑、GLP-1激動劑/胰淀素類似物、GLP-1/GCGR/GIP激動劑以及其他作用機轉。 GLP-1市場目前佔主導地位,因為它的作用機制已得到充分證實,能夠透過改善血糖控制來顯著減輕體重。其增加飽足感和抑制食慾的能力是肥胖治療的基石。然而,GLP-1和GIP雙激動劑由於能夠靶向多種代謝途徑,預計將以相對較高的複合年增長率增長。臨床研究表明,與單獨使用GLP-1激動劑相比,雙激動劑能夠帶來更顯著的減重效果和代謝改善。
市場細分為各種類型的激動劑,包括單激動劑、雙激動劑和三重激動劑。目前,單一激動劑因其易於使用、可提高患者依從性而佔減重藥物的最大市場佔有率(68%)。這些藥物擁有悠久的臨床成功歷史,醫療保健提供者可以基於大量數據放心地開立處方。隨後,雙激動劑有望顯著增長,因為它們可以同時針對多種生理機制來應對肥胖的複雜性。這使得能夠根據個別患者的需求和病情制定更個人化的治療方案。隨著醫療保健向個人化醫療轉變,雙激動劑預計將變得更加普及,從而促使對其開發的投資增加。
市場涵蓋各種作用途徑,包括中樞作用途徑、週邊作用途徑、中樞和周邊同時作用途徑。目前,中樞作用藥物佔減肥藥市場最大佔有率(86%),預計在整個預測期內都將佔主導地位。這是因為它們能夠透過與中樞神經系統直接相互作用來調節食慾和能量消耗。此外,中樞作用藥物已建立起安全性,進一步鞏固了其在臨床實踐中的地位。此外,由於中樞作用途徑提供了一種全面的體重管理方法,其市場對中樞作用途徑的依賴程度可能持續較高。儘管替代途徑的研究仍在進行中,但由於確鑿的臨床證據支持其有效性,中樞作用途徑在市場上的主導地位仍然強勁。因此,儘管新的療法可能不斷湧現,但預期中樞作用途徑的趨勢仍將持續,這反映了其在肥胖管理中的基礎作用。
根據給藥途徑,減肥藥市場分為口服和非口服途徑。研究表明,非口服藥物由於起效更快、生物利用度更高,佔了大部分市場佔有率(98%)。腸外給藥可確保藥物繞過胃腸道,減少吸收差異,增強療效。對於需要精準劑量和穩定血漿濃度以達到最佳減肥效果的藥物而言,腸外給藥具有優勢。此外,注射藥物也越來越受到青睞。這一趨勢日益傾向於腸外給藥。因此,雖然口服給藥方案仍然存在,但腸外給藥在未來很可能仍將是減重藥物的主導。
全球市場規模細分為多個地區,包括北美、歐洲、亞太地區和拉丁美洲。根據我們的預測,北美佔減肥藥物市場的主導佔有率(70%),預計在整個預測期內都將維持這一水準。這得歸功於該地區先進的醫療基礎設施、對藥物研究的大量投資以及完善的監管框架,這些框架有利於新療法的開發和批准。值得注意的是,預計到2035年,亞太地區的減重藥物市場將以相對較高的複合年增長率(40%)成長。
抗體受託製造市場參與企業案例
- Boehringer Ingelheim
- Eli Lilly
- Novo Nordisk
- Eli Lilly
- Pfizer
- Regeneron
- Kallyope
- CinFina Pharma
- Viking Therapeutics
- AstraZeneca
- Novo Nordisk
- Roche
- Adocia
- Boehringer Ingelheim
- Zealand Pharma
- Hanmi Pharm
- Jiangsu Hengrui Pharmaceuticals
- Gmax Biopharma
- PegBio
- QL Biopharm
- Sciwind Biosciences
抗肥胖藥物市場研究報告
- 市場規模和機會分析:本報告按主要細分市場對全球抗肥胖藥物市場進行了全面分析,包括[A]分子類型、[B]所用活性成分、[C]作用機制、[D]激動劑類型、[E]作用途徑、[F]給藥途徑和[G]地區。
- 市場格局:基於若干相關參數,對參與抗肥胖藥物市場的公司進行詳細評估,包括[A]市場發展狀況、[B]分子類型、[C]作用機制、[D]激動劑類型、[E]給藥途徑、[F]給藥頻率和[G]治療類型。
- 競賽分析:對減重藥物進行全面的競爭分析,檢視[A]公司實力、[B]產品線組合和其他因素。
- 公司簡介:減肥藥物市場主要服務提供者的詳細簡介,重點關注[A]公司概況、[B]財務資訊(如有)、[C]產品線組合以及[D]近期發展和未來前景。
- 大型製藥公司舉措:本節回顧大型製藥公司所進行的各種減肥舉措,並確定各種參數的趨勢,包括:[A]舉措數量、[B]舉措年份、[C]舉措類型、[D]合作類型和[D]擴張類型。
目錄
第1章 背景
第2章 調查手法
第3章 市場動態
- 章概要
- 預測調查手法
- 市場評估組成架構
- 預測工具和技巧
- 重要的考慮事項
- 主要市場區隔
- 堅牢的品管
- 限制事項
第4章 經濟及其他項目具體考量
- 章概要
- 市場動態
第5章 摘要整理
第6章 簡介
- 抗肥胖藥概要
- 長期肥胖相關的健康風險
- 目前經過認證的抗肥胖藥的種類
- 抗肥胖藥伴隨的課題
- 未來展望
第7章 市場形勢:抗肥胖藥
- 市場形勢:抗肥胖藥
- 開發商的形勢:抗肥胖藥
第8章 公司簡介:北美抗肥胖藥開發企業
- 章概要
- 詳細的企業簡介
- Eli Lilly
- Pfizer
- Regeneron
- 簡潔的企業簡介
- CinFina Pharma
- Kallyope
- Viking Therapeutics
第9章 公司簡介:歐洲抗肥胖藥開發企業
- 章概要
- 詳細的企業簡介
- AstraZeneca
- Novo Nordisk
- Roche
- 簡潔的企業簡介
- Adocia
- Boehringer Ingelheim
- Zealand Pharma
第10章 公司簡介:亞太地區及其他地區抗肥胖藥開發企業
- 章概要
- 詳細的企業簡介
- Hanmi Pharmaceuticals
- Jiangsu Hengrui Pharmaceuticals
- 簡潔的企業簡介
- Gmax Biopharma
- PegBio
- QL Biopharm
- Sciwind Biosciences
第11章 大型製藥公司的配合措施
- 調查手法
- 大型製藥公司:重點關注的措施肥胖
第12章 市場影響分析:促進因素,阻礙因素,機會,課題
第13章 全球抗肥胖藥市場
- 預測研究方法與關鍵假設
- 全球抗肥胖藥物市場:歷史趨勢(2019年至今)與預測估計(截至2035年)
- 主要細分市場
第14章 抗肥胖藥市場(各分子類型)
第15章 抗肥胖藥市場(各使用的活性化合物)
第16章 抗肥胖藥市場(各作用機制)
第17章 抗肥胖藥市場(各促效劑類型)
第18章 抗肥胖藥市場(各作用途徑)
第19章 抗肥胖藥市場(各給藥途徑)
第20章 抗肥胖藥市場(各地區)
第21章 抗肥胖藥市場,成藥及第三階段臨床試驗藥的銷售額預測
- 成藥:預測銷售額
- Contrave/Mysimba
- Feisumei
- Imcivree
- LOMAIRA
- QSYMIA
- Saxenda
- Wegovy/Ozempic
- Zepbound/Mounjaro
- 第三階段醫藥品:預測銷售額
- BI 456906
- CagriSema
- HM11260C
- HRS-9531
- IBI362
- LM-008
- LY3437943
- LY3502970
- TG103
- Semaglutide 7.2 mg (Subcutaneous)
- Semaglutide (Oral)
- XW003
第22章 抗肥胖藥市場(各主要企業)
第23章 附錄1:表格形式資料
第24章 附錄2:企業·團體一覽
Anti-Obesity Drugs Market: Overview
As per Roots Analysis, the global anti-obesity drugs market is estimated to grow from USD 19.6 billion in the current year and USD 104.9 billion by 2035, representing a CAGR of 18.3% during the forecast period.
The market sizing and opportunity analysis has been segmented across the following parameters:
Type of Molecule
- Biologics
- Small Molecules
Active Compound Used
- Tirzepatide
- Semaglutide
- Retatrutide
- Survodutide
- Cagrilintide and Semaglutide
- Orforglipron
- Liraglutide
- Other Active Compounds
Mechanism of Action
- GLP-1 Agonist / GIP Agonist
- GLP-1 Agonist / GCGR Agonist
- GLP-1 Agonist
- GLP-1 Agonist / Amylin Analogue
- GLP-1 / GCGR / GIP Agonist
- Other Mechanisms of Action
Type of Agonist
- Single-Agonist
- Dual-Agonist
- Tri-Agonist
Action Pathway
- Centrally Acting
- Peripherally Acting
- Centrally Acting and Peripherally Acting
Route of Administration
- Oral
- Parenteral
Geographical Regions
- North America
- Europe
- Asia
- Latin America
- Middle East and North Africa
Sales Forecast of Drugs
- Contrave / Mysimba
- Feisumei
- Imcivree
- LOMAIRA
- QSYMIA
- Saxenda
- Wegovy / Ozempic
- Zepbound / Mounjaro
- BI 456906
- CagriSema
- HM11260C
- HRS-9531
- IBI362
- LM-008
- LY3437943
- LY3502970
- TG103
- Semaglutide 7.2 mg (Subcutaneous)
- Semaglutide (Oral)
- XW003
Anti-Obesity drugs Market: Growth and Trends
The urgent need to address obesity epidemic globally has resulted in the boost of the anti-obesity drugs market. Factors such as increasing obesity prevalence, rising disposable incomes, and greater access to healthcare services are propelling this trend. The recent years have witnessed a rise in the approval of anti-obesity drugs, thereby expanding treatment options for patients. This is a result of the alarming statistics of approximately 40% of adults in the U.S. being classified as obese, with a body mass index (BMI) of 30 or higher.
The anti-obesity drugs target weight loss by regulating appetite, fat absorption, and metabolic processes. These drugs include various therapeutic options designed to assist individuals in managing obesity and related conditions. As global obesity rates increase and the awareness of associated health risks, including diabetes, cardiovascular diseases, and certain cancers rise, the need for effective anti-obesity medications has escalated. It is worth mentioning that, in the recent years, many new anti-obesity drugs have gained regulatory approval, expanding options for patients and offering alternatives to surgical procedures for weight loss.
Anti-obesity medications are vital in enhancing weight loss results, especially for patients with severe obesity-related health issues. Further, these drugs contribute to improved quality of life and can lower healthcare expenses by preventing complications related to obesity. Innovations in drug formulation and delivery systems, along with the integration of novel compounds, have resulted in the development of safer and more effective anti-obesity medications. The growing emphasis on personalized medicine and pharmacogenomics further enhances the potential for tailored treatments that address individual patient needs. Additionally, the rise in telehealth services and digital therapeutics applications is facilitating better patient engagement and adherence to treatment plans.
Public and private sectors are actively providing investments in order to conduct research and development in the anti-obesity space, along with fostering innovation and developing cutting-edge therapies. As the focus on obesity as a chronic disease that needs long-term management increases, the anti-obesity drugs market is poised for substantial growth, presenting significant opportunities for stakeholders in the coming years.
Anti-Obesity Drugs Market: Key Insights
The report delves into the current state of the anti-obesity drugs market and identifies potential growth opportunities within the industry. Some key findings from the report include:
- Currently, close to 225 drugs are marketed / being developed for the management of obesity; around 50% of these can be administered through the oral route.
- Around 55% of the anti-obesity drugs are presently in their clinical stage of development; of these, majority of these drugs are being evaluated as monotherapy.
- A sizeable proportion (70%) of big pharma players have entered into various partnerships in order to expand their anti-obesity drug portfolios; majority of these partnerships (~30%) were research and development agreements.
- The growing awareness among patients about the health risks associated with obesity coupled with its increasing prevalence, is driving the anti-obesity market and positioning it for steady growth in the foreseeable future.
- The anti-obesity drugs market is anticipated to grow at an annualized rate (CAGR) of 21.1%, till 2035; North America is expected to capture the majority share (~60%) of the market by 2035.
- Currently, the centrally acting anti-obesity drugs dominate the market; notably, parenteral route of administration is expected to capture the majority share (~85%) in the market by 2035.
Anti-Obesity Drugs Market: Key Segments
Small Molecules is the Fastest Growing Segment of the Anti-obesity Drugs Market
In terms of type of molecule, the anti-obesity drugs market is segmented into different type of molecules, such as biologics and small molecules. Majority (54%) of the market share is captured small molecules owing to their proven efficacy, ease of administration, lower production costs, accessibility and established safe drug profiles. However, the landscape is expected to change as biologics emerge as a promising and more effective alternative for the underlying biological pathways associated with obesity.
Semaglutide is Likely to Hold the Largest Share of the Anti-obesity Drugs Market During the Forecast Period
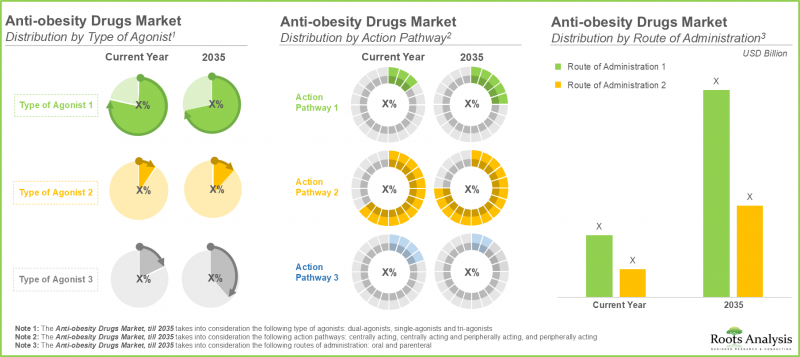
In terms of type of molecule, the anti-obesity drugs market is segmented into various active compounds used, such as semaglutide, retatrutide, survodutide, cagrilintide, orforglipron, liraglutide and other active compounds. Owing to its strong efficacy in weight management and diabetes control, majority of the anti-obesity drugs market is currently captured by semaglutide. However, as research progresses, tirzepatide is gaining attention for its dual action as both a GLP-1 and GIP receptor agonist, demonstrating superior weight loss results in clinical trials. This innovative approach targets various metabolic pathways, offering a more comprehensive treatment for obesity. With its potential for greater efficacy and improved patient outcomes, tirzepatide is expected to rise in prominence, ultimately securing the largest market share in the years to come.
Anti-Obesity Drugs Market for GLP-1 Agonist is Likely to grow at a Relatively Faster Pace During the Forecast Period
In terms of mechanism of action, the anti-obesity drugs / weight loss drugs market is segmented into GLP-1 agonist / GIP agonist, GLP-1 agonist / GCGR agonist, GLP-1 agonist, GLP-1 agonist / amylin analogue, GLP-1 / GCGR / GIP agonist and other mechanisms of action. The current market is dominated by GLP-1 market segment. This is attributed to their well-established mechanism of action, which improve glycemic control, thereby promoting significant weight loss. Their ability to enhance satiety and reduce appetite is the foundation in obesity treatment. However, dual GLP-1 and GIP agonists are anticipated to grow at a comparatively higher CAGR because of their ability to target multiple metabolic pathways. Clinical studies suggest that dual agonists can yield greater weight loss and improved metabolic profiles compared to GLP-1 agonists alone.
Anti-Obesity Drugs Market for Single Agonist is Likely to Grow at a Higher CAGR During the Forecast Period
The market is segmented into different types of agonists, including single-agonist, dual-agonist and tri-agonist. Owing to the ease of use in order to facilitate patient adherence, the single agonist segment currently captures the maximum anti-obesity drugs market share (68%). These medications have a long-standing history of clinical success, which enables healthcare providers to confidently prescribe them based on extensive data. Following it, the dual agonist segment will capture a prominent market share, driven by its capability to address the complexities of obesity by targeting multiple physiological mechanisms simultaneously. This allows for more tailored treatments that can adapt to individual patient needs and conditions. Dual agonists are set to become more popular as healthcare shifts toward personalized medicine, thus resulting in greater investments in their development.
Anti-Obesity Drugs Catering to Centrally Acting Pathways is Likely to Dominate the Anti-Obesity Drugs Market During the Forecast Period
The market caters to a variety of action pathways, including centrally acting, peripherally acting and centrally and peripherally acting pathways. Centrally acting segment currently captures the highest anti-obesity drugs market share (86%) and is expected to dominate the market during the forecast period. This is a result of its effectiveness in modulating appetite and energy expenditure through direct interactions with the central nervous system. Additionally, centrally acting agents have a well-established safety profile, which further solidifies their position in clinical practice. Further, the reliance on centrally acting pathways is likely to remain strong, as they provide a comprehensive approach to managing weight. Despite ongoing research into alternative pathways, robust clinical evidence supporting the efficacy of centrally acting agents ensures their continued dominance in the market. Consequently, while new treatments may emerge, the trend towards centrally acting pathways is expected to persist, reflecting their fundamental role in obesity management.
Currently, Parenteral Route Hold the Largest Share of the Anti-Obesity Drugs Market
In terms of route of administration, the anti-obesity drugs market is segmented across oral and parenteral routes. Our research suggests that parenteral route captures the majority share (98%) in the market owing to its rapid onset of action and higher bioavailability compared to oral formulations. Parenteral delivery ensures the medications to bypass the gastrointestinal tract, reducing variability in absorption and enhancing therapeutic effectiveness. It is advantageous for agents that require precise dosing and consistent plasma levels to achieve optimal weight loss outcomes. Moreover, the growing preference for injectable formulations reinforces the trend toward parenteral administration. Consequently, although oral options remain available, the dominance of parenteral administration in the anti-obesity landscape is likely to persist well into the future as well.
North America Accounts for the Largest Share of the Market
The global market value is segmented across various geographies, including North America, Europe, Asia-Pacific, and Latin America. According to our projections, North America region accounts for the major anti-obesity drugs market share (70%), which is likely to remain the same during the forecast period. This is complemented by the availability of advanced healthcare infrastructure, significant investment in pharmaceutical research, and robust regulatory frameworks in this region that facilitate the development and approval of new therapies. It is worth highlighting that the market for anti-obesity drugs in Asia-Pacific is expected to grow at a relatively higher CAGR (~40%), till 2035.
Example Players in the Antibody Contract Manufacturing Market
- Boehringer Ingelheim
- Eli Lilly
- Novo Nordisk
- Other Drug Developers
- Eli Lilly
- Pfizer
- Regeneron
- Kallyope
- CinFina Pharma
- Viking Therapeutics
- AstraZeneca
- Novo Nordisk
- Roche
- Adocia
- Boehringer Ingelheim
- Zealand Pharma
- Hanmi Pharm
- Jiangsu Hengrui Pharmaceuticals
- Gmax Biopharma
- PegBio
- QL Biopharm
- Sciwind Biosciences
Anti-Obesity Market: Research Coverage
- Market Sizing and Opportunity Analysis: The report features a thorough analysis of the global anti-obesity drugs market, in terms of the key market segments, including [A] type of molecule [B] active compound used [C] mechanism of action [D] type of agonist [E] action pathway [F] route of administration and [G] geographical regions.
- Market Landscape: An in-depth assessment of the companies involved in anti-obesity market, based on several relevant parameters, such as including [A] status of development, [B] type of molecule, [C] mechanism of action [D] type of agonist [E] route of administration [F] dosage frequency and [G] type of therapy.
- Company Competitiveness Analysis: A comprehensive competitive analysis of ant-obesity drugs, examining factors, such as [A] company strength and [B] pipeline portfolio.
- Company Profiles: Detailed profiles of key service providers engaged in the anti-obesity drugs market, focused on [A] overview of the company, [B] financial information (if available), [C] pipeline portfolio, and [D] recent developments and an informed future outlook.
- Big Pharma Initiatives A review of the various anti-obesity initiatives undertaken by big pharma players, highlighting trends across various parameters [A] number of initiatives, [B] year of initiative, [C] type of initiative, [D] type of partnership and [D] type of expansion.
Key Questions Answered in this Report
- How many companies are currently engaged in this market?
- Which are the leading companies in this market?
- What factors are likely to influence the evolution of this market?
- What is the current and future market size?
- What is the CAGR of this market?
- How is the current and future market opportunity likely to be distributed across key market segments?
Reasons to Buy this Report
- The report provides a comprehensive market analysis, offering detailed revenue projections of the overall market and its specific sub-segments. This information is valuable to both established market leaders and emerging entrants.
- Stakeholders can leverage the report to gain a deeper understanding of the competitive dynamics within the market. By analyzing the competitive landscape, businesses can make informed decisions to optimize their market positioning and develop effective go-to-market strategies.
- The report offers stakeholders a comprehensive overview of the market, including key drivers, barriers, opportunities, and challenges. This information empowers stakeholders to stay abreast of market trends and make data-driven decisions to capitalize on growth prospects.
Additional Benefits
- Complimentary Excel Data Packs for all Analytical Modules in the Report
- 15% Free Content Customization
- Detailed Report Walkthrough Session with Research Team
- Free Updated report if the report is 6-12 months old or older
TABLE OF CONTENTS
1. BACKGROUND
- 1.1. Context
- 1.2. Project Objectives
2. RESEARCH METHODOLOGY
- 2.1. Chapter Overview
- 2.2. Research Assumptions
- 2.3. Project Methodology
- 2.4. Forecast Methodology
- 2.5. Robust Quality Control
- 2.6. Key Factors
- 2.6.1. Demographics
- 2.6.2. Economic Factors
- 2.6.3. Competitive Landscape
- 2.6.4. Government Regulations and Healthcare Policies
- 2.6.5. R&D Investment
- 2.6.6. Technological Factors
- 2.6.7. Industry Consolidation
- 2.6.8. Supply Chain
- 2.6.9. Market Access
- 2.6.10. COVID Impact / Related Factors
- 2.6.11. Market Access
- 2.6.12. COVID Impact / Related Factors
- 2.6.13. Patient Advocacy and Influence
- 2.6.14. Healthcare Infrastructure
3. MARKET DYNAMICS
- 3.1. Chapter Overview
- 3.2. Forecast Methodology
- 3.2.1. Top-Down Approach
- 3.2.2. Botton-Up Approach
- 3.2.3. Hybrid Approach
- 3.3. Market Assessment Framework
- 3.3.1. Total Addressable Market (TAM)
- 3.3.2. Serviceable Addressable Market (SAM)
- 3.3.3. Serviceable Obtainable Market (SOM)
- 3.3.4. Currently Acquired Market (CAM)
- 3.4. Forecasting Tools and Techniques
- 3.4.1. Qualitative Forecasting
- 3.4.2. Correlation
- 3.4.3. Regression
- 3.4.4. Extrapolation
- 3.4.5. Convergence
- 3.4.6. Sensitivity Analysis
- 3.4.7. Scenario Planning
- 3.4.8. Data Visualization
- 3.4.9. Time Series Analysis
- 3.4.10. Forecast Error Analysis
- 3.5. Key Considerations
- 3.5.1. Demographics
- 3.5.2. Government Regulations
- 3.5.3. Reimbursement Scenarios
- 3.5.4. Market Access
- 3.5.5. Supply Chain
- 3.5.6. Industry Consolidation
- 3.5.7. Pandemic / Unforeseen Disruptions Impact
- 3.6. Key Market Segments
- 3.7. Robust Quality Control
- 3.8. Limitations
4. ECONOMIC AND OTHER PROJECT SPECIFIC CONSIDERATIONS
- 4.1. Chapter Overview
- 4.2. Market Dynamics
- 4.2.1. Time Period
- 4.2.1.1. Historical Trends
- 4.2.1.2. Current and Forecasted Estimates
- 4.2.2. Currency Coverage
- 4.2.2.1. Overview of Major Currencies Affecting the Market
- 4.2.2.2. Impact of Currency Fluctuations on the Industry
- 4.2.3. Foreign Exchange Impact
- 4.2.3.1. Evaluation of Foreign Exchange Rates and Their Impact on Market
- 4.2.3.2. Strategies for Mitigating Foreign Exchange Risk
- 4.2.4. Recession
- 4.2.4.1. Historical Analysis of Past Recessions and Lessons Learnt
- 4.2.4.2. Assessment of Current Economic Conditions and Potential Impact on the Market
- 4.2.5. Inflation
- 4.2.5.1. Measurement and Analysis of Inflationary Pressures in the Economy
- 4.2.5.2. Potential Impact of Inflation on the Market Evolution
- 4.2.1. Time Period
5. EXECUTIVE SUMMARY
6. INTRODUCTION
- 6.1. Overview of Anti-Obesity Drugs
- 6.2. Health Risks Linked with Long-term Obesity
- 6.3. Currently Approved Anti-Obesity Drug Classes
- 6.4. Challenges Associated with Anti-Obesity Drugs
- 6.5. Future Perspectives
7. MARKET LANDSCAPE: ANTI-OBESITY DRUGS
- 7.1. Market Landscape: Anti-Obesity Drugs
- 7.1.1. Analysis by Status of Development
- 7.1.2. Analysis by Type of Molecule
- 7.1.3. Analysis by Mechanism of Action
- 7.1.4. Analysis by Type of Agonist
- 7.1.5. Analysis by Route of Administration
- 7.1.6. Analysis by Dosage Frequency
- 7.1.7. Analysis by Type of Therapy
- 7.2. Developer Landscape: Anti-Obesity Drugs
- 7.2.1. Analysis by Year of Establishment
- 7.2.2. Analysis by Company Size
- 7.2.3. Analysis by Location of Headquarters
- 7.2.4. Analysis by Headquarters (Country) and Status of Development
- 7.2.5. Most Active Developers: Analysis by Number of Drug Candidates
8. COMPANY PROFILES: ANTI-OBESITY DRUG DEVELOPERS BASED IN NORTH AMERICA
- 8.1. Chapter Overview
- 8.2. Detailed Company Profiles
- 8.2.1. Eli Lilly
- 8.2.1.1. Company Details
- 8.2.1.2. Pipeline Portfolio
- 8.2.1.3. Financial Details
- 8.2.1.4. Recent Developments and Future Outlook
- 8.2.2. Pfizer
- 8.2.3. Regeneron
- 8.2.1. Eli Lilly
- 8.3. Brief Company Profiles
- 8.3.1. CinFina Pharma
- 8.3.1.1. Company Details
- 8.3.1.2. Pipeline Portfolio
- 8.3.2. Kallyope
- 8.3.3. Viking Therapeutics
- 8.3.1. CinFina Pharma
9. COMPANY PROFILES: ANTI-OBESITY DRUG DEVELOPERS BASED IN EUROPE
- 9.1. Chapter Overview
- 9.2. Detailed Company Profiles
- 9.2.1. AstraZeneca
- 9.2.1.1. Company Details
- 9.2.1.2. Pipeline Portfolio
- 9.2.1.3. Financial Details
- 9.2.1.4. Recent Developments and Future Outlook
- 9.2.2. Novo Nordisk
- 9.2.3. Roche
- 9.2.1. AstraZeneca
- 9.3. Brief Company Profiles
- 9.3.1. Adocia
- 9.3.1.1. Company Details
- 9.3.1.2. Pipeline Portfolio
- 9.3.2. Boehringer Ingelheim
- 9.3.3. Zealand Pharma
- 9.3.1. Adocia
10. COMPANY PROFILES: ANTI-OBESITY DRUG DEVELOPERS BASED IN ASIA-PACIFIC AND REST OF THE WORLD
- 10.1. Chapter Overview
- 10.2. Detailed Company Profiles
- 10.2.1. Hanmi Pharmaceuticals
- 10.2.1.1. Company Details
- 10.2.1.2. Pipeline Portfolio
- 10.2.1.3. Financial Details
- 10.2.1.4. Recent Developments and Future Outlook
- 10.2.2. Jiangsu Hengrui Pharmaceuticals
- 10.2.1. Hanmi Pharmaceuticals
- 10.3. Brief Company Profiles
- 10.3.1. Gmax Biopharma
- 10.3.1.1. Company Details
- 10.3.1.2. Pipeline Portfolio
- 10.3.2. PegBio
- 10.3.3. QL Biopharm
- 10.3.4. Sciwind Biosciences
- 10.3.1. Gmax Biopharma
11. BIG PHARMA INITIATIVES
- 11.1. Methodology
- 11.2. Big Pharma Players: Anti-obesity focused Initiatives
- 11.2.1. Analysis of Big Pharma Players by Number of Initiatives
- 11.2.2. Analysis by Year of Initiative
- 11.2.3. Analysis by Big Pharma Player by Year of Initiative and Number of Initiatives
- 11.2.4. Analysis by Type of Initiative
- 11.2.5. Analysis by Year and Type of Initiative
- 11.2.6. Analysis by Big Pharma Player and Type of Initiative
- 11.2.7. Analysis by Big Pharma Player and Number of Partnerships
- 11.2.8. Analysis by Type of Partnership
- 11.2.9. Analysis by Type of Expansion
- 11.2.10. Analysis by Big Pharma Player by Region and Number of Initiatives
- 11.2.11. Benchmarking of Big Pharma Players
12. MARKET IMPACT ANALYSIS: DRIVERS, RESTRAINTS, OPPORTUNITIES AND CHALLENGES
- 12.1. Chapter Overview
- 12.2. Market Drivers
- 12.3. Market Restraints
- 12.4. Market Opportunities
- 12.5. Market Challenges
13. GLOBAL ANTI-OBESITY DRUGS MARKET
- 13.1. Forecast Methodology and Key Assumptions
- 13.2. Global Anti-Obesity Drugs Market, Historical Trends (Since 2019) and Forecasted Estimates (Till 2035) (USD Billion)
- 13.2.1. Scenario Analysis
- 13.2.1.1. Conservative Scenario
- 13.2.1.2. Optimistic Scenario
- 13.2.1. Scenario Analysis
- 13.3. Key Market Segmentations
14. ANTI-OBESITY DRUGS MARKET, BY TYPE OF MOLECULE
- 14.1. Anti-Obesity Drugs Market: Distribution by Type of Molecule
- 14.1.1. Anti-Obesity Drugs Market for Biologics, Historical Trends (since 2019) and Forecasted Estimates (till 2035)
- 14.1.2. Anti-Obesity Drugs Market for Small Molecules, Historical Trends (since 2019) and Forecasted Estimates (till 2035)
15. ANTI-OBESITY DRUGS MARKET, BY ACTIVE COMPOUND USED
- 15.1. Anti-Obesity Drugs Market: Distribution by Active Compound Used
- 15.1.1. Anti-Obesity Drugs Market for Tirzepatide, Historical Trends (since 2019) and Forecasted Estimates (till 2035)
- 15.1.2. Anti-Obesity Drugs Market for Semaglutide, Historical Trends (since 2019) and Forecasted Estimates (till 2035)
- 15.1.3. Anti-Obesity Drugs Market for Retatrutide, Historical Trends (since 2019) and Forecasted Estimates (till 2035)
- 15.1.4. Anti-Obesity Drugs Market for Survodutide, Historical Trends (since 2019) and Forecasted Estimates (till 2035)
- 15.1.5. Anti-Obesity Drugs Market for Cagrilintide and Semglutide, Historical Trends (since 2019) and Forecasted Estimates (till 2035)
- 15.1.6. Anti-Obesity Drugs Market for Orforglipron, Historical Trends (since 2019) and Forecasted Estimates (till 2035)
- 15.1.7. Anti-Obesity Drugs Market for Liraglutide, Historical Trends (since 2019) and Forecasted Estimates (till 2035)
- 15.1.8. Anti-Obesity Drugs Market for other active compounds used, Historical Trends (since 2019) and Forecasted Estimates (till 2035)
16. ANTI-OBESITY DRUGS MARKET, BY MECHANISM OF ACTION
- 16.1. Anti-Obesity Drugs Market: Distribution by Mechanism of Action
- 16.1.1. Anti-Obesity Drugs Market for GLP-1 Agonist / GIP Agonist, Historical Trends (since 2019) and Forecasted Estimates (till 2035)
- 16.1.2. Anti-Obesity Drugs Market for GLP-1 Agonist, Historical Trends (since 2019) and Forecasted Estimates (till 2035)
- 16.1.3. Anti-Obesity Drugs Market for GLP-1 Agonist / GCGR Agonist, Historical Trends (since 2019) and Forecasted Estimates (till 2035)
- 16.1.4. Anti-Obesity Drugs Market for GLP-1 / GCGR / GIP Agonist, Historical Trends (since 2019) and Forecasted Estimates (till 2035)
- 16.1.5. Anti-Obesity Drugs Market for GLP-1 Agonist / Amylin Analogue, Historical Trends (since 2019) and Forecasted Estimates (till 2035)
- 16.1.6. Anti-Obesity Drugs Market for Other Mechanisms of Action, Historical Trends (since 2019) and Forecasted Estimates (till 2035)
17. ANTI-OBESITY DRUGS MARKET, BY TYPE OF AGONIST
- 17.1. Anti-Obesity Drugs Market: Distribution by Type of Agonist
- 17.1.1. Anti-Obesity Drugs Market for Single-Agonist, Historical Trends (since 2019) and Forecasted Estimates (till 2035)
- 17.1.2. Anti-Obesity Drugs Market for Dual-Agonist, Historical Trends (since 2019) and Forecasted Estimates (till 2035)
- 17.1.3. Anti-Obesity Drugs Market for Tri-Agonist, Historical Trends (since 2019) and Forecasted Estimates (till 2035)
18. ANTI-OBESITY DRUGS MARKET, BY ACTION PATHWAY
- 18.1. Anti-Obesity Drugs Market: Distribution by Action Pathway
- 18.1.1. Anti-Obesity Drugs Market for Centrally Acting Drugs, Historical Trends (since 2019) and Forecasted Estimates (till 2035)
- 18.1.2. Anti-Obesity Drugs Market for Peripherally Acting Drugs, Historical Trends (since 2019) and Forecasted Estimates (till 2035)
- 18.1.3. Anti-Obesity Drugs Market for Centrally Acting and Peripherally Acting Drugs, Historical Trends (since 2019) and Forecasted Estimates (till 2035)
19. ANTI-OBESITY DRUGS MARKET, BY ROUTE OF ADMINISTRATION
- 19.1. Anti-Obesity Drugs Market: Distribution by Route of Administration
- 19.1.1. Anti-Obesity Drugs Market for Oral Administration, Historical Trends (since 2019) and Forecasted Estimates (till 2035)
- 19.1.2. Anti-Obesity Drugs Market for Parenteral Administration, Historical Trends (since 2019) and Forecasted Estimates (till 2035)
20. ANTI-OBESITY DRUGS MARKET, BY GEOGRAPHICAL REGIONS
- 20.1. Anti-Obesity Drugs Market: Distribution by Geographical Regions
- 20.1.1. Anti-Obesity Drugs Market in North America, Historical Trends (since 2019) and Forecasted Estimates (till 2035)
- 20.1.2. Anti-Obesity Drugs Market in Europe, Historical Trends (since 2019) and Forecasted Estimates (till 2035)
- 20.1.3. Anti-Obesity Drugs Market in Asia-Pacific, Historical Trends (since 2019) and Forecasted Estimates (till 2035)
- 20.1.4. Anti-Obesity Drugs Market in Latin America, Historical Trends (since 2019) and Forecasted Estimates (till 2035)
21. ANTI-OBESITY DRUGS MARKET, SALES FORECAST OF MARKETED AND PHASE III DRUGS
- 21.1. Marketed Drugs: Sales Forecast
- 21.1.1. Contrave / Mysimba (Naltrexone, Bupropion)
- 21.1.2. Feisumei (Beinaglutide)
- 21.1.3. Imcivree (Setmelanotide)
- 21.1.4. LOMAIRA (Phentermine Hydrochloride)
- 21.1.5. QSYMIA (Phentermine and Topiramate)
- 21.1.6. Saxenda (Liraglutide)
- 21.1.7. Wegovy / Ozempic (Semaglutide)
- 21.1.8. Zepbound / Mounjaro (Tirzepatide)
- 21.2. Phase III Drugs: Sales Forecast
- 21.2.1. BI 456906 (Survodutide)
- 21.2.2. CagriSema (Cagrilintide and Semaglutide)
- 21.2.3. HM11260C (Efpeglenatide)
- 21.2.4. HRS-9531
- 21.2.5. IBI362 (Mazdutide)
- 21.2.6. LM-008
- 21.2.7. LY3437943 (Retatrutide)
- 21.2.8. LY3502970 (Orforglipron)
- 21.2.9. TG103
- 21.2.10. Semaglutide 7.2 mg (Subcutaneous)
- 21.2.11. Semaglutide (Oral)
- 21.2.12. XW003
22. ANTI-OBESITY DRUGS MARKET, BY KEY PLAYERS
- 22.1. Anti-Obesity Drugs Market: Distribution of Key Players
23. APPENDIX 1: TABULATED DATA
24. APPENDIX 2: LIST OF COMPANIES AND ORGANIZATIONS
List of Tables
- Table 7.1 List of Anti-Obesity Drugs
- Table 7.2 List of Anti-Obesity Drug Developers
- Table 8.1 Eli Lily: Pipeline Portfolio
- Table 8.2 Eli Lily: Recent Developments and Future Outlook
- Table 8.3 Pfizer: Pipeline Portfolio
- Table 8.4 Pfizer: Recent Developments and Future Outlook
- Table 8.5 Regeneron: Pipeline Portfolio
- Table 8.6 Regeneron: Recent Developments and Future Outlook
- Table 8.7 CinFina Pharma: Pipeline Portfolio
- Table 8.8 Kallyope: Pipeline Portfolio
- Table 8.9 Viking Therapeutics: Pipeline Portfolio
- Table 9.1 AstraZeneca: Pipeline Portfolio
- Table 9.2 AstraZeneca: Recent Developments and Future Outlook
- Table 9.3 Novo Nordisk: Pipeline Portfolio
- Table 9.4 Novo Nordisk: Recent Developments and Future Outlook
- Table 9.5 Roche: Pipeline Portfolio
- Table 9.6 Roche: Recent Developments and Future Outlook
- Table 9.7 Adocia: Pipeline Portfolio
- Table 9.8 Boehringer Ingelheim: Pipeline Portfolio
- Table 9.9 Zealand Pharma: Pipeline Portfolio
- Table 10.1 Hanmi Pharmaceuticals: Pipeline Portfolio
- Table 10.2 Hanmi Pharmaceuticals: Recent Developments and Future Outlook
- Table 10.3 Jiangsu Hengrui Pharmaceuticals: Pipeline Portfolio
- Table 10.4 Jiangsu Hengrui Pharmaceuticals: Recent Developments and Future Outlook
- Table 10.5 Gmax Biopharma: Pipeline Portfolio
- Table 10.6 PegBio: Pipeline Portfolio
- Table 10.7 QL Biopharm: Pipeline Portfolio
- Table 10.8 Sciwind Biosciences: Pipeline Portfolio
- Table 11.1 Big Pharma Players: List of Anti-obesity Focused Initiatives
- Table 13.1 Anti-obesity Market: List of Forecasted Drugs
- Table 23.1 Anti-Obesity Drugs: Distribution by Status of Development
- Table 23.2 Anti-Obesity Drugs: Distribution by Type of Molecule
- Table 23.3 Anti-Obesity Drugs: Distribution by Mechanism of Action
- Table 23.4 Anti-Obesity Drugs: Distribution by Type of Agonist
- Table 23.5 Anti-Obesity Drugs: Distribution by Route of Administration
- Table 23.6 Anti-Obesity Drugs: Distribution by Dosage Frequency
- Table 23.7 Anti-Obesity Drugs: Distribution by Type of Therapy
- Table 23.8 Anti-Obesity Drug Developers: Distribution by Year of Establishment
- Table 23.9 Anti-Obesity Drug Developers: Distribution by Company Size
- Table 23.10 Anti-Obesity Drug Developers: Distribution by Location of Headquarters
- Table 23.11 Anti-Obesity Drug Developers: Distribution by Headquarters (Country) and Status of Development
- Table 23.12 Most Active Developers: Distribution by Number of Drugs
- Table 23.13 Eli Lilly: Annual Revenues (USD Billion)
- Table 23.14 Pfizer: Annual Revenues (USD Billion)
- Table 23.15 Regeneron: Annual Revenues (USD Billion)
- Table 23.16 AstraZeneca: Annual Revenues (USD Billion)
- Table 23.17 Novo Nordisk: Annual Revenues (DKK Billion)
- Table 23.18 Roche: Annual Revenues (CHF Billion)
- Table 23.19 Hanmi Pharmaceuticals: Annual Revenues (KRW Billion)
- Table 23.20 Jiangsu Hengrui Pharmaceuticals: Annual Revenues (CNY Billion)
- Table 23.21 Big Pharma Initiatives: Distribution of Big Pharma Players by Number of Initiatives
- Table 23.22 Big Pharma Initiatives: Distribution by Year of Initiative
- Table 23.23 Big Pharma Initiatives: Distribution by Big Pharma Players by Year and Number of Initiatives
- Table 23.24 Big Pharma Initiatives: Distribution by Type of Initiative
- Table 23.25 Big Pharma Initiatives: Distribution by Year and Type of Initiative
- Table 23.26 Big Pharma Initiatives: Distribution by Big Pharma Players and Type of Initiative
- Table 23.27 Big Pharma Initiatives: Distribution by Type of Partnership
- Table 23.28 Big Pharma Initiatives: Distribution by Type of Expansion
- Table 23.29 Big Pharma Initiatives: Distribution by Big Pharma Players by Region and Number of Initiatives
- Table 23.30 Global Anti-Obesity Drug Market, Historical Trends (Since 2019) and Forecasted Estimates (Till 2035)
- Table 23.31 Global Anti-obesity Drugs Market, till 2035 (USD Billion): Conservative Scenario
- Table 23.32 Global Anti-obesity Drugs Market, till 2035 (USD Billion): Optimistic Scenario
- Table 23.33 Anti-obesity Drugs Market: Distribution by Type of Molecule
- Table 23.34 Anti-obesity Market for Biologics, till 2035 (USD Billion)
- Table 23.35 Anti-obesity Market for Small Molecules, till 2035 (USD Billion)
- Table 23.36 Anti-obesity Drugs Market: Distribution by Active Compound Used
- Table 23.37 Anti-obesity Market for Tirzepatide, till 2035 (USD Billion)
- Table 23.38 Anti-obesity Market for Semaglutide, till 2035 (USD Billion)
- Table 23.39 Anti-obesity Market for Retatrutide, till 2035 (USD Billion)
- Table 23.40 Anti-obesity Market for Survodutide, till 2035 (USD Billion)
- Table 23.41 Anti-obesity Market for Cagrilintide / Semaglutide, till 2035 (USD Billion)
- Table 23.42 Anti-obesity Market for Orforglipron, till 2035 (USD Billion)
- Table 23.43 Anti-obesity Market for Liraglutide, till 2035 (USD Billion)
- Table 23.44 Anti-obesity Market for Other Compounds, till 2035 (USD Billion)
- Table 23.45 Anti-obesity Drugs Market: Distribution by Mechanism of Action
- Table 23.46 Anti-obesity Market for GLP-1 Agonist / GIP Agonist, till 2035 (USD Billion)
- Table 23.47 Anti-obesity Market for GLP-1 Agonist, till 2035 (USD Billion)
- Table 23.48 Anti-obesity Market for GLP-1 / GCGR / GIP Agonist, till 2035 (USD Billion)
- Table 23.49 Anti-obesity Market for GLP-1 Agonist / GCGR Agonist, till 2035 (USD Billion)
- Table 23.50 Anti-obesity Market for GLP-1 Agonist / Amylin Analogue, till 2035 (USD Billion)
- Table 23.51 Anti-obesity Market for Other Mechanisms of Action, till 2035 (USD Billion)
- Table 23.52 Anti-obesity Market: Distribution by Type of Agonist
- Table 23.53 Anti-obesity Market for Single-Agonist, till 2035 (USD Billion)
- Table 23.54 Anti-obesity Market for Dual-Agonist, till 2035 (USD Billion)
- Table 23.55 Anti-obesity Market for Tri-Agonist, till 2035 (USD Billion)
- Table 23.56 Anti-obesity Drugs Market: Distribution by Action Pathway
- Table 23.57 Anti-obesity Market for Centrally Acting Drugs, till 2035 (USD Billion)
- Table 23.58 Anti-obesity Market for Peripherally Acting Drugs, till 2035 (USD Billion)
- Table 23.59 Anti-obesity Market for Centrally and Peripherally Acting, till 2035 (USD Billion)
- Table 23.60 Anti-obesity Drugs Market: Distribution by Route of Administration
- Table 23.61 Anti-obesity Market for Parenteral Administration, till 2035 (USD Billion)
- Table 23.62 Anti-obesity Market for Oral Administration, till 2035 (USD Billion)
- Table 23.63 Anti-obesity Drugs Market: Distribution by Geography
- Table 23.64 Anti-obesity Market in North America, till 2035 (USD Billion)
- Table 23.65 Anti-obesity Market in North America (country-wise), till 2035 (USD Billion)
- Table 23.66 Anti-obesity Market in Europe, till 2035 (USD Billion)
- Table 23.67 Anti-obesity Market in Europe (country-wise), till 2035 (USD Billion)
- Table 23.68 Anti-obesity Market in Asia-Pacific, till 2035 (USD Billion)
- Table 23.69 Anti-obesity Market in Asia-Pacific (country-wise), till 2035 (USD Billion)
- Table 23.70 Anti-obesity Market in Latin America, till 2035 (USD Billion)
- Table 23.71 Anti-obesity Market in Latin America (country-wise), till 2035 (USD Billion)
- Table 23.72 Contrave / Mysimba (Naltrexone, Bupropion) Sales Forecast, till 2035 (USD Billion)
- Table 23.73 Feisumei (Beinaglutide) Sales Forecast, till 2035 (USD Billion)
- Table 23.74 Imcivree (Setmelanotide) Sales Forecast, till 2035 (USD Billion)
- Table 23.75 LOMAIRA (Phentermine Hydrochloride) Sales Forecast, till 2035 (USD Billion)
- Table 23.76 QSYMIA (Phentermine and Topiramate) Sales Forecast, till 2035 (USD Billion)
- Table 23.77 Saxenda (Liraglutide) Sales Forecast, till 2035 (USD Billion)
- Table 23.78 Wegovy / Ozempic (Semaglutide) Sales Forecast, till 2035 (USD Billion)
- Table 23.79 Zepbound / Mounjaro (Tirzepatide) Sales Forecast, till 2035 (USD Billion)
- Table 23.80 BI 456906 (Survodutide) Sales Forecast, till 2035 (USD Billion)
- Table 23.81 CagriSema (Cagrilintide and Semaglutide) Sales Forecast, till 2035 (USD Billion)
- Table 23.82 HM11260C (Efpeglenatide) Sales Forecast, till 2035 (USD Billion)
- Table 23.83 HRS-9531 Sales Forecast, till 2035 (USD Billion)
- Table 23.84 IBI362 (Mazdutide) Sales Forecast, till 2035 (USD Billion)
- Table 23.85 LM-008 Sales Forecast, till 2035 (USD Billion)
- Table 23.86 LY3437943 (Retatrutide) Sales Forecast, till 2035 (USD Billion)
- Table 23.87 LY3502970 (Orforglipron) Sales Forecast, till 2035 (USD Billion)
- Table 23.88 TG103 Sales Forecast, till 2035 (USD Billion)
- Table 23.89 Semaglutide 7.2 mg (Subcutaneous) Sales Forecast, till 2035 (USD Billion)
- Table 23.90 Semaglutide (Oral) Sales Forecast, till 2035 (USD Billion)
- Table 23.91 XW003 Sales Forecast, till 2035 (USD Billion)
- Table 23.92 Anti-obesity Drugs Market: Distribution by Key Players, 2020 (USD Billion)
- Table 23.93 Anti-obesity Drugs Market: Distribution by Key Players, Current Year (USD Billion)
- Table 23.94 Anti-obesity Drugs Market: Distribution by Key Players, 2035 (USD Billion)
List of Figures
- Figure 2.1 Research Methodology: Project Methodology
- Figure 2.2 Research Methodology: Forecast Methodology
- Figure 3.1 Lessons Learnt from Past Recessions
- Figure 6.1 Health Risks Linked with Long-term Obesity
- Figure 6.2 Currently Approved Anti-Obesity Drug Classes
- Figure 7.1 Anti-Obesity Drugs: Distribution by Status of Development
- Figure 7.2 Anti-Obesity Drugs: Distribution by Type of Molecule
- Figure 7.3 Anti-Obesity Drugs: Distribution by Mechanism of Action
- Figure 7.4 Anti-Obesity Drugs: Distribution by Type of Agonist
- Figure 7.5 Anti-Obesity Drugs: Distribution by Route of Administration
- Figure 7.6 Anti-Obesity Drugs: Distribution by Dosage Frequency
- Figure 7.7 Anti-Obesity Drugs: Distribution by Type of Therapy
- Figure 7.8 Anti-Obesity Drug Developers: Distribution by Year of Establishment
- Figure 7.9 Anti-Obesity Drug Developers: Distribution by Company Size
- Figure 7.10 Anti-Obesity Drug Developers: Distribution by Location of Headquarters
- Figure 7.11 Anti-Obesity Drug Developers: Distribution by Headquarters (Country) and Status of Development
- Figure 7.12 Most Active Developers: Distribution by Number of Drug Candidates
- Figure 8.1 Eli Lilly: Annual Revenues (USD Billion)
- Figure 8.2 Pfizer: Annual Revenues (USD Billion)
- Figure 8.3 Regeneron: Annual Revenues (USD Billion)
- Figure 9.1 AstraZeneca: Annual Revenues (USD Billion)
- Figure 9.2 Novo Nordisk: Annual Revenues (DKK Billion)
- Figure 9.3 Roche: Annual Revenues (CHF Billion)
- Figure 10.1 Hanmi Pharmaceuticals: Annual Revenues (KRW Billion)
- Figure 10.2 Jiangsu Hengrui Pharmaceuticals: Annual Revenues (CNY Billion)
- Figure 11.1 Big Pharma Initiatives: Distribution of Big Pharma Players by Number
of Initiatives
- Figure 11.2 Big Pharma Initiatives: Distribution by Year of Initiative
Figure 11.3Big Pharma Initiatives: Distribution by Big Pharma Players by Year and Number of Initiatives
- Figure 11.4 Big Pharma Initiatives: Distribution by Type of Initiative
- Figure 11.5 Big Pharma Initiatives: Distribution by Year and Type of Initiative
- Figure 11.6 Big Pharma Initiatives: Distribution by Big Pharma Players and Type of Initiative
- Figure 11.7 Big Pharma Initiatives: Distribution by Type of Partnership
- Figure 11.8 Big Pharma Initiatives: Distribution by Type of Expansion
- Figure 11.9 Big Pharma Initiatives: Distribution of Big Pharma Players by Region and Number of Initiatives
- Figure 11.10 Benchmarking of Big Pharma Players
- Figure 12.1 Anti-Obesity Drugs: Market Drivers
- Figure 12.2 Anti-Obesity Drugs: Market Restraints
- Figure 12.3 Anti-Obesity Drugs: Market Opportunities
- Figure 12.4 Anti-Obesity Drugs: Market Challenges
- Figure 13.1 Global Anti-Obesity Drug Market, Historical Trends (Since 2019) and Forecasted Estimates (till 2035)
- Figure 13.2 Global Anti-obesity Drugs Market, till 2035 (USD Billion) (USD Billion): Conservative Scenario
- Figure 13.3 Global Anti-obesity Drugs Market, till 2035 (USD Billion) (USD Billion): Optimistic Scenario
- Figure 14.1 Anti-obesity Drugs Market: Distribution by Type of Molecule
- Figure 14.2 Anti-obesity Market for Biologics, till 2035 (USD Billion)
- Figure 14.3 Anti-obesity Market for Small Molecules, till 2035 (USD Billion)
- Figure 15.1 Anti-obesity Drugs Market: Distribution by Active Compound Used
- Figure 15.2 Anti-obesity Market for Tirzepatide, till 2035 (USD Billion)
- Figure 15.3 Anti-obesity Market for Semaglutide, till 2035 (USD Billion)
- Figure 15.4 Anti-obesity Market for Retatrutide, till 2035 (USD Billion)
- Figure 15.5 Anti-obesity Market for Survodutide, till 2035 (USD Billion)
- Figure 15.6 Anti-obesity Market for Cagrilintide / Semaglutide, till 2035 (USD Billion)
- Figure 15.7 Anti-obesity Market for Orforglipron, till 2035 (USD Billion)
- Figure 15.8 Anti-obesity Market for Liraglutide, till 2035 (USD Billion)
- Figure 15.9 Anti-obesity Market for Other Compounds, till 2035 (USD Billion)
- Figure 16.1 Anti-obesity Drugs Market: Distribution by Mechanism of Action
- Figure 16.2 Anti-obesity Market for GLP-1 Agonist / GIP Agonist, till 2035 (USD Billion)
- Figure 16.3 Anti-obesity Market for GLP-1 Agonist, till 2035 (USD Billion)
- Figure 16.4 Anti-obesity Market for GLP-1 / GCGR / GIP Agonist, till 2035 (USD Billion)
- Figure 16.5 Anti-obesity Market for GLP-1 Agonist / GCGR Agonist, till 2035 (USD Billion)
- Figure 16.6 Anti-obesity Market for GLP-1 Agonist / Amylin Analogue, till 2035 (USD Billion)
- Figure 16.7 Anti-obesity Market for Other Mechanisms of Action, till 2035 (USD Billion)
- Figure 17.1 Anti-obesity Market: Distribution by Type of Agonist
- Figure 17.2 Anti-obesity Market for Single-Agonist, till 2035 (USD Billion)
- Figure 17.3 Anti-obesity Market for Dual-Agonist, till 2035 (USD Billion)
- Figure 17.4 Anti-obesity Market for Tri-Agonist, till 2035 (USD Billion)
- Figure 18.1 Anti-obesity Drugs Market: Distribution by Action Pathway
- Figure 18.2 Anti-obesity Market for Centrally Acting Drugs, till 2035 (USD Billion)
- Figure 18.3 Anti-obesity Market for Peripherally Acting Drugs, till 2035 (USD Billion)
- Figure 18.4 Anti-obesity Market for Centrally and Peripherally Acting Drugs, till 2035 (USD Billion)
- Figure 19.1 Anti-obesity Drugs Market: Distribution by Route of Administration
- Figure 19.2 Anti-obesity Market for Parenteral Administration, till 2035 (USD Billion)
- Figure 19.3 Anti-obesity Market for Oral Administration, till 2035 (USD Billion)
- Figure 20.1 Anti-obesity Drugs Market: Distribution by Geographical Regions
- Figure 20.2 Anti-obesity Market in North America, till 2035 (USD Billion)
- Figure 20.3 Anti-obesity Market in North America (country-wise), till 2035 (USD Billion)
- Figure 20.4 Anti-obesity Market in Europe, till 2035 (USD Billion)
- Figure 20.5 Anti-obesity Market in Europe (country-wise), till 2035 (USD Billion)
- Figure 20.6 Anti-obesity Market in Asia-Pacific, till 2035 (USD Billion)
- Figure 20.7 Anti-obesity Market in Asia-Pacific (country-wise), till 2035 (USD Billion)
- Figure 20.8 Anti-obesity Market in Latin America, till 2035 (USD Billion)
- Figure 20.9 Anti-obesity Market in Latin America (country-wise), till 2035 (USD Billion)
- Figure 21.1 Contrave / Mysimba (Naltrexone, Bupropion) Sales Forecast, till 2035 (USD Billion)
- Figure 21.2 Feisumei (Beinaglutide) Sales Forecast, till 2035 (USD Billion)
- Figure 21.3 Imcivree (Setmelanotide) Sales Forecast, till 2035 (USD Billion)
- Figure 21.4 LOMAIRA (Phentermine Hydrochloride) Sales Forecast, till 2035 (USD Billion)
- Figure 21.5 QSYMIA (Phentermine and Topiramate) Sales Forecast, till 2035 (USD Billion)
- Figure 21.6 Saxenda (Liraglutide) Sales Forecast, till 2035 (USD Billion)
- Figure 21.7 Wegovy / Ozempic (Semaglutide) Sales Forecast, till 2035 (USD Billion)
- Figure 21.8 Zepbound / Mounjaro (Tirzepatide) Sales Forecast, till 2035 (USD Billion)
- Figure 21.9 BI 456906 (Survodutide) Sales Forecast, till 2035 (USD Billion)
- Figure 21.10 CagriSema (Cagrilintide and Semaglutide) Sales Forecast, till 2035 (USD Billion)
- Figure 21.11 HM11260C (Efpeglenatide) Sales Forecast, till 2035 (USD Billion)
- Figure 21.12 HRS-9531 Sales Forecast, till 2035 (USD Billion)
- Figure 21.13 IBI362 (Mazdutide) Sales Forecast, till 2035 (USD Billion)
- Figure 21.14 LM-008 Sales Forecast, till 2035 (USD Billion)
- Figure 21.15 LY3437943 (Retatrutide) Sales Forecast, till 2035 (USD Billion)
- Figure 21.16 LY3502970 (Orforglipron) Sales Forecast, till 2035 (USD Billion)
- Figure 21.17 TG103 Sales Forecast, till 2035 (USD Billion)
- Figure 21.18 Semaglutide 7.2 mg (Subcutaneous) Sales Forecast, till 2035 (USD Billion)
- Figure 21.19 Semaglutide (Oral) Sales Forecast, till 2035 (USD Billion)
- Figure 21.20 XW003 Sales Forecast, till 2035 (USD Billion)
- Figure 22.1 Anti-obesity Drugs Market: Distribution by Key Players, 2020 (USD Billion)
- Figure 22.2 Anti-obesity Drugs Market: Distribution by Key Players, Current Year (USD Billion)
- Figure 22.3 Anti-obesity Drugs Market: Distribution by Key Players, 2035 (USD Billion)
 抗肥胖藥物:市場佔有率分析、行業趨勢和統計數據以及成長預測(2026-2031 年)
 抗肥胖藥物市場:依產品類型、劑型、給藥途徑及最終用戶分類-2026-2032年全球市場預測
 抗肥胖藥物市場:依作用機制、處方藥/非處方藥及地區分類。
 抗肥胖藥物市場分析及至2035年預測:類型、產品、服務、技術、組件、應用、劑型、最終用戶、設備、模式
 抗肥胖藥物市場規模、佔有率、趨勢及預測(依藥物類別、藥物類型、通路及地區分類,2026-2034年)
 抗肥胖藥物市場-全球產業規模、佔有率、趨勢、機會與預測:按作用機制、藥物類型、地區和競爭格局分類,2021-2031年
 抗肥胖藥物市場-2026-2031年預測
 抗肥胖藥的全球市場:治療類型·藥物類型·作用機制·給藥途徑·通路·各地區 (~2035年)
 2021 - 2031 年抗肥胖藥物市場規模及預測、全球及地區佔有率、趨勢及成長機會分析報告,涵蓋:按類型、藥物類別、應用、給藥途徑、配銷通路和地理分類
 抗肥胖藥物市場規模、佔有率、成長分析(按藥物類型、作用、劑量和地區分類)- 產業預測,2025 年至 2032 年