


 |
市場調查報告書
商品編碼
1817403
PFAS 檢測市場:產業趨勢及 2040 年全球預測:按樣品類型、提供的檢測服務、PFAS 分析物、檢測方法/標準、技術、最終用戶、地區和關鍵參與者劃分PFAS Testing Market: Industry Trends and Global Forecasts, Till 2040: Distribution by Type of Sample Tested, Testing Service Offered, PFAS Analyte Tested, Method / Testing Standard, Technology, End-user, Geographical Regions and Leading Players |
||||||
PFAS 檢測市場:概覽
全球 PFAS 檢測市場目前估值為 2.491 億美元,預計在預測期內將以 11.1% 的複合年增長率成長,到 2040 年將達到 12.095 億美元。
PFAS 檢測市場機會可分為以下幾個部分:
檢測樣品類型
- 水
- 土壤
- 食品和飲料
- 血液/血清/血漿
- 空氣
- 其他樣品
檢測服務提供
- 定量分析
- 篩選分析
- 擷取分析
PFAS 分析物檢測
- 全氟辛酸
- 全氟辛烷磺酸
- 全氟己烷磺酸
- 全氟壬酸
- 其他
檢測方法/標準
- 符合 EPA/USEPA 標準的解決方案
- 符合 ISO 標準的解決方案
- 符合 ASTM 標準的解決方案
- 符合 DIN 標準的解決方案
- 其他
科技
- LC-MS(液相層析-質譜聯用)
- GC-MS(氣相層析-質譜聯用)
- ELISA(酵素連結免疫吸附試驗)免疫吸附試驗
- NMR(核磁共振)
- 其他技術
最終使用者
- 製藥和生技公司
- 環境科學家
- 研究機構
- 政府機構
- 檢驗實驗室
- 其他
地區
- 北美
- 歐洲
- 亞太地區
- 中東和北非
- 拉丁美洲
北美市場
- 美國
- 加拿大
歐洲市場
- 德國
- 法國
- 西班牙
- 義大利
- 英國
亞太市場
p>- 中國
- 日本
- 韓國
- 印度
- 澳大利亞
中東和北非市場
- 沙烏地阿拉伯
- 卡達
- 阿拉伯聯合大公國
拉丁美洲市場
- 巴西
- 阿根廷
PFAS 檢測市場成長與趨勢
全氟烷基和多氟烷基物質 (PFAS) 是一類以氟原子連接烷基鏈為特徵的合成化合物。它們以其優異的耐久性、耐化學性和強度而聞名,廣泛應用於汽車、農業、建築、電子、醫藥和紡織等各個行業。
全氟辛烷磺酸 (PFAs) 最早發現於 20 世紀 30 年代末,並在 1950 年代逐漸普及,當時它們被添加到各種消費產品中。然而,在進入 21 世紀後,人們開始擔憂 PFAS 對健康的負面影響,這促使 PFAS 檢測方案應運而生。值得注意的是,由於揮發性 PFAS 化合物的影響,多囊性卵巢症候群 (PCOD)、高膽固醇、甲狀腺疾病和癌症等慢性疾病的發病率顯著上升,這引發了人們的嚴重擔憂。
美國環保署 (USEPA) 最近發布的一份報告發現,飲用水中的 PFAS 污染每年導致超過 6,800 例癌症病例,這凸顯了製定強有力的篩檢和檢測策略的迫切需求。公眾意識的不斷提高、美國環保署和國際標準化組織 (ISO) 等組織制定的嚴格監管指南以及分析測試方法的進步,都促使人們迫切需要解決 PFAS 污染問題。
此外,人口老化、對廢水處理和水資源管理的日益重視以及研究和媒體報告的增加等因素,正在顯著推動 PFAS 檢測行業的發展。這些努力旨在降低環境和健康風險,並更好地保護全球社區。
PFAS 檢測市場:關鍵洞察
本報告深入探討了 PFAS 檢測市場的現狀,並識別了行業內的潛在成長機會。本報告的主要內容包括:
- 近 40% 提供 PFAS 檢測解決方案的公司是中型企業,其中近 60% 位於北美。
- 約有100家公司提供PFAS檢測服務,其中約80%提供水樣檢測服務,其次是土壤樣本檢測(40%)。
- 近年來,合作活動穩定成長,併購成為最主要的合作模式,約佔所有合作案例的30%。
- 利害關係人對該領域日益增長的興趣也反映在近期合作進展的增加上,超過85%的合作是在過去三年內實施的。
- 預計到2040年,PFAS檢測市場將以每年11.1%的速度成長,其中亞太地區的成長速度更快。
- 近 55% 的市場收入來自液質聯用 (LC-MS) 技術,預計該細分市場的複合年增長率 (CAGR) 將接近 11%。
PFAS 檢測市場:主要細分市場
依樣本類型劃分,全球市場分為水、土壤、食品和飲料、血液/血清/血漿、空氣和其他樣本。目前,水質檢測細分市場佔市場主導地位。此外,值得強調的是,這一趨勢在未來不太可能改變。這是由於對安全供水的需求以及人們對水處理項目和水管理日益增長的興趣。其他推動市場成長的因素包括監管機構採用嚴格的指導方針來檢查飲用水中出現的污染物。監管壓力是主要推動因素,因為水務公司、市政當局和工業部門必須滿足這些標準。
根據提供的檢測服務,全球 PFAS 檢測市場細分為定量、篩選和提取。定量分析目前佔最大的市場佔有率。這是因為定量分析有助於準確測量 PFAS 水平,這可以透過各種技術實現,例如質譜分析,質譜分析在檢測和監測包括水和土壤在內的各種基質中的 PFAS 污染方面發揮關鍵作用。
根據檢測的 PFAS 分析物,全球 PFAS 檢測市場分為全氟辛酸、全氟辛烷磺酸、全氟己烷磺酸、全氟壬酸和其他分析物。其中,全氟辛酸佔了整個市場的絕大部分佔有率。這是因為這些化合物在消費品和工業應用中廣泛使用。
全球 PFAS 檢測市場依據測試方法/標準細分:符合 EPA/USEPA 標準的溶液、符合 ISO 標準的溶液、符合 ASTM 標準的溶液、符合 DIN 標準的溶液以及其他符合測試方法/標準的解決方案。目前,符合 EPA/USEPA 標準的溶液的銷售額佔了該市場的大部分佔有率。
依技術劃分,全球 PFAS 檢測市場分為液相層析-質譜 (LC-MS)、氣相層析質譜 (GC-MS)、酵素連結免疫吸附試驗 (ELISA)、核磁共振 (NMR) 和其他技術。液相層析質譜 (LC-MS) 細分市場佔整個 PFAS 檢測市場的大多數佔有率。然而,預計氣相層析質譜 (GC-MS) 細分市場在整個預測期內的複合年增長率將顯著提高。
依最終用戶細分,全球 PFAS 檢測市場分為製藥公司、環境科學家、研究機構、政府機構、檢測實驗室和其他最終用戶。目前,製藥公司佔了最大的市場佔有率,這一趨勢未來不太可能改變。
依主要地區劃分,市場分為北美、歐洲、亞太、中東和北非以及拉丁美洲。目前,北美佔了最大的市場佔有率。此外,值得注意的是,預計亞太市場在預測期內將以相對較高的複合年增長率成長。
PFAS 檢測市場參與者
- 安捷倫
- 丹納赫
- Envirolab Services
- Biotage
- FREDsense
- GL Sciences
- LCTech
- Macherey-Nagel
- 默克
- MPL Laboratories
- 珀金埃爾默
- 賽多利斯
- Symbio Laboratories
- 島津
- 沃特世公司
PFAS 檢測市場研究報告涵蓋了各個領域,包括:
PFAS 檢測市場研究報告提供了對各個領域的深入分析,包括:
- 市場規模和機會分析:對當前市場機會和未來成長潛力的詳細分析PFAS 檢測市場,重點關注以下關鍵細分市場:[A] 檢測樣品類型、[B] 提供的檢測服務類型、[C] 檢測的 PFAS 分析物類型、[D] 方法/測試標準、[E] 技術類型、[F] 最終用戶和 [G] 地區。
- 市場影響分析:對可能影響市場成長的各種因素進行全面分析,例如 [A] 推動因素、[B] 阻礙因素、[C] 機會和 [D] 現有課題。
- 市場格局:基於若干相關參數對 PFAS 檢測解決方案進行全面評估,例如 [A] 提供的服務類型、[B] 提供的檢測服務類型、[C] 提供的附加服務、[D] 檢測樣品類型、[E] 檢測的 PFAS 分析物類型、[F] 方法/測試標準和 [G] 最終用戶。
- PFAS 測試解決方案提供者概況:本報告提供了從事 PFAS 測試領域的解決方案提供者列表,並基於 [A] 成立年份、[B] 公司規模和 [C] 總部位置進行了分析。
- 競爭分析:A] 公司[A] 優勢、[B] 產品組合優勢、[C] 最終用戶等。基於各種相關參數,對該領域 PFAS 檢測公司進行深入的競爭分析,包括:[A] 公司概況、[B] 財務資訊(如有)、[C] 解決方案組合、[D] 最新發展和 [E] 未來展望。
- 合作夥伴關係與協作:基於若干相關參數,對 2021 年及以後 PFAS 檢測市場利益相關者之間達成的合作夥伴關係進行詳細分析,包括:[A] 合作年份、[B] 合作類型、[C] 合作夥伴類型、[D] 產品類型、[E] 方法/測試標準、[F] 最活躍參與者(參與者和地區關係數量)。
- 最新進展:基於若干相關參數,對 PFAS 測試領域的最新進展進行詳細分析,包括:[A] 開發年份、[B] 開發地區、[C] 開發類型、[D] 測試樣本類型、[E] 方法/測試標準、[F] 最終用戶、[G] 最活躍參與者(最新地區進展數量)和 [H] 地區進展數量。
目錄
第一部分:報告概述
第一章:引言
第二章:研究方法
第三章:市場動態
- 章節概述
- 預測研究法
- 市場估值框架
- 預測工具與技術
- 關鍵考慮因素
- 局限性
第四章:宏觀經濟指標
- 章節概述
- 市場動態
- 結論
第二部分:質性洞察
第五章:摘要整理
第六章 引言
- 章節概述
- PFAS 簡介
- PFAS 分類
- PFAS 的來源
- PFAS 的健康影響
- PFAS 檢測與監測
- 未來展望
第三部分:市場概況
第七章:市場格局
- 章節概述
- PFAS 偵測解決方案供應商:市場格局
第八章:競爭分析
- 章節概述
- 假設和關鍵參數
- 研究方法
- 同儕概述
- PFAS 檢測解決方案提供者:競爭分析
第四部分:公司簡介
第九章:公司簡介:北美 PFAS 檢測解決方案提供者
- 章節概述
- 安捷倫
- 丹納赫
- FREDsense
- 珀金埃爾默
- 沃特世公司
第十章:公司簡介:歐洲 PFAS 偵測解決方案提供者
- 章節概述
- Biotage
- LCTech
- Macherey-Nagel
- 默克
- 賽多利斯
第十一章:公司簡介:亞太地區 PFAS測試解決方案提供者
- 章節概述
- Envirolab 服務
- GL Sciences
- MPL Laboratories
- Symbio Laboratories
- Shimadzu
第五部分 市場趨勢
第十二章 合作夥伴關係與合作
- 章節概述
- 合作夥伴模式
- PFAS 測試解決方案提供者:合作夥伴關係與合作
第十三章 最新進展
- 章節概述
- PFAS 測試提供者:最新進展
第六部分 市場機會分析
第14章 市場影響分析:推動因素、阻礙因素、機會與課題
第15章 全球PFAS檢測市場
- 章節概述
- 關鍵假設與研究方法
- 全球PFAS檢測市場、歷史趨勢(2022年及以後)及預測(至2040年)
- 主要細分市場
第16章:PFAS檢測市場(依檢測樣品類型劃分)
第17章:PFAS檢測市場(依提供的檢測服務劃分)
第18章:PFAS檢測市場(依檢測的PFAS分析物劃分)
第19章:PFAS測試市場(依測試方法/測試標準)
第20章:PFAS測試市場(依技術)
第21章:PFAS測試市場(依最終用戶)
第22章:PFAS測試市場(按地區)
第7節:其他獨家見解
第24章:結論
第25章:高階主管見解
第26章:附錄1:表格資料
第27章:附錄2:公司與組織清單
PFAS TESTING MARKET: OVERVIEW
As per Roots Analysis, the global PFAS testing market size is currently valued at USD 249.1 million and is projected to reach USD 1,209.5 million by 2040, growing at a CAGR of 11.1% during the forecast period.
The opportunity for PFAS testing market has been distributed across the following segments:
Type of Sample Tested
- Water
- Soil
- Food and Beverages
- Blood / Serum / Plasma
- Air
- Other Samples Tested
Type of Testing Service Offered
- Quantification
- Screening
- Extraction
Type of PFAS Analyte Tested
- Perfluorooctanoic Acid
- Perfluorooctane Sulfonic Acid
- Perfluorohexane Sulfonate
- Perfluorononanoic Acid
- Other Analytes
Method / Testing Standard
- EPA / USEPA Compliant Solutions
- ISO Compliant Solutions
- ASTM Compliant Solutions
- DIN Compliant Solutions
- Other Method / Testing Standard Compliant Solutions
Type of Technology
- LC-MS (Liquid Chromatography-Mass Spectrometry)
- GC-MS (Gas Chromatography-Mass Spectrometry)
- ELISA (Enzyme-Linked Immunosorbent Assay)
- NMR (Nuclear Magnetic Resonance)
- Other Technologies
End-User
- Pharmaceutical and Biotechnology Companies
- Environmental Scientists
- Research Institutes
- Government Agencies
- Testing Laboratories
- Other End Users
Geographical Regions
- North America
- Europe
- Asia-Pacific
- Middle East and North Africa
- Latin America
Market in North America
- US
- Canada
Market in Europe
- Germany
- France
- Spain
- Italy
- UK
Market in Asia-Pacific
- China
- Japan
- South Korea
- India
- Australia
Market in Middle East and North Africa
- Saudi Arabia
- Qatar
- UAE
Market in Latin America
- Brazil
- Argentina
PFAS Testing Market: Growth and Trends
Per- and polyfluoroalkyl substances (PFAS) are a class of synthetic compounds characterized by fluorine atoms bonded to an alkyl chain. They are renowned for their exceptional durability, chemical resistance, and strength, and are widely utilized across various industries, such as automotive, agriculture, construction, electronics, medical, and textiles.
PFAs was first discovered in the late 1930s and gained prominence in the 1950s with their incorporation into various consumer products. However, growing concerns about its adverse health effects emerged in the 2000s, prompting increased scrutiny and the development of PFAS testing protocols. It is important to note that the prevalence of chronic diseases, such as PCOD, elevated cholesterol levels, thyroid, and cancers has significantly increased as a result of volatile PFAS compounds, therefore, raising serious concerns.
According to a recent report from the U.S. Environmental Protection Agency (USEPA), PFAS contamination in drinking water contributes over 6,800 cancer cases annually, highlighting the critical need for robust screening and detection strategies. The urgency to address PFAS contamination has been driven by heightened public awareness, stringent regulatory guidelines from organizations such as the USEPA and the International Organization for Standardization (ISO), and advancements in analytical testing methods.
Additionally, factors such as an aging population, increased emphasis on wastewater treatment and water management, and growing research and media coverage have significantly propelled the PFAS testing industry. These efforts aim to mitigate environmental and health risks, ensuring greater protection for communities worldwide.
PFAS Testing Market: Key Insights
The report delves into the current state of the PFAS testing market and identifies potential growth opportunities within the industry. The key takeaways of the report are:
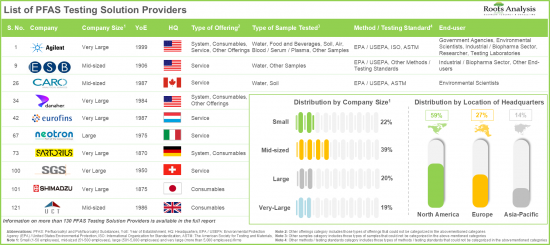
- Close to 40% of the companies engaged in offering PFAS testing solutions are mid-sized firms; of these, almost 60% of the firms are based in North America.
- Around 100 companies are offering PFAS testing services; of these, around 80% players provide testing services for water samples, followed by those testing soil samples (40%).
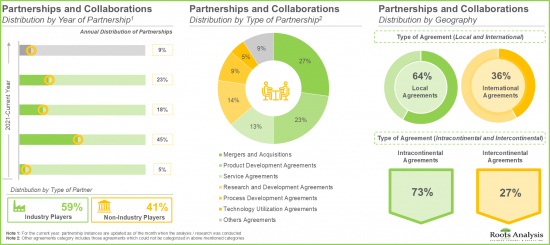
- A steady growth in the partnership activity has been observed in recent years; mergers and acquisitions emerged as the most prominent partnership model, accounting for around 30% of total partnership instances.
- The rising interest of stakeholders in this domain is reflected by the increase in recent development initiatives reported; notably, more than 85% of the initiatives were undertaken in the last three years.
- The PFAS testing market is anticipated to grow at an annualized rate of 11.1% till 2040; the market in Asia-Pacific is likely to grow at a faster pace.
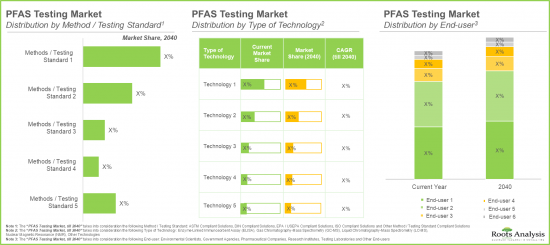
- Close to 55% of the market is expected to be captured by revenues generated from LC-MS technology; this segment is expected to grow at an annualized rate (CAGR) of close to 11%.
PFAS Testing Market: Key Segments
Water Testing is Likely to Hold the Largest Share in the PFAS Testing Market During the Forecast Period
Based on the type of sample tested, the global market is segmented into water, soil, food and beverages, blood / serum / plasma, air and other samples. Currently, the water testing segment leads the overall market. Further, it is important to highlight that this trend is unlikely to change in the future as well. This is due to the need for safe water supplies, growing focus towards water treatment projects and water management. The other factor that contributes to market growth includes the adoption of strict guidelines by regulatory bodies in order to check the emergent contaminants in drinking water. This regulatory pressure is a major driver, as water utilities, municipalities, and industries are necessitated to meet these standards.
Quantification Segment Hold the Largest Share in the PFAS Testing Market
Based on the type of testing service offered, the global PFAS testing market is segmented into quantification, screening and extraction. At present, the quantification segment accounts for the largest market share. This is because quantification helps in precise measurement of PFAS levels that can be achieved through various techniques, such as mass spectrometry which plays a major role in detecting and monitoring PFAS contamination in various matrices, including water and soil.
Revenues Generated from Perfluorooctanoic Acid Segment are Likely to Dominate the PFAS Testing Market During the Forecast Period
Based on the type of PFAS analyte tested, the global PFAS testing market is distributed across Perfluorooctanoic Acid, Perfluorooctane Sulfonic Acid, Perfluorohexane Sulfonic Acid, Perfluorononanoic Acid and other analytes. Notably, the Perfluorooctanoic acid segment captures majority of the overall market. This is due to the widespread usage of these compounds in consumer products and industrial applications.
PFAS Testing Market for EPA / USEPA Compliant Solutions is Likely to Grow at a Relatively Faster Pace During the Forecast Period
Based on the method / testing standard, the global PFAS testing market is segmented across EPA / USEPA compliant solutions, ISO compliant solutions, ASTM compliant solutions, DIN compliant solutions and other method / testing standard compliant solutions. Presently, the market is dominated by the revenues generated through phase EPA / USEPA compliant solutions.
Revenues Generated from LC-MS is Likely to Dominate the PFAS Testing Market During the Forecast Period
Based on the type of technology, the global PFAS testing market is distributed across LC-MS, GC-MS, ELISA, NMR and other technologies. Notably, the LC-MS segment captures the majority of the overall PFAS testing market. However, the GC-MS segment is anticipated to grow at significantly higher CAGR throughout the forecast period.
Pharmaceutical Companies Hold the Largest Share in the PFAS Testing Market
Based on the end-users, the global PFAS testing market is segmented into pharmaceutical companies, environmental scientists, research institutes, government agencies, testing laboratories and other end-users. Presently, the pharmaceutical companies' segment accounts for the largest market share. Further, this trend is unlikely to change in the coming future.
North America Accounts for the Largest Share in the Market
Based on key geographical regions, the market is segmented into North America, Europe, Asia Pacific, Middle East and North Africa, Latin America. In the current scenario, North America is likely to capture the largest market share. Further, it is worth highlighting that the market in Asia-Pacific is expected to grow at a relatively high CAGR during the forecast period.
Example Players in the PFAS Testing Market
- Agilent
- Danaher
- Envirolab Services
- Biotage
- FREDsense
- GL Sciences
- LCTech
- Macherey-Nagel
- Merck
- MPL Laboratories
- PerkinElmer
- Sartorius
- Symbio Laboratories
- Shimadzu
- Waters Corporation
PFAS Testing Market: Research Coverage
The report on PFAS testing market features insights into various sections, including:
- Market Sizing and Opportunity Analysis: An in-depth analysis of current market opportunity and the future growth potential of PFAS testing market, focusing on key market segments, including [A] type of sample tested, [B] type of testing service offered, [C] type of PFAS analyte tested, [D] method / testing standard, [E] type of technology, [F] end-user, and [G] geographical regions.
- Market Impact Analysis: A thorough analysis of various factors, such as [A] drivers, [B] restraints, [C] opportunities, and [D] existing challenges that are likely to impact market growth.
- Market Landscape: A comprehensive evaluation of PFAS testing solutions, based on several relevant parameters, such as [A] type of offering, [B] type of testing service offered, [C] additional services offered, [D] type of sample tested, [E] type of PFAS analyte tested, [F] method / testing standard, and [G] end-user.
- PFAS Testing Solution Providers Landscape: The report features a list of solution providers engaged in the PFAS testing domain, along with analyses based on [A] year of establishment, [B] company size, and [C] location of headquarters.
- Company Competitiveness Analysis: An insightful competitiveness analysis of the PFAS testing companies in this domain, based on various relevant parameters, such as [A] company strength, [B] portfolio strength, and [C] end-users.
- Company Profiles: Comprehensive profiles of key industry players in the PFAS testing domain, featuring information on [A] company overview, [B] financial information (if available), [C] solutions portfolio, [D] recent developments, and [E] future outlook statements.
- Partnerships and Collaborations: A detailed analysis of partnerships inked between stakeholders in the PFAS testing market, since 2021, based on several relevant parameters, such as [A] year of partnership, [B] type of partnership, [C] type of partner, [D] type of offering, [E] method / testing standard, [F] most active players (in terms of number of partnerships), and [G] geography.
- Recent Developments: A detailed analysis of the various recent developments undertaken in the PFAS testing domain, based on several relevant parameters, such as [A] year of development, [B] region of development, [C] type of development, [D] type of sample tested, [E] method / testing standard, [F] end-user, [G] most active players (in terms of number of recent developments), and [H] geography.
Key Questions Answered in this Report
- How many companies are currently engaged in this market?
- Which are the leading companies in this market?
- What factors are likely to influence the evolution of this market?
- What is the current and future market size?
- What is the CAGR of this market?
- How is the current and future market opportunity likely to be distributed across key market segments?
Reasons to Buy this Report
- The report provides a comprehensive market analysis, offering detailed revenue projections of the overall market and its specific sub-segments. This information is valuable to both established market leaders and emerging entrants.
- Stakeholders can leverage the report to gain a deeper understanding of the competitive dynamics within the market. By analyzing the competitive landscape, businesses can make informed decisions to optimize their market positioning and develop effective go-to-market strategies.
- The report offers stakeholders a comprehensive overview of the market, including key drivers, barriers, opportunities, and challenges. This information empowers stakeholders to stay abreast of market trends and make data-driven decisions to capitalize on growth prospects.
Additional Benefits
- Complimentary PPT Insights Packs
- Complimentary Excel Data Packs for all Analytical Modules in the Report
- 15% Free Content Customization
- Detailed Report Walkthrough Session with Research Team
- Free Updated report if the report is 6-12 months old or older
TABLE OF CONTENTS
SECTION I: REPORT OVERVIEW
1. PREFACE
- 1.1. Introduction
- 1.2. Market Share Insights
- 1.3. Key Market Insights
- 1.4. Report Coverage
- 1.5. Key Questions Answered
- 1.6. Chapter Outlines
2. RESEARCH METHODOLOGY
- 2.1. Chapter Overview
- 2.2. Research Assumptions
- 2.2.1. Market Landscape and Market Trends
- 2.2.2. Market Forecast and Opportunity Analysis
- 2.2.3. Comparative Analysis
- 2.3. Database Building
- 2.3.1. Data Collection
- 2.3.2. Data Validation
- 2.3.3. Data Analysis
- 2.4. Project Methodology
- 2.4.1. Secondary Research
- 2.4.1.1. Annual Reports
- 2.4.1.2. Academic Research Papers
- 2.4.1.3. Company Websites
- 2.4.1.4. Investor Presentations
- 2.4.1.5. Regulatory Filings
- 2.4.1.6. White Papers
- 2.4.1.7. Industry Publications
- 2.4.1.8. Conferences and Seminars
- 2.4.1.9. Government Portals
- 2.4.1.10. Media and Press Releases
- 2.4.1.11. Newsletters
- 2.4.1.12. Industry Databases
- 2.4.1.13. Roots Proprietary Databases
- 2.4.1.14. Paid Databases and Sources
- 2.4.1.15. Social Media Portals
- 2.4.1.16. Other Secondary Sources
- 2.4.2. Primary Research
- 2.4.2.1. Types of Primary Research
- 2.4.2.1.1. Qualitative Research
- 2.4.2.1.2. Quantitative Research
- 2.4.2.1.3. Hybrid Approach
- 2.4.2.2. Advantages of Primary Research
- 2.4.2.3. Techniques for Primary Research
- 2.4.2.3.1. Interviews
- 2.4.2.3.2. Surveys
- 2.4.2.3.3. Focus Groups
- 2.4.2.3.4. Observational Research
- 2.4.2.3.5. Social Media Interactions
- 2.4.2.4. Key Opinion Leaders Considered in Primary Research
- 2.4.2.4.1. Company Executives (CXOs)
- 2.4.2.4.2. Board of Directors
- 2.4.2.4.3. Company Presidents and Vice Presidents
- 2.4.2.4.4. Research and Development Heads
- 2.4.2.4.5. Technical Experts
- 2.4.2.4.6. Subject Matter Experts
- 2.4.2.4.7. Scientists
- 2.4.2.4.8. Doctors and Other Healthcare Providers
- 2.4.2.5. Ethics and Integrity
- 2.4.2.5.1. Research Ethics
- 2.4.2.5.2. Data Integrity
- 2.4.2.1. Types of Primary Research
- 2.4.3. Analytical Tools and Databases
- 2.4.1. Secondary Research
- 2.5. Robust Quality Control
3. MARKET DYNAMICS
- 3.1. Chapter Overview
- 3.2. Forecast Methodology
- 3.2.1. Top-down Approach
- 3.2.2. Bottom-up Approach
- 3.2.3. Hybrid Approach
- 3.3. Market Assessment Framework
- 3.3.1. Total Addressable Market (TAM)
- 3.3.2. Serviceable Addressable Market (SAM)
- 3.3.3. Serviceable Obtainable Market (SOM)
- 3.3.4. Currently Acquired Market (CAM)
- 3.4. Forecasting Tools and Techniques
- 3.4.1. Qualitative Forecasting
- 3.4.2. Correlation
- 3.4.3. Regression
- 3.4.4. Extrapolation
- 3.4.5. Convergence
- 3.4.6. Sensitivity Analysis
- 3.4.7. Scenario Planning
- 3.4.8. Data Visualization
- 3.4.9. Time Series Analysis
- 3.4.10. Forecast Error Analysis
- 3.5. Key Considerations
- 3.5.1. Demographics
- 3.5.2. Government Regulations
- 3.5.3. Reimbursement Scenarios
- 3.5.4. Market Access
- 3.5.5. Supply Chain
- 3.5.6. Industry Consolidation
- 3.5.7. Pandemic / Unforeseen Disruptions Impact
- 3.6. Limitations
4. MACRO-ECONOMIC INDICATORS
- 4.1. Chapter Overview
- 4.2. Market Dynamics
- 4.2.1. Time Period
- 4.2.1.1. Historical Trends
- 4.2.1.2. Current and Forecasted Estimates
- 4.2.2. Currency Coverage
- 4.2.2.1. Major Currencies Affecting the Market
- 4.2.2.2. Factors Affecting Currency Fluctuations
- 4.2.2.3. Impact of Currency Fluctuations on the Industry
- 4.2.3. Foreign Currency Exchange Rate
- 4.2.3.1. Impact of Foreign Exchange Rate Volatility on the Market
- 4.2.3.2. Strategies for Mitigating Foreign Exchange Risk
- 4.2.4. Recession
- 4.2.4.1. Assessment of Current Economic Conditions and Potential Impact on the Market
- 4.2.4.2. Historical Analysis of Past Recessions and Lessons Learnt
- 4.2.5. Inflation
- 4.2.5.1. Measurement and Analysis of Inflationary Pressures in the Economy
- 4.2.5.2. Potential Impact of Inflation on the Market Evolution
- 4.2.6. Interest Rates
- 4.2.6.1. Interest Rates and Their Impact on the Market
- 4.2.6.2. Strategies for Managing Interest Rate Risk
- 4.2.7. Commodity Flow Analysis
- 4.2.7.1. Type of Commodity
- 4.2.7.2. Origins and Destinations
- 4.2.7.3. Value and Weights
- 4.2.7.4. Modes of Transportation
- 4.2.8. Global Trade Dynamics
- 4.2.8.1. Import Scenario
- 4.2.8.2. Export Scenario
- 4.2.8.3. Trade Policies
- 4.2.8.4. Strategies for Mitigating the Risks Associated with Trade Barriers
- 4.2.8.5. Impact of Trade Barriers on the Market
- 4.2.9. War Impact Analysis
- 4.2.9.1. Russian-Ukraine War
- 4.2.9.2. Israel-Hamas War
- 4.2.10. COVID Impact / Related Factors
- 4.2.10.1. Global Economic Impact
- 4.2.10.2. Industry-specific Impact
- 4.2.10.3. Government Response and Stimulus Measures
- 4.2.10.4. Future Outlook and Adaptation Strategies
- 4.2.11. Other Indicators
- 4.2.11.1. Fiscal Policy
- 4.2.11.2. Consumer Spending
- 4.2.11.3. Gross Domestic Product (GDP)
- 4.2.11.4. Employment
- 4.2.11.5. Taxes
- 4.2.11.6. Stock Market Performance
- 4.2.11.7. Cross-Border Dynamics
- 4.2.1. Time Period
- 4.3. Conclusion
SECTION II: QUALITATIVE INSIGHTS
5. EXECUTIVE SUMMARY
6. INTRODUCTION
- 6.1. Chapter Overview
- 6.2. Introduction to PFAS
- 6.3. Classification of PFAS
- 6.4. Sources of PFAS
- 6.5. Impact of PFAS on Health
- 6.6. Testing and Monitoring of PFAS
- 6.6.1. Commonly used PFAS Testing Methods
- 6.6.2. Standard PFAS Testing Methods
- 6.7. Future Perspectives
SECTION III: MARKET OVERVIEW
7. MARKET LANDSCAPE
- 7.1. Chapter Overview
- 7.2. PFAS Testing Solution Providers: Overall Market Landscape
- 7.2.1. Analysis by Year of Establishment
- 7.2.2. Analysis by Company Size
- 7.2.3. Analysis by Location of Headquarters
- 7.2.4. Analysis by Type of Offering
- 7.2.5. Analysis by Type of Testing Service Offered
- 7.2.6. Analysis by Additional Services Offered
- 7.2.7. Analysis by Type of Sample Tested
- 7.2.8. Analysis by Type of PFAS Analyte Tested
- 7.2.9. Analysis by Method / Testing Standard
- 7.2.10. Analysis by End-user
8. COMPANY COMPETITIVENESS ANALYSIS
- 8.1. Chapter Overview
- 8.2. Assumptions and Key Parameters
- 8.3. Methodology
- 8.4. Overview of Peer Groups
- 8.5. PFAS Testing Solution Providers: Company Competitiveness Analysis
- 8.5.1. PFAS Testing Solution Providers based in North America
- 8.5.2. PFAS Testing Solution Providers based in Europe
- 8.5.3. PFAS Testing Solution Providers based in Asia-Pacific
SECTION IV: COMPANY PROFILES
9. COMPANY PROFILES: PFAS TESTING SOLUTION PROVIDERS IN NORTH AMERICA
- 9.1. Chapter Overview
- 9.2. Agilent
- 9.2.1. Company Overview
- 9.2.2. PFAS Testing Solutions Portfolio
- 9.2.3. Financial Information
- 9.2.4. Recent Developments and Future Outlook
- 9.3. Danaher
- 9.4. FREDsense
- 9.5. PerkinElmer
- 9.6. Waters Corporation
10. COMPANY PROFILES: PFAS TESTING SOLUTION PROVIDERS IN EUROPE
- 10.1. Chapter Overview
- 10.2. Biotage
- 10.2.1. Company Overview
- 10.2.2. PFAS Testing Solutions Portfolio
- 10.2.3. Financial Information
- 10.2.4. Recent Developments and Future Outlook
- 10.3. LCTech
- 10.4. Macherey-Nagel
- 10.5. Merck
- 10.6. Sartorius
11. COMPANY PROFILES: PFAS TESTING SOLUTION PROVIDERS IN ASIA-PACIFIC
- 11.1. Chapter Overview
- 11.2. Envirolab Services
- 11.2.1. Company Overview
- 11.2.2. PFAS Testing Solutions Portfolio
- 11.2.3. Recent Developments and Future Outlook
- 11.3. GL Sciences
- 11.4. MPL Laboratories
- 11.5. Symbio Laboratories
- 11.6. Shimadzu
SECTION V: MARKET TRENDS
12. PARTNERSHIPS AND COLLABORATIONS
- 12.1. Chapter Overview
- 12.2. Partnership Models
- 12.3. PFAS Testing Solution Providers: Partnerships and Collaborations
- 12.3.1. Analysis by Year of Partnership
- 12.3.2. Analysis by Type of Partnership
- 12.3.3. Analysis by Year and Type of Partnership
- 12.3.4. Analysis by Year and Type of Partner
- 12.3.5. Analysis by Type of Offering
- 12.3.6. Analysis by Method / Testing Standard
- 12.3.7. Most Active Players: Distribution by Number of Partnerships
- 12.3.8. Analysis by Geography
- 12.3.8.1. Distribution by Country
- 12.3.8.2. Distribution by Region
13. RECENT DEVELOPMENTS
- 13.1. Chapter Overview
- 13.2. PFAS Testing Providers: Recent Developments
- 13.2.1. Analysis by Year of Expansion
- 13.2.2. Analysis by Region of Development
- 13.2.3. Analysis by Type of Development
- 13.2.4. Analysis by Year and Type of Development
- 13.2.5. Analysis by Type of Sample Tested
- 13.2.6. Analysis by Method / Testing Standard
- 13.2.7. Analysis by End-user
- 13.2.8. Most Active Players: Analysis by Number of Recent Developments
- 13.2.9. Analysis by Geography
SECTION VI: MARKET OPPORTUNITY ANALYSIS
14. MARKET IMPACT ANALYSIS: DRIVERS, RESTRAINTS, OPPORTUNITIES AND CHALLENGES
- 14.1. Chapter Overview
- 14.2. Market Drivers
- 14.3. Market Restraints
- 14.4. Market Opportunities
- 14.5. Market Challenges
- 14.6. Conclusion
15. GLOBAL PFAS TESTING MARKET
- 15.1. Chapter Overview
- 15.2. Key Assumptions and Methodology
- 15.3. Global PFAS Testing Market, Historical Trends (Since 2022) and Forecasted Estimates (Till 2040)
- 15.3.1. Multivariate Scenario Analysis
- 15.3.1.1. Conservative Scenario
- 15.3.1.2. Optimistic Scenario
- 15.3.1. Multivariate Scenario Analysis
- 15.4. Key Market Segmentations
16. PFAS TESTING MARKET, BY TYPE OF SAMPLE TESTED
- 16.1. Chapter Overview
- 16.2. Key Assumptions and Methodology
- 16.3. PFAS Testing Market: Distribution by Type of Sample Tested
- 16.3.1. PFAS Testing Market for Water Testing: Historical Trends (Since 2022) and Forecasted Estimates (Till 2040)
- 16.3.2. PFAS Testing Market for Soil Testing: Historical Trends (Since 2022) and Forecasted Estimates (Till 2040)
- 16.3.3. PFAS Testing Market for Food and Beverage Testing: Historical Trends (Since 2022) and Forecasted Estimates (Till 2040)
- 16.3.4. PFAS Testing Market for Blood / Serum / Plasma Testing: Historical Trends (Since 2022) and Forecasted Estimates (Till 2040)
- 16.3.5. PFAS Testing Market for Air Testing: Historical Trends (Since 2022) and Forecasted Estimates (Till 2040)
- 16.4. Data Triangulation and Validation
17. PFAS TESTING MARKET, BY TYPE OF TESTING SERVICE OFFERED
- 17.1. Chapter Overview
- 17.2. Key Assumptions and Methodology
- 17.3. PFAS Testing Market: Distribution by Type of Testing Service Offered
- 17.3.1. PFAS Testing Market for Extraction: Historical Trends (Since 2022) and Forecasted Estimates (Till 2040)
- 17.3.2. PFAS Testing Market for Screening: Historical Trends (Since 2022) and Forecasted Estimates (Till 2040)
- 17.3.3. PFAS Testing Market for Quantification: Historical Trends (Since 2022) and Forecasted Estimates (Till 2040)
- 17.4. Data Triangulation and Validation
18. PFAS TESTING MARKET, BY TYPE OF PFAS ANALYTE TESTED
- 18.1. Chapter Overview
- 18.2. Key Assumptions and Methodology
- 18.3. PFAS Testing Market: Distribution by Type of PFAS Analyte Tested
- 18.3.1. PFAS Testing Market for Perfluorooctanoic Acid: Historical Trends (Since 2022) and Forecasted Estimates (Till 2040)
- 18.3.2. PFAS Testing Market for Perfluorooctane Sulfonic Acid: Historical Trends (Since 2022) and Forecasted Estimates (Till 2040)
- 18.3.3. PFAS Testing Market for Perfluorohexane Sulfonic Acid: Historical Trends (Since 2022) and Forecasted Estimates (Till 2040)
- 18.3.4. PFAS Testing Market for Perfluorononanoic Acid: Historical Trends (Since 2022) and Forecasted Estimates (Till 2040)
- 18.3.5. PFAS Testing Market for Other Analytes: Historical Trends (Since 2022) and Forecasted Estimates (Till 2040)
- 18.4. Data Triangulation and Validation
19. PFAS TESTING MARKET, BY METHOD / TESTING STANDARD
- 19.1. Chapter Overview
- 19.2. Key Assumptions and Methodology
- 19.3. PFAS Testing Market: Distribution by Method / Testing Standard
- 19.3.1. PFAS Testing Market for EPA / USEPA Compliant Solutions: Historical Trends (Since 2022) and Forecasted Estimates (Till 2040)
- 19.3.2. PFAS Testing Market for ISO Compliant Solutions: Historical Trends (Since 2022) and Forecasted Estimates (Till 2040)
- 19.3.3. PFAS Testing Market for ASTM Compliant Solutions: Historical Trends (Since 2022) and Forecasted Estimates (Till 2040)
- 19.3.4. PFAS Testing Market for DIN Compliant Solutions: Historical Trends (Since 2022) and Forecasted Estimates (Till 2040)
- 19.3.5. PFAS Testing Market for Other Method / Testing Standard Compliant Solutions: Historical Trends (Since 2022) and Forecasted Estimates (Till 2040)
- 19.4. Data Triangulation and Validation
20. PFAS TESTING MARKET, BY TYPE OF TECHNOLOGY
- 20.1. Chapter Overview
- 20.2. Key Assumptions and Methodology
- 20.3. PFAS Testing Market: Distribution by Type of Technology
- 20.3.1. PFAS Testing Market for Liquid Chromatography-Mass Spectrometry (LC-MS): Historical Trends (Since 2022) and Forecasted Estimates (Till 2040)
- 20.3.2. PFAS Testing Market for Gas Chromatography-Mass Spectrometry (GC-MS): Historical Trends (Since 2022) and Forecasted Estimates (Till 2040)
- 20.3.3. PFAS Testing Market for Enzyme-Linked Immunosorbent Assay (ELISA): Historical Trends (Since 2022) and Forecasted Estimates (Till 2040)
- 20.3.4. PFAS Testing Market for Nuclear Magnetic Resonance (NMR): Historical Trends (Since 2022) and Forecasted Estimates (Till 2040)
- 20.3.5. PFAS Testing Market for Other Technologies: Historical Trends (Since 2022) and Forecasted Estimates (Till 2040)
- 20.4. Data Triangulation and Validation
21. PFAS TESTING MARKET, BY END-USER
- 21.1. Chapter Overview
- 21.2. Key Assumptions and Methodology
- 21.3. PFAS Testing Market: Distribution by End-user
- 21.3.1. PFAS Testing Market for Pharmaceutical Companies: Historical Trends (Since 2022) and Forecasted Estimates (Till 2040)
- 21.3.2. PFAS Testing Market for Environmental Scientists: Historical Trends (Since 2022) and Forecasted Estimates (Till 2040)
- 21.3.3. PFAS Testing Market for Research Institutes: Historical Trends (Since 2022) and Forecasted Estimates (Till 2040)
- 21.3.4. PFAS Testing Market for Government Agencies: Historical Trends (Since 2022) and Forecasted Estimates (Till 2040)
- 21.3.5. PFAS Testing Market for Testing Laboratories: Historical Trends (Since 2022) and Forecasted Estimates (Till 2040)
- 21.3.6. PFAS Testing Market for Other End-users: Historical Trends (Since 2022) and Forecasted Estimates (Till 2040)
- 21.4. Data Triangulation and Validation
22. PFAS TESTING MARKET, BY GEOGRAPHICAL REGIONS
- 22.1. Chapter Overview
- 22.2. Key Assumptions and Methodology
- 22.3. PFAS Testing Market: Distribution by Key Geographical Regions
- 22.3.1. PFAS Testing Market in North America: Historical Trends (Since 2022) and Forecasted Estimates (Till 2040)
- 22.3.1.1. PFAS Testing Market in the US: Historical Trends (Since 2022) and Forecasted Estimates (Till 2040)
- 22.3.1.2. PFAS Testing Market in Canada: Historical Trends (Since 2022) and Forecasted Estimates (Till 2040)
- 22.3.2. PFAS Testing Market in Europe: Historical Trends (Since 2022) and Forecasted Estimates (Till 2040)
- 22.3.2.1. PFAS Testing Market in Germany: Historical Trends (Since 2022) and Forecasted Estimates (Till 2040)
- 22.3.2.2. PFAS Testing Market in France: Historical Trends (Since 2022) and Forecasted Estimates (Till 2040)
- 22.3.2.3. PFAS Testing Market in Spain: Historical Trends (Since 2022) and Forecasted Estimates (Till 2040)
- 22.3.2.4. PFAS Testing Market in Italy: Historical Trends (Since 2022) and Forecasted Estimates (Till 2040)
- 22.3.2.5. PFAS Testing Market in the UK: Historical Trends (Since 2022) and Forecasted Estimates (Till 2040)
- 22.3.3. PFAS Testing Market in Asia-Pacific: Historical Trends (Since 2022) and Forecasted Estimates (Till 2040)
- 22.3.3.1. PFAS Testing Market in China: Historical Trends (Since 2022) and Forecasted Estimates (Till 2040)
- 22.3.3.2. PFAS Testing Market in Japan: Historical Trends (Since 2022) and Forecasted Estimates (Till 2040)
- 22.3.3.3. PFAS Testing Market in South Korea: Historical Trends (Since 2022) and Forecasted Estimates (Till 2040)
- 22.3.3.4. PFAS Testing Market in India: Historical Trends (Since 2022) and Forecasted Estimates (Till 2040)
- 22.3.3.5. PFAS Testing Market in Australia: Historical Trends (Since 2022) and Forecasted Estimates (Till 2040)
- 22.3.4. PFAS Testing Market in Middle East and North Africa: Historical Trends (Since 2022) and Forecasted Estimates (Till 2040)
- 22.3.4.1. PFAS Testing Market in Saudi Arabia: Historical Trends (Since 2022) and Forecasted Estimates (Till 2040)
- 22.3.4.2. PFAS Testing Market in Qatar: Historical Trends (Since 2022) and Forecasted Estimates (Till 2040)
- 22.3.4.3. PFAS Testing Market in UAE: Historical Trends (Since 2022) and Forecasted Estimates (Till 2040)
- 22.3.5. PFAS Testing Market in Latin America: Historical Trends (Since 2022) and Forecasted Estimates (Till 2040)
- 22.3.5.1. PFAS Testing Market in Brazil: Historical Trends (Since 2022) and Forecasted Estimates (Till 2040)
- 22.3.5.2. PFAS Testing Market in Argentina: Historical Trends (Since 2022) and Forecasted Estimates (Till 2040)
- 22.3.1. PFAS Testing Market in North America: Historical Trends (Since 2022) and Forecasted Estimates (Till 2040)
- 22.4. Market Movement Analysis
- 22.4.1. Penetration-Growth (P-G) Matrix
- 22.5. Data Triangulation and Validation
23. PFAS TESTING MARKET, BY LEADING PLAYERS
- 23.1. Chapter Overview
- 23.2. Leading Industry Players
SECTION VII: OTHER EXCLUSIVE INSIGHTS
24. CONCLUDING REMARKS
25. EXECUTIVE INSIGHTS
26. APPENDIX 1: TABULATED DATA
27. APPENDIX 2: LIST OF COMPANIES AND ORGANIZATIONS
List of Tables
- Table 7.1 PFAS Testing Solution Providers: Information on Year of Establishment, Company Size and Location of Headquarters
- Table 7.2 PFAS Testing Solution Providers: Information on Type of Offering, Type of Testing Service Offered and Additional Service Offered
- Table 7.3 PFAS Testing Solution Providers: Information on Type of Sample Tested and Type of PFAS Analyte Tested
- Table 7.4 PFAS Testing Solution Providers: Information on Method / Testing Standard and End-user
- Table 9.1 PFAS Testing Solution Providers based in North America: List of Companies Profiled
- Table 9.2 Agilent: Company Overview
- Table 9.3 Agilent: PFAS Testing Solutions Portfolio
- Table 9.4 Agilent: Recent Developments and Future Outlook
- Table 9.5 Danaher: Company Overview
- Table 9.6 Danaher: PFAS Testing Solutions Portfolio
- Table 9.7 Danaher: Recent Developments and Future Outlook
- Table 9.8 FREDsense: Company Overview
- Table 9.9 FREDsense: PFAS Testing Solutions Portfolio
- Table 9.10 FREDsense: Recent Developments and Future Outlook
- Table 9.11 PerkinElmer: Company Overview
- Table 9.12 PerkinElmer: PFAS Testing Solutions Portfolio
- Table 9.13 PerkinElmer: Recent Developments and Future Outlook
- Table 9.14 Waters Corporation: Company Overview
- Table 9.15 Waters Corporation: PFAS Testing Solutions Portfolio
- Table 9.16 Waters Corporation: Recent Developments and Future Outlook
- Table 10.1 PFAS Testing Solution Providers based in Europe: List of Companies Profiled
- Table 10.2 Biotage: Company Overview
- Table 10.3 Biotage: PFAS Testing Solutions Portfolio
- Table 10.4 Biotage: Recent Developments and Future Outlook
- Table 10.5 LCTech: Company Overview
- Table 10.6 LCTech: PFAS Testing Solutions Portfolio
- Table 10.7 LCTech: Recent Developments and Future Outlook
- Table 10.8 MACHEREY-NAGEL: Company Overview
- Table 10.9 MACHEREY-NAGEL: PFAS Testing Solutions Portfolio
- Table 10.10 Merck: Company Overview
- Table 10.11 Merck: PFAS Testing Solutions Portfolio
- Table 10.12 Sartorius: Company Overview
- Table 10.13 Sartorius: PFAS Testing Solutions Portfolio
- Table 10.14 Sartorius: Recent Developments and Future Outlook
- Table 11.1 PFAS Testing Solution Providers based in Asia-Pacific: List of Companies Profiled
- Table 11.2 Envirolab Services: Company Overview
- Table 11.3 Envirolab Services: PFAS Testing Solutions Portfolio
- Table 11.4 Envirolab Services: Recent Developments and Future Outlook
- Table 11.5 GL Sciences: Company Overview
- Table 11.6 GL Sciences: PFAS Testing Solutions Portfolio
- Table 11.7 MPL Laboratories: Company Overview
- Table 11.8 MPL Laboratories: PFAS Testing Solutions Portfolio
- Table 11.9 Symbio Laboratories: Company Overview
- Table 11.10 Symbio Laboratories: PFAS Testing Solutions Portfolio
- Table 11.11 Shimadzu: Company Overview
- Table 11.12 Shimadzu: PFAS Testing Solutions Portfolio
- Table 11.13 Shimadzu: Recent Developments and Future Outlook
- Table 12.1 PFAS Testing Solution Providers: List of Partnerships and Collaborations, Since 2021
- Table 12.2 Partnerships and Collaborations: Information on Location of Headquarters (Country) and Type of Agreement (Country and Region)
- Table 25.1 Prein&Newhof: Company Snapshot
- Table 26.1 PFAS Testing Providers: Distribution by Year of Establishment
- Table 26.2 PFAS Testing Providers: Distribution by Company Size
- Table 26.3 PFAS Testing Providers: Distribution by Location of Headquarters
- Table 26.4 PFAS Testing Providers: Distribution by Type of Offering
- Table 26.5 PFAS Testing Providers: Distribution by Type of Testing Service Offered
- Table 26.6 PFAS Testing Providers: Distribution by Additional Service Offered
- Table 26.7 PFAS Testing Providers: Distribution by Type of Sample Tested
- Table 26.8 PFAS Testing Providers: Distribution by Type of PFAS Analyte Tested
- Table 26.9 PFAS Testing Providers: Distribution by Method / Testing Standard
- Table 26.10 PFAS Testing Providers: Distribution by End-user
- Table 26.11 Agilent: Annual Revenues, Since 2021 (USD Billion)
- Table 26.12 Danaher: Annual Revenues, Since 2021 (USD Billion)
- Table 26.13 PerkinElmer: Annual Revenues, Since 2021 (USD Billion)
- Table 26.14 Waters Corporation: Annual Revenues, Since 2021 (USD Billion)
- Table 26.15 Biotage: Annual Revenues, Since 2021 (SEK Billion)
- Table 26.16 Merck: Annual Revenues, Since 2021 (EUR Billion)
- Table 26.17 Sartorius: Annual Revenues, Since 2021 (EUR Billion)
- Table 26.18 Shimadzu: Annual Revenues, Since 2021 (JPY Billion)
- Table 26.19 Partnerships and Collaborations: Cumulative Year-wise Trend, Since 2021
- Table 26.20 Partnerships and Collaborations: Distribution by Type of Partnership
- Table 26.21 Partnerships and Collaborations: Distribution by Year and Type of Partnership, Since 2021
- Table 26.22 Partnerships and Collaborations: Distribution by Type of Partner
- Table 26.23 Partnerships and Collaborations: Distribution by Type of Offering
- Table 26.24 Partnerships and Collaborations: Distribution by Type of Sample Tested
- Table 26.25 Most Active Players: Distribution by Number of Partnerships
- Table 26.26 Partnerships and Collaborations: Distribution by Country
- Table 26.27 Partnerships and Collaborations: Distribution by Region
- Table 26.28 Recent Developments: Cumulative Year-wise Trend, Since 2021
- Table 26.29 Recent Developments: Distribution by Type of Development
- Table 26.30 Recent Developments: Distribution by Year and Type of Development, Since 2021
- Table 26.31 Recent Developments: Distribution by Type of Sample Tested
- Table 26.32 Recent Developments: Distribution by Testing Service Offered
- Table 26.33 Recent Developments: Distribution by Method / Testing Standard
- Table 26.34 Recent Developments: Distribution by End-user
- Table 26.35 Most Active Players: Distribution by Number of Recent Developments
- Table 26.36 Recent Developments: Distribution by Geography
- Table 26.37 Global PFAS Testing Market, Historical Trends (Since 2022) and Forecasted Estimates (Till 2040) (USD Million)
- Table 26.38 Global PFAS Testing Market, Forecasted Estimates (Till 2040): Conservative Scenario (USD Million)
- Table 26.39 Global PFAS Testing Market, Forecasted Estimates (Till 2040): Optimistic Scenario (USD Million)
- Table 26.40 PFAS Testing Market: Distribution by Type of Sample Tested
- Table 26.41 PFAS Testing Market for Water Testing, Historical Trends (Since 2022) and Forecasted Estimates (Till 2040) (USD Million)
- Table 26.42 PFAS Testing Market for Soil Testing, Historical Trends (Since 2022) and Forecasted Estimates (Till 2040) (USD Million)
- Table 26.43 PFAS Testing Market for Food and Beverages Testing, Historical Trends (Since 2022) and Forecasted Estimates (Till 2040) (USD Million)
- Table 26.44 PFAS Testing Market for Blood / Serum / Plasma Testing, Historical Trends (Since 2022) and Forecasted Estimates (Till 2040) (USD Million)
- Table 26.45 PFAS Testing Market for Air Testing, Historical Trends (Since 2022) and Forecasted Estimates (Till 2040) (USD Million)
- Table 26.46 PFAS Testing Market: Distribution by Type of Testing Service Offered
- Table 26.47 PFAS Testing Market for Quantification, Historical Trends (Since 2022) and Forecasted Estimates (Till 2040) (USD Million)
- Table 26.48 PFAS Testing Market for Screening, Historical Trends (Since 2022) and Forecasted Estimates (Till 2040) (USD Million)
- Table 26.49 PFAS Testing Market for Extraction, Historical Trends (Since 2022) and Forecasted Estimates (Till 2040) (USD Million)
- Table 26.50 PFAS Testing Market: Distribution by Type of PFAS Analyte Tested
- Table 26.51 PFAS Testing Market for Perfluorooctanoic Acid, Historical Trends (Since 2022) and Forecasted Estimates (Till 2040) (USD Million)
- Table 26.52 PFAS Testing Market for Perfluorooctane Sulfonic Acid, Historical Trends (Since 2022) and Forecasted Estimates (Till 2040) (USD Million)
- Table 26.53 PFAS Testing Market for Perfluorohexane Sulfonic Acid, Historical Trends (Since 2022) and Forecasted Estimates (Till 2040) (USD Million)
- Table 26.54 PFAS Testing Market for Perfluorononanoic Acid, Historical Trends (Since 2022) and Forecasted Estimates (Till 2040) (USD Million)
- Table 26.55 PFAS Testing Market for Other Analytes, Historical Trends (Since 2022) and Forecasted Estimates (Till 2040) (USD Million)
- Table 26.56 PFAS Testing Market: Distribution by Type of Method / Testing Standard
- Table 26.57 PFAS Testing Market for EPA Compliant Solutions, Historical Trends (Since 2022) and Forecasted Estimates (Till 2040) (USD Million)
- Table 26.58 PFAS Testing Market for ISO Compliant Solutions, Historical Trends (Since 2022) and Forecasted Estimates (Till 2040) (USD Million)
- Table 26.59 PFAS Testing Market for ASTM Compliant Solutions, Historical Trends (Since 2022) and Forecasted Estimates (Till 2040) (USD Million)
- Table 26.60 PFAS Testing Market for DIN Compliant Solutions, Historical Trends (Since 2022) and Forecasted Estimates (Till 2040) (USD Million)
- Table 26.61 PFAS Testing Market for Other Method / Testing Standard Compliant Solutions, Historical Trends (Since 2022) and Forecasted Estimates (Till 2040) (USD Million)
- Table 26.62 PFAS Testing Market: Distribution by Type of Technology
- Table 26.63 PFAS Testing Market for Liquid Chromatography-Mass Spectrometry (LC-MS), Historical Trends (Since 2022) and Forecasted Estimates (Till 2040) (USD Million)
- Table 26.64 PFAS Testing Market for Gas Chromatography-Mass Spectrometry (GC-MS), Historical Trends (Since 2022) and Forecasted Estimates (Till 2040) (USD Million)
- Table 26.65 PFAS Testing Market for Enzyme-Linked Immunosorbent Assay (ELISA), Historical Trends (Since 2022) and Forecasted Estimates (Till 2040) (USD Million)
- Table 26.66 PFAS Testing Market for Nuclear Magnetic Resonance (NMR), Historical Trends (Since 2022) and Forecasted Estimates (Till 2040) (USD Million)
- Table 26.67 PFAS Testing Market for Other Technologies, Historical Trends (Since 2022) and Forecasted Estimates (Till 2040) (USD Million)
- Table 26.68 PFAS Testing Market: Distribution by End-user
- Table 26.69 PFAS Testing Market for Industrial / Biopharma Sector, Historical Trends (Since 2022) and Forecasted Estimates (Till 2040) (USD Million)
- Table 26.70 PFAS Testing Market for Environmental Scientists, Historical Trends (Since 2022) and Forecasted Estimates (Till 2040) (USD Million)
- Table 26.71 PFAS Testing Market for Researchers, Historical Trends (Since 2022) and Forecasted Estimates (Till 2040) (USD Million)
- Table 26.72 PFAS Testing Market for Government Agencies, Historical Trends (Since 2022) and Forecasted Estimates (Till 2040) (USD Million)
- Table 26.73 PFAS Testing Market for Testing Laboratories, Historical Trends (Since 2022) and Forecasted Estimates (Till 2040) (USD Million)
- Table 26.74 PFAS Testing Market for Other End-users, Historical Trends (Since 2022) and Forecasted Estimates (Till 2040) (USD Million)
- Table 26.75 PFAS Testing Market: Distribution by Geographical Regions
- Table 26.76 PFAS Testing Market in North America, Historical Trends (Since 2022) and Forecasted Estimates (Till 2040) (USD Million)
- Table 26.77 PFAS Testing Market in the US, Historical Trends (Since 2022) and Forecasted Estimates (Till 2040) (USD Million)
- Table 26.78 PFAS Testing Market in Canada, Historical Trends (Since 2022) and Forecasted Estimates (Till 2040) (USD Million)
- Table 26.79 PFAS Testing Market in Europe, Historical Trends (Since 2022) and Forecasted Estimates (Till 2040) (USD Million) (USD Million)
- Table 26.80 PFAS Testing Market in Germany, Historical Trends (Since 2022) and Forecasted Estimates (Till 2040) (USD Million)
- Table 26.81 PFAS Testing Market in France, Historical Trends (Since 2022) and Forecasted Estimates (Till 2040) (USD Million)
- Table 26.82 PFAS Testing Market in Spain, Historical Trends (Since 2022) and Forecasted Estimates (Till 2040) (USD Million)
- Table 26.83 PFAS Testing Market in Italy, Historical Trends (Since 2022) and Forecasted Estimates (Till 2040) (USD Million)
- Table 26.84 PFAS Testing Market in the UK, Historical Trends (Since 2022) and Forecasted Estimates (Till 2040) (USD Million)
- Table 26.85 PFAS Testing Market in Asia-Pacific, Historical Trends (Since 2022) and Forecasted Estimates (Till 2040) (USD Million)
- Table 26.86 PFAS Testing Market in China, Historical Trends (Since 2022) and Forecasted Estimates (Till 2040) (USD Million)
- Table 26.87 PFAS Testing Market in Japan, Historical Trends (Since 2022) and Forecasted Estimates (Till 2040) (USD Million)
- Table 26.88 PFAS Testing Market in South Korea, Historical Trends (Since 2022) and Forecasted Estimates (Till 2040) (USD Million)
- Table 26.89 PFAS Testing Market in India, Historical Trends (Since 2022) and Forecasted Estimates (Till 2040) (USD Million)
- Table 26.90 PFAS Testing Market in Australia, Historical Trends (Since 2022) and Forecasted Estimates (Till 2040) (USD Million)
- Table 26.91 PFAS Testing Market in Middle East and North Africa, Historical Trends (Since 2022) and Forecasted Estimates (Till 2040) (USD Million)
- Table 26.92 PFAS Testing Market in Saudi Arabia, Historical Trends (Since 2022) and Forecasted Estimates (Till 2040) (USD Million)
- Table 26.93 PFAS Testing Market in Qatar, Historical Trends (Since 2022) and Forecasted Estimates (Till 2040) (USD Million)
- Table 26.94 PFAS Testing Market in UAE, Historical Trends (Since 2022) and Forecasted Estimates (Till 2040) (USD Million)
- Table 26.95 PFAS Testing Market in Latin America, Historical Trends (Since 2022) and Forecasted Estimates (Till 2040) (USD Million)
- Table 26.96 PFAS Testing Market in Brazil, Historical Trends (Since 2022) and Forecasted Estimates (Till 2040) (USD Million)
- Table 26.97 PFAS Testing Market in Argentina, Historical Trends (Since 2022) and Forecasted Estimates (Till 2040) (USD Million)
- Table 26.98 PFAS Testing Market: Distribution by Leading Player
List of Figures
- Figure 2.1 Research Methodology: Project Methodology
- Figure 2.2 Research Methodology: Data Sources for Secondary Research
- Figure 2.3 Research Methodology: Robust Quality Control
- Figure 3.1 Market Dynamics: Forecast Methodology
- Figure 3.2 Market Dynamics: Market Assessment Framework
- Figure 4.1 Lessons Learnt from Past Recessions
- Figure 5.1 Executive Summary: Market Landscape
- Figure 5.2 Executive Summary: Market Trends
- Figure 5.3 Executive Summary: Market Forecast and Opportunity Analysis
- Figure 6.1 Structure of PFAS
- Figure 6.2 Classification of PFAS
- Figure 6.3 Sources of PFAS
- Figure 6.4 PFAS Testing Methods
- Figure 7.1 PFAS Testing Solution Providers: Distribution by Year of Establishment
- Figure 7.2 PFAS Testing Solution Providers: Distribution by Company Size
- Figure 7.3 PFAS Testing Solution Providers: Distribution by Location of Headquarters
- Figure 7.4 PFAS Testing Solution Providers: Distribution by Type of Offering
- Figure 7.5 PFAS Testing Solution Providers: Distribution by Type of Testing Service Offered
- Figure 7.6 PFAS Testing Solution Providers: Distribution by Additional Service Offered
- Figure 7.7 PFAS Testing Solution Providers: Distribution by Type of Sample Tested
- Figure 7.8 PFAS Testing Solution Providers: Distribution by Type of PFAS Analyte Tested
- Figure 7.9 PFAS Testing Solution Providers: Distribution by Method / Testing Standard
- Figure 7.10 PFAS Testing Solution Providers: Distribution by End-user
- Figure 8.1 Company Competitiveness Analysis: Overview of Peer Group I
- Figure 8.2 Company Competitiveness Analysis: Overview of Peer Group II
- Figure 8.3 Company Competitiveness Analysis: Overview of Peer Group III
- Figure 8.4 Company Competitiveness Analysis: PFAS Testing Solution Providers based in North America
- Figure 8.5 Company Competitiveness Analysis: PFAS Testing Solution Providers based in Europe
- Figure 8.6 Company Competitiveness Analysis: PFAS Testing Solution Providers based in Asia-Pacific
- Figure 9.1 Agilent: Annual Revenues, Since 2021 (USD Billion)
- Figure 9.2 Danaher: Annual Revenues, Since 2021 (USD Billion)
- Figure 9.3 PerkinElmer: Annual Revenues, Since 2021 (USD Billion)
- Figure 9.4 Waters Corporation: Annual Revenues, Since 2021 (USD Billion)
- Figure 10.1 Biotage: Annual Revenues, Since 2021 (SEK Billion)
- Figure 10.2 Merck: Annual Revenues, Since 2021 (EUR Billion)
- Figure 10.3 Sartorius: Annual Revenues, Since 2021 (EUR Billion)
- Figure 11.1 Shimadzu: Annual Revenues, Since 2021 (JPY Billion)
- Figure 12.1 Partnerships and Collaborations: Cumulative Year-wise Trend, Since 2021
- Figure 12.2 Partnerships and Collaborations: Distribution by Type of Partnership
- Figure 12.3 Partnerships and Collaborations: Distribution by Year and Type of Partnership, Since 2021
- Figure 12.4 Partnerships and Collaborations: Distribution by Type of Partner
- Figure 12.5 Partnerships and Collaborations: Distribution by Type of Offering
- Figure 12.6 Partnerships and Collaborations: Distribution by Type of Sample Tested
- Figure 12.7 Most Active Players: Distribution by Number of Partnerships
- Figure 12.8 Partnerships and Collaborations: Distribution by Country
- Figure 12.9 Partnerships and Collaborations: Distribution by Region
- Figure 13.1 Recent Developments: Cumulative Year-wise Trend, Since 2021
- Figure 13.2 Recent Developments: Distribution by Type of Development
- Figure 13.3 Recent Developments: Distribution by Year and Type of Development, Since 2021
- Figure 13.4 Recent Developments: Distribution by Type of Sample Tested
- Figure 13.5 Recent Developments: Distribution by Testing Service Offered
- Figure 13.6 Recent Developments: Distribution by Method / Testing Standard
- Figure 13.7 Recent Developments: Distribution by End-user
- Figure 13.8 Most Active Players: Distribution by Number of Recent Developments
- Figure 13.9 Recent Developments: Distribution by Geography
- Figure 15.1 Global PFAS Testing Market, Historical Trends (Since 2022) and Forecasted Estimates (Till 2040) (USD Million)
- Figure 15.2 Global PFAS Testing Market, Forecasted Estimates (Till 2040): Conservative Scenario (USD Million)
- Figure 15.3 Global PFAS Testing Market, Forecasted Estimates (Till 2040): Optimistic Scenario (USD Million)
- Figure 16.1 PFAS Testing Market: Distribution by Type of Sample Tested
- Figure 16.2 PFAS Testing Market for Water Testing, Historical Trends (Since 2022) and Forecasted Estimates (Till 2040) (USD Million)
- Figure 16.3 PFAS Testing Market for Soil Testing, Historical Trends (Since 2022) and Forecasted Estimates (Till 2040) (USD Million)
- Figure 16.4 PFAS Testing Market for Food and Beverages Testing, Historical Trends (Since 2022) and Forecasted Estimates (Till 2040) (USD Million)
- Figure 16.5 PFAS Testing Market for Blood / Serum / Plasma Testing, Historical Trends (Since 2022) and Forecasted Estimates (Till 2040) (USD Million)
- Figure 16.6 PFAS Testing Market for Air Testing, Historical Trends (Since 2022) and Forecasted Estimates (Till 2040) (USD Million)
- Figure 17.1 PFAS Testing Market: Distribution by Type of Testing Service Offered
- Figure 17.2 PFAS Testing Market for Quantification, Historical Trends (Since 2022) and Forecasted Estimates (Till 2040) (USD Million)
- Figure 17.3 PFAS Testing Market for Screening, Historical Trends (Since 2022) and Forecasted Estimates (Till 2040) (USD Million)
- Figure 17.4 PFAS Testing Market for Extraction, Historical Trends (Since 2022) and Forecasted Estimates (Till 2040) (USD Million)
- Figure 18.1 PFAS Testing Market: Distribution by Type of PFAS Analyte Tested
- Figure 18.2 PFAS Testing Market for Perfluorooctanoic Acid, Historical Trends (Since 2022) and Forecasted Estimates (Till 2040) (USD Million)
- Figure 18.3 PFAS Testing Market for Perfluorooctane Sulfonic Acid, Historical Trends (Since 2022) and Forecasted Estimates (Till 2040) (USD Million)
- Figure 18.4 PFAS Testing Market for Perfluorohexane Sulfonate, Historical Trends (Since 2022) and Forecasted Estimates (Till 2040) (USD Million)
- Figure 18.5 PFAS Testing Market for Perfluorononanoic Acid, Historical Trends (Since 2022) and Forecasted Estimates (Till 2040) (USD Million)
- Figure 18.6 PFAS Testing Market for Other Analytes, Historical Trends (Since 2022) and Forecasted Estimates (Till 2040) (USD Million)
- Figure 19.1 PFAS Testing Market: Distribution by Type of Method / Testing Standard
- Figure 19.2 PFAS Testing Market for Environmental Protection Agency / United States Environmental Protection Agency (EPA), Historical Trends (Since 2022) and Forecasted Estimates (Till 2040) (USD Million)
- Figure 19.3 PFAS Testing Market for International Organization for Standardization (ISO), Historical Trends (Since 2022) and Forecasted Estimates (Till 2040) (USD Million)
- Figure 19.4 PFAS Testing Market for American Society for Testing and Materials (ASTM), Historical Trends (Since 2022) and Forecasted Estimates (Till 2040) (USD Million)
- Figure 19.5 PFAS Testing Market for Deutsches Institut fur Normung (DIN), Historical Trends (Since 2022) and Forecasted Estimates (Till 2040) (USD Million)
- Figure 19.6 PFAS Testing Market for Other Method / Testing Standards, Historical Trends (Since 2022) and Forecasted Estimates (Till 2040) (USD Million)
- Figure 20.1 PFAS Testing Market: Distribution by Type of Technology
- Figure 20.2 PFAS Testing Market for Liquid Chromatography-Mass Spectrometry (LC-MS), Historical Trends (Since 2022) and Forecasted Estimates (Till 2040) (USD Million)
- Figure 20.3 PFAS Testing Market for Gas Chromatography-Mass Spectrometry (GC-MS), Historical Trends (Since 2022) and Forecasted Estimates (Till 2040) (USD Million)
- Figure 20.4 PFAS Testing Market for Enzyme-Linked Immunosorbent Assay (ELISA), Historical Trends (Since 2022) and Forecasted Estimates (Till 2040) (USD Million)
- Figure 20.5 PFAS Testing Market for Nuclear Magnetic Resonance (NMR), Historical Trends (Since 2022) and Forecasted Estimates (Till 2040) (USD Million)
- Figure 20.6 PFAS Testing Market for Other Technologies, Historical Trends (Since 2022) and Forecasted Estimates (Till 2040) (USD Million)
- Figure 21.1 PFAS Testing Market: Distribution by End-user
- Figure 21.2 PFAS Testing Market for Pharmaceutical Companies, Historical Trends (Since 2022) and Forecasted Estimates (Till 2040) (USD Million)
- Figure 21.3 PFAS Testing Market for Environmental Scientists, Historical Trends (Since 2022) and Forecasted Estimates (Till 2040) (USD Million)
- Figure 21.4 PFAS Testing Market for Research Institutes, Historical Trends (Since 2022) and Forecasted Estimates (Till 2040) (USD Million)
- Figure 21.5 PFAS Testing Market for Government Agencies, Historical Trends (Since 2022) and Forecasted Estimates (Till 2040) (USD Million)
- Figure 21.6 PFAS Testing Market for Testing Laboratories, Historical Trends (Since 2022) and Forecasted Estimates (Till 2040) (USD Million)
- Figure 21.7 PFAS Testing Market for Other End-users, Historical Trends (Since 2022) and Forecasted Estimates (Till 2040) (USD Million)
- Figure 22.1 PFAS Testing Market: Distribution by Geographical Regions
- Figure 22.2 Market Movement Analysis
- Figure 22.3 Penetration-Growth (P-G) Matrix
- Figure 22.4 PFAS Testing Market in North America, Historical Trends (Since 2022) and Forecasted Estimates (Till 2040) (USD Million)
- Figure 22.5 PFAS Testing Market in the US, Historical Trends (Since 2022) and Forecasted Estimates (Till 2040) (USD Million)
- Figure 22.6 PFAS Testing Market in Canada, Historical Trends (Since 2022) and Forecasted Estimates (Till 2040) (USD Million)
- Figure 22.7 PFAS Testing Market in Europe, Historical Trends (Since 2022) and Forecasted Estimates (Till 2040) (USD Million)
- Figure 22.8 PFAS Testing Market in Germany, Historical Trends (Since 2022) and Forecasted Estimates (Till 2040) (USD Million)
- Figure 22.9 PFAS Testing Market in France, Historical Trends (Since 2022) and Forecasted Estimates (Till 2040) (USD Million)
- Figure 22.10 PFAS Testing Market in Spain, Historical Trends (Since 2022) and Forecasted Estimates (Till 2040) (USD Million)
- Figure 22.11 PFAS Testing Market in Italy, Historical Trends (Since 2022) and Forecasted Estimates (Till 2040) (USD Million)
- Figure 22.12 PFAS Testing Market in the UK, Historical Trends (Since 2022) and Forecasted Estimates (Till 2040) (USD Million)
- Figure 22.13 PFAS Testing Market in Asia-Pacific, Historical Trends (Since 2022) and Forecasted Estimates (Till 2040) (USD Million)
- Figure 22.14 PFAS Testing Market in China, Historical Trends (Since 2022) and Forecasted Estimates (Till 2040) (USD Million)
- Figure 22.15 PFAS Testing Market in Japan, Historical Trends (Since 2022) and Forecasted Estimates (Till 2040) (USD Million)
- Figure 22.16 PFAS Testing Market in South Korea, Historical Trends (Since 2022) and Forecasted Estimates (Till 2040) (USD Million)
- Figure 22.17 PFAS Testing Market in India, Historical Trends (Since 2022) and Forecasted Estimates (Till 2040) (USD Million)
- Figure 22.18 PFAS Testing Market in Australia, Historical Trends (Since 2022) and Forecasted Estimates (Till 2040) (USD Million)
- Figure 22.19 PFAS Testing Market in Middle East and North Africa, Historical Trends (Since 2022) and Forecasted Estimates (Till 2040) (USD Million)
- Figure 22.20 PFAS Testing Market in Saudi Arabia, Historical Trends (Since 2022) and Forecasted Estimates (Till 2040) (USD Million)
- Figure 22.21 PFAS Testing Market in Qatar, Historical Trends (Since 2022) and Forecasted Estimates (Till 2040) (USD Million)
- Figure 22.22 PFAS Testing Market in UAE, Historical Trends (Since 2022) and Forecasted Estimates (Till 2040) (USD Million)
- Figure 22.23 PFAS Testing Market in Latin America, Historical Trends (Since 2022) and Forecasted Estimates (Till 2040) (USD Million)
- Figure 22.24 PFAS Testing Market in Brazil, Historical Trends (Since 2022) and Forecasted Estimates (Till 2040) (USD Million)
- Figure 22.25 PFAS Testing Market in Argentina, Historical Trends (Since 2022) and Forecasted Estimates (Till 2040) (USD Million)
- Figure 23.1 PFAS Testing Market: Distribution by Leading Players
- Figure 24.1 Concluding Remarks: Market Landscape
- Figure 24.2 Concluding Remarks: Partnerships and Collaborations
- Figure 24.3 Concluding Remarks: Recent Developments
- Figure 24.4 Concluding Remarks: Market Forecast and Opportunity Analysis (I / II)
- Figure 24.5 Concluding Remarks: Market Forecast and Opportunity Analysis (II / II)
 PFAS檢測市場規模、佔有率和成長分析:按檢測類型、檢體類型、技術、應用、最終用戶和地區分類-2026-2033年產業預測
 PFAS檢測市場分析及預測(至2035年):類型、產品類型、服務、技術、應用、最終用戶、形式、組件、解決方案
 全球 PFAS 市場、PFAS 監管、PFAS 替代品及 PFAS 修復技術(2026-2036 年)
 全球 PFAS 處理市場:市場規模、佔有率和趨勢分析(按技術類型、最終用途行業和地區分類),細分市場預測(2025-2033 年)
 全球 PFAS過濾市場入口點 PFAS 處理系統市場規模、佔有率和趨勢分析報告:按技術、應用、地區和細分市場預測,2025 年至 2033 年
 入口點 PFAS 處理系統市場,規模,佔有率,趨勢,產業分析報告:各技術,各用途,各地區,2025年~2034年的市場預測美國入境點 PFAS 處理系統市場規模、佔有率、趨勢分析報告:按技術、應用和細分市場預測,2025-2033 年
 全球 PFAS、PFAS 替代品和 PFAS 處理市場(2025-2035 年)