


 |
市場調查報告書
商品編碼
1787838
DevOps市場:產業趨勢·全球預測 (~2035年):提供區分·部署模型·工具·產業·企業規模·各地區DevOps Market Till 2035: Distribution by Type of Offering, Type of Deployment Model, Type of Tools, Type of Industry Vertical, Company Size, and Key Geographical Regions: Industry Trends and Global Forecasts |
||||||
DevOps 市場:概覽
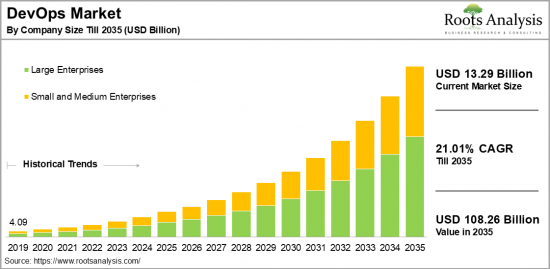
預計到 2035 年,全球 DevOps 市場規模將從目前的 132.9 億美元增長至 1082.6 億美元,預測期內複合年增長率為 21.01%。
DevOps市場機會:分類
提供區分
- 服務
- 解決方案
部署模型
- 混合雲端
- 私有雲端
- 公共雲端
工具
- 開發工具
- 運用工具
- 測試工具
產業
- BFSI
- 政府·公共機關
- 醫療保健
- 製造
- 零售
- 通訊·資訊技術服務(ITES)
- 其他
企業規模
- 大企業
- 中小企業
地區
- 北美
- 美國
- 加拿大
- 墨西哥
- 其他的北美各國
- 歐洲
- 奧地利
- 比利時
- 丹麥
- 法國
- 德國
- 愛爾蘭
- 義大利
- 荷蘭
- 挪威
- 俄羅斯
- 西班牙
- 瑞典
- 瑞士
- 英國
- 其他歐洲各國
- 亞洲
- 中國
- 印度
- 日本
- 新加坡
- 韓國
- 其他亞洲各國
- 南美
- 巴西
- 智利
- 哥倫比亞
- 委內瑞拉
- 其他的南美各國
- 中東·北非
- 埃及
- 伊朗
- 伊拉克
- 以色列
- 科威特
- 沙烏地阿拉伯
- 阿拉伯聯合大公國
- 其他的中東·北非各國
- 全球其他地區
- 澳洲
- 紐西蘭
- 其他的國家
DevOps 市場:成長與趨勢
DevOps 是一種將開發和營運原則結合的方法,旨在建立一個統一的框架來整合人員、流程和技術。其主要目標是與傳統方法相比,提高軟體開發和交付的速度、安全性和效率。 DevOps 源自於敏捷軟體開發方法,利用跨職能方法實現快速迭代的應用程式部署。這旨在縮短系統開發生命週期,同時保持持續交付並確保高品質的軟體。
全球 DevOps 市場正經歷顯著成長,這得益於企業內部對快速軟體交付和提升營運效率的需求不斷增長。 DevOps 是開發與營運的融合。它是一系列工具和實踐,將軟體開發和 IT 營運團隊整合在一起,從而提高軟體開發生命週期的速度和品質。預計這些因素將在預測期內推動 DevOps 市場的顯著成長。
本報告研究了全球 DevOps 市場,並提供了市場概況、背景、市場影響因素分析、市場規模趨勢和預測、按細分市場和地區進行的詳細分析、競爭格局以及主要公司的概況。
目錄
章節I:報告概要
第1章 序文
第2章 調查手法
第3章 市場動態
第4章 宏觀經濟指標
章節II:定性的洞察
第5章 摘要整理
第6章 簡介
第7章 法規Scenario
章節III:市場概要
第8章 主要企業的總括的資料庫
第9章 競爭情形
第10章 閒置頻段分析
第11章 企業的競爭力分析
第12章 DevOps市場上Start-Ups生態系統
章節IV:企業簡介
第13章 企業簡介
- 章概要
- Amazon Web Services
- Atlassian
- Broadcom
- CA Technologies
- Cisco Systems
- Cigniti Technologies
- Dell Technologies
- Docker
- EMC
- GitLab
- Hewlett Packard
- IBM
- Micro Focus International
- Microsoft
- Oracle
- Puppet
- Progress Chef Software
章節V:市場趨勢
第14章 大趨勢分析
第15章 未滿足需求的分析
第16章 專利分析
第17章 最近的趨勢
章節VI:市場機會分析
第18章 全球DevOps市場
第19章 各提供種類的市場機會
第20章 按部署模型的市場機會
第21章 各工具的市場機會
第22章 各產業的市場機會
第23章 DevOps的市場機會:北美
第24章 DevOps的市場機會:歐洲
第25章 DevOps的市場機會:亞洲
第26章 DevOps的市場機會:中東·北非
第27章 DevOps的市場機會:南美
第28章 DevOps的市場機會:全球其他地區
第29章 市場集中分析:主要企業的分佈
第30章 鄰近市場分析
章節VII:策略工具
第31章 勝利的關鍵策略
第32章 波特的五力分析
第33章 SWOT分析
第34章 價值鏈分析
第35章 ROOTS的策略建議
章節VIII:其他的獨家洞察
第36章 來自1次調查的洞察
第37章 報告書的結論
章節IX:附錄
第38章 表格形式資料
第39章 企業·團體一覽
第40章 客制化的機會
第41章 ROOTS訂閱服務
第42章 著者詳細內容
DevOps Market Overview
As per Roots Analysis, the global DevOps market size is estimated to grow from USD 13.29 billion in the current year to USD 108.26 billion by 2035, at a CAGR of 21.01% during the forecast period, till 2035.
The opportunity for devOps market has been distributed across the following segments:
Type of Offering
- Services
- Solutions
Type of Deployment Model
- Hybrid Cloud
- Private Cloud
- Public Cloud
Type of Tools
- Development Tools
- Operation Tools
- Testing Tools
Type of Industry Vertical
- BFSI
- Government and Public Sector
- Healthcare
- Manufacturing
- Retail
- Telecommunications and Information Technology Enabled Services (ITES)
- Others
Company Size
- Large Enterprises
- Small and Medium Enterprises
Geographical Regions
- North America
- US
- Canada
- Mexico
- Other North American countries
- Europe
- Austria
- Belgium
- Denmark
- France
- Germany
- Ireland
- Italy
- Netherlands
- Norway
- Russia
- Spain
- Sweden
- Switzerland
- UK
- Other European countries
- Asia
- China
- India
- Japan
- Singapore
- South Korea
- Other Asian countries
- Latin America
- Brazil
- Chile
- Colombia
- Venezuela
- Other Latin American countries
- Middle East and North Africa
- Egypt
- Iran
- Iraq
- Israel
- Kuwait
- Saudi Arabia
- UAE
- Other MENA countries
- Rest of the World
- Australia
- New Zealand
- Other countries
DEVOPS MARKET: GROWTH AND TRENDS
DevOps combines the principles of development and operations to establish a unified framework that integrates individuals, processes, and technology. Its main objective is to improve the speed, security, and efficiency of software development and delivery in comparison to conventional methods. Emerging from an agile software development approach, DevOps leverages a cross-functional strategy to facilitate rapid and iterative application deployment. It aims to shorten the system development lifecycle while maintaining continuous delivery and ensuring high-quality software.
The global market for DevOps is experiencing considerable expansion, driven by the increasing need for rapid software delivery and enhanced operational efficiency within organizations. As a blend of development and operations, DevOps comprises a collection of tools and practices intended to bring together software development and IT operations teams, ultimately improving both the speed and quality of the software development lifecycle. As a result, owing to these factors, the DevOps market is expected to experience significant growth during the forecast period.
DEVOPS MARKET: KEY SEGMENTS
Market Share by Type of Offering
Based on type of offering, the global devOps market is segmented into services and solutions. According to our estimates, currently, the services segment captures the majority share of the market. This can be attributed to the rising complexity of software development and the necessity for organizations to implement best practices in devOps. As companies aim to enhance their operational efficiency and hasten their software delivery processes, they frequently seek expert assistance in applying DevOps methodologies, which drives market expansion.
However, the solutions segment is expected to grow at a relatively higher CAGR during the forecast period. This increase is due to the growing dependence on automation and cloud-based DevOps platforms in software development.
Market Share by Type of Deployment Model
Based on type of deployment model, the devOps market is segmented into hybrid cloud, private cloud and public cloud. According to our estimates, currently, the public cloud segment captures the majority of the market. This can be attributed to its affordability, scalability, and accessibility. Organizations are showing a preference for public cloud solutions as they enable quick application deployment without the requirement of significant initial infrastructure investment.
However, the hybrid cloud segment is expected to grow at a relatively higher CAGR during the forecast period. This can be attributed to its capability to allow companies to keep sensitive data in a private environment while utilizing the scalability and flexibility of public cloud resources for less critical workloads.
Market Share by Type of Tools
Based on type of tools, the devOps market is segmented into development tools, operation tools, and testing tools. According to our estimates, currently, the development tools segment captures the majority share of the market. This can be attributed to the rising focus on improving collaboration and productivity among development teams. These tools support continuous integration and delivery (CI/CD), allowing developers to automate their workflows, manage code repositories, and optimize application deployment processes.
However, the testing tools segment is expected to grow at a relatively higher CAGR during the forecast period. This can be attributed to the heightened emphasis on quality and efficiency in software testing.
Market Share by Type of Industry Vertical
Based on type of industry vertical, the devOps market is segmented into BFSI, government and public sector, healthcare, manufacturing, retail, telecommunications and information technology enabled services (ITES) and others. According to our estimates, currently, the BFSI segment captures the majority share of the market. This growth can be attributed to the sector's essential requirement for swift software development and deployment in order to comply with regulatory requirements and improve customer service.
However, the healthcare industry is expected to grow at a relatively higher CAGR during the forecast period. This can be attributed to the rising demand for digital transformation within healthcare, including the implementation of electronic health records (EHR), telemedicine, and patient management systems.
Market Share by Company Size
Based on company size, the devOps market is segmented into large and small and medium enterprise. According to our estimates, currently, the large enterprise segment captures the majority share of the market. On the other hand, the small and medium enterprise segments are anticipated to experience a higher growth rate during the forecast period. This growth can be attributed to the adoption of devOps in businesses, their agility, innovation, focus on specialized markets, and their capability to adjust to evolving customer preferences and market dynamics..
Market Share by Geographical Regions
Based on geographical regions, the devOps market is segmented into North America, Europe, Asia, Latin America, Middle East and North Africa, and the rest of the world. According to our estimates, currently, North America captures the majority share of the market. However, the market in Asia is expected to grow at a higher CAGR during the forecast period. This growth can be attributed to the presence of large enterprises and multinational companies across various industries such as technology, finance, healthcare, and manufacturing. These businesses often face intricate IT landscapes and struggle with the management of extensive software applications and infrastructure.
Example Players in DevOps Market
- Amazon Web Services
- Atlassian
- Broadcom
- CA Technologies
- Cisco Systems
- Cigniti Technologies
- Dell Technologies
- Docker
- EMC
- GitLab
- Hewlett Packard
- IBM
- Micro Focus International
- Microsoft
- Oracle
- Puppet
- Progress Chef Software
- RapidValue
- Red Hat
- Splunk sS
DEVOPS MARKET: RESEARCH COVERAGE
The report on the DevOps market features insights on various sections, including:
- Market Sizing and Opportunity Analysis: An in-depth analysis of the devOps market, focusing on key market segments, including [A] type of offering, [B] type of deployment model, [C] type of tools, [D] type of industry vertical, [E] company size, and [F] key geographical regions.
- Competitive Landscape: A comprehensive analysis of the companies engaged in the devOps market, based on several relevant parameters, such as [A] year of establishment, [B] company size, [C] location of headquarters and [D] ownership structure.
- Company Profiles: Elaborate profiles of prominent players engaged in the devOps market, providing details on [A] location of headquarters, [B] company size, [C] company mission, [D] company footprint, [E] management team, [F] contact details, [G] financial information, [H] operating business segments, [I] devOps portfolio, [J] moat analysis, [K] recent developments, and an informed future outlook.
- Megatrends: An evaluation of ongoing megatrends in devOps industry.
- Patent Analysis: An insightful analysis of patents filed / granted in the devOps domain, based on relevant parameters, including [A] type of patent, [B] patent publication year, [C] patent age and [D] leading players.
- Recent Developments: An overview of the recent developments made in the devOps market, along with analysis based on relevant parameters, including [A] year of initiative, [B] type of initiative, [C] geographical distribution and [D] most active players.
- Porter's Five Forces Analysis: An analysis of five competitive forces prevailing in the devOps market, including threats of new entrants, bargaining power of buyers, bargaining power of suppliers, threats of substitute products and rivalry among existing competitors.
- SWOT Analysis: An insightful SWOT framework, highlighting the strengths, weaknesses, opportunities and threats in the domain. Additionally, it provides Harvey ball analysis, highlighting the relative impact of each SWOT parameter.
- Value Chain Analysis: A comprehensive analysis of the value chain, providing information on the different phases and stakeholders involved in the devOps market.
KEY QUESTIONS ANSWERED IN THIS REPORT
- How many companies are currently engaged in devOps market?
- Which are the leading companies in this market?
- What factors are likely to influence the evolution of this market?
- What is the current and future market size?
- What is the CAGR of this market?
- How is the current and future market opportunity likely to be distributed across key market segments?
REASONS TO BUY THIS REPORT
- The report provides a comprehensive market analysis, offering detailed revenue projections of the overall market and its specific sub-segments. This information is valuable to both established market leaders and emerging entrants.
- Stakeholders can leverage the report to gain a deeper understanding of the competitive dynamics within the market. By analyzing the competitive landscape, businesses can make informed decisions to optimize their market positioning and develop effective go-to-market strategies.
- The report offers stakeholders a comprehensive overview of the market, including key drivers, barriers, opportunities, and challenges. This information empowers stakeholders to stay abreast of market trends and make data-driven decisions to capitalize on growth prospects.
ADDITIONAL BENEFITS
- Complimentary Excel Data Packs for all Analytical Modules in the Report
- 15% Free Content Customization
- Detailed Report Walkthrough Session with Research Team
- Free Updated report if the report is 6-12 months old or older
TABLE OF CONTENTS
SECTION I: REPORT OVERVIEW
1. PREFACE
- 1.1. Introduction
- 1.2. Market Share Insights
- 1.3. Key Market Insights
- 1.4. Report Coverage
- 1.5. Key Questions Answered
- 1.6. Chapter Outlines
2. RESEARCH METHODOLOGY
- 2.1. Chapter Overview
- 2.2. Research Assumptions
- 2.3. Database Building
- 2.3.1. Data Collection
- 2.3.2. Data Validation
- 2.3.3. Data Analysis
- 2.4. Project Methodology
- 2.4.1. Secondary Research
- 2.4.1.1. Annual Reports
- 2.4.1.2. Academic Research Papers
- 2.4.1.3. Company Websites
- 2.4.1.4. Investor Presentations
- 2.4.1.5. Regulatory Filings
- 2.4.1.6. White Papers
- 2.4.1.7. Industry Publications
- 2.4.1.8. Conferences and Seminars
- 2.4.1.9. Government Portals
- 2.4.1.10. Media and Press Releases
- 2.4.1.11. Newsletters
- 2.4.1.12. Industry Databases
- 2.4.1.13. Roots Proprietary Databases
- 2.4.1.14. Paid Databases and Sources
- 2.4.1.15. Social Media Portals
- 2.4.1.16. Other Secondary Sources
- 2.4.2. Primary Research
- 2.4.2.1. Introduction
- 2.4.2.2. Types
- 2.4.2.2.1. Qualitative
- 2.4.2.2.2. Quantitative
- 2.4.2.3. Advantages
- 2.4.2.4. Techniques
- 2.4.2.4.1. Interviews
- 2.4.2.4.2. Surveys
- 2.4.2.4.3. Focus Groups
- 2.4.2.4.4. Observational Research
- 2.4.2.4.5. Social Media Interactions
- 2.4.2.5. Stakeholders
- 2.4.2.5.1. Company Executives (CXOs)
- 2.4.2.5.2. Board of Directors
- 2.4.2.5.3. Company Presidents and Vice Presidents
- 2.4.2.5.4. Key Opinion Leaders
- 2.4.2.5.5. Research and Development Heads
- 2.4.2.5.6. Technical Experts
- 2.4.2.5.7. Subject Matter Experts
- 2.4.2.5.8. Scientists
- 2.4.2.5.9. Doctors and Other Healthcare Providers
- 2.4.2.6. Ethics and Integrity
- 2.4.2.6.1. Research Ethics
- 2.4.2.6.2. Data Integrity
- 2.4.3. Analytical Tools and Databases
- 2.4.1. Secondary Research
3. MARKET DYNAMICS
- 3.1. Forecast Methodology
- 3.1.1. Top-Down Approach
- 3.1.2. Bottom-Up Approach
- 3.1.3. Hybrid Approach
- 3.2. Market Assessment Framework
- 3.2.1. Total Addressable Market (TAM)
- 3.2.2. Serviceable Addressable Market (SAM)
- 3.2.3. Serviceable Obtainable Market (SOM)
- 3.2.4. Currently Acquired Market (CAM)
- 3.3. Forecasting Tools and Techniques
- 3.3.1. Qualitative Forecasting
- 3.3.2. Correlation
- 3.3.3. Regression
- 3.3.4. Time Series Analysis
- 3.3.5. Extrapolation
- 3.3.6. Convergence
- 3.3.7. Forecast Error Analysis
- 3.3.8. Data Visualization
- 3.3.9. Scenario Planning
- 3.3.10. Sensitivity Analysis
- 3.4. Key Considerations
- 3.4.1. Demographics
- 3.4.2. Market Access
- 3.4.3. Reimbursement Scenarios
- 3.4.4. Industry Consolidation
- 3.5. Robust Quality Control
- 3.6. Key Market Segmentations
- 3.7. Limitations
4. MACRO-ECONOMIC INDICATORS
- 4.1. Chapter Overview
- 4.2. Market Dynamics
- 4.2.1. Time Period
- 4.2.1.1. Historical Trends
- 4.2.1.2. Current and Forecasted Estimates
- 4.2.2. Currency Coverage
- 4.2.2.1. Overview of Major Currencies Affecting the Market
- 4.2.2.2. Impact of Currency Fluctuations on the Industry
- 4.2.3. Foreign Exchange Impact
- 4.2.3.1. Evaluation of Foreign Exchange Rates and Their Impact on Market
- 4.2.3.2. Strategies for Mitigating Foreign Exchange Risk
- 4.2.4. Recession
- 4.2.4.1. Historical Analysis of Past Recessions and Lessons Learnt
- 4.2.4.2. Assessment of Current Economic Conditions and Potential Impact on the Market
- 4.2.5. Inflation
- 4.2.5.1. Measurement and Analysis of Inflationary Pressures in the Economy
- 4.2.5.2. Potential Impact of Inflation on the Market Evolution
- 4.2.6. Interest Rates
- 4.2.6.1. Overview of Interest Rates and Their Impact on the Market
- 4.2.6.2. Strategies for Managing Interest Rate Risk
- 4.2.7. Commodity Flow Analysis
- 4.2.7.1. Type of Commodity
- 4.2.7.2. Origins and Destinations
- 4.2.7.3. Values and Weights
- 4.2.7.4. Modes of Transportation
- 4.2.8. Global Trade Dynamics
- 4.2.8.1. Import Scenario
- 4.2.8.2. Export Scenario
- 4.2.9. War Impact Analysis
- 4.2.9.1. Russian-Ukraine War
- 4.2.9.2. Israel-Hamas War
- 4.2.10. COVID Impact / Related Factors
- 4.2.10.1. Global Economic Impact
- 4.2.10.2. Industry-specific Impact
- 4.2.10.3. Government Response and Stimulus Measures
- 4.2.10.4. Future Outlook and Adaptation Strategies
- 4.2.11. Other Indicators
- 4.2.11.1. Fiscal Policy
- 4.2.11.2. Consumer Spending
- 4.2.11.3. Gross Domestic Product (GDP)
- 4.2.11.4. Employment
- 4.2.11.5. Taxes
- 4.2.11.6. R&D Innovation
- 4.2.11.7. Stock Market Performance
- 4.2.11.8. Supply Chain
- 4.2.11.9. Cross-Border Dynamics
- 4.2.1. Time Period
SECTION II: QUALITATIVE INSIGHTS
5. EXECUTIVE SUMMARY
6. INTRODUCTION
- 6.1. Chapter Overview
- 6.2. Overview of DevOps Market
- 6.2.1. Type of Offering
- 6.2.2. Type of Deployment Model
- 6.2.3. Type of Tools
- 6.2.4. Type of Industry Verticals
- 6.3. Future Perspective
7. REGULATORY SCENARIO
SECTION III: MARKET OVERVIEW
8. COMPREHENSIVE DATABASE OF LEADING PLAYERS
9. COMPETITIVE LANDSCAPE
- 9.1. Chapter Overview
- 9.2. DevOps: Overall Market Landscape
- 9.2.1. Analysis by Year of Establishment
- 9.2.2. Analysis by Company Size
- 9.2.3. Analysis by Location of Headquarters
- 9.2.4. Analysis by Ownership Structure
10. WHITE SPACE ANALYSIS
11. COMPANY COMPETITIVENESS ANALYSIS
12. STARTUP ECOSYSTEM IN THE DEVOPS MARKET
- 12.1. DevOps Market: Market Landscape of Startups
- 12.1.1. Analysis by Year of Establishment
- 12.1.2. Analysis by Company Size
- 12.1.3. Analysis by Company Size and Year of Establishment
- 12.1.4. Analysis by Location of Headquarters
- 12.1.5. Analysis by Company Size and Location of Headquarters
- 12.1.6. Analysis by Ownership Structure
- 12.2. Key Findings
SECTION IV: COMPANY PROFILES
13. COMPANY PROFILES
- 13.1. Chapter Overview
- 13.2. Amazon Web Services*
- 13.2.1. Company Overview
- 13.2.2. Company Mission
- 13.2.3. Company Footprint
- 13.2.4. Management Team
- 13.2.5. Contact Details
- 13.2.6. Financial Performance
- 13.2.7. Operating Business Segments
- 13.2.8. Service / Product Portfolio (project specific)
- 13.2.9. MOAT Analysis
- 13.2.10. Recent Developments and Future Outlook
- 13.3. Atlassian
- 13.4. Broadcom
- 13.5. CA Technologies
- 13.6. Cisco Systems
- 13.7. Cigniti Technologies
- 13.8. Dell Technologies
- 13.9. Docker
- 13.10. EMC
- 13.11. GitLab
- 13.12. Google
- 13.13. Hewlett Packard
- 13.14. IBM
- 13.15. Micro Focus International
- 13.16. Microsoft
- 13.17. Oracle
- 13.18. Puppet
- 13.19. Progress Chef Software
SECTION V: MARKET TRENDS
14. MEGA TRENDS ANALYSIS
15. UNMET NEED ANALYSIS
16. PATENT ANALYSIS
17. RECENT DEVELOPMENTS
- 17.1. Chapter Overview
- 17.2. Recent Funding
- 17.3. Recent Partnerships
- 17.4. Other Recent Initiatives
SECTION VI: MARKET OPPORTUNITY ANALYSIS
18. GLOBAL DEVOPS MARKET
- 18.1. Chapter Overview
- 18.2. Key Assumptions and Methodology
- 18.3. Trends Disruption Impacting Market
- 18.4. Demand Side Trends
- 18.5. Supply Side Trends
- 18.6. Global DevOps market, Historical Trends (Since 2019) and Forecasted Estimates (Till 2035)
- 18.7. Multivariate Scenario Analysis
- 18.7.1. Conservative Scenario
- 18.7.2. Optimistic Scenario
- 18.8. Investment Feasibility Index
- 18.9. Key Market Segmentations
19. MARKET OPPORTUNITIES BASED ON TYPE OF OFFERING
- 19.1. Chapter Overview
- 19.2. Key Assumptions and Methodology
- 19.3. Revenue Shift Analysis
- 19.4. Market Movement Analysis
- 19.5. Penetration-Growth (P-G) Matrix
- 19.6. DevOps Market for Services: Historical Trends (Since 2019) and Forecasted Estimates (Till 2035)
- 19.7. DevOps Market for Solutions: Historical Trends (Since 2019) and Forecasted Estimates (Till 2035)
- 19.8. Data Triangulation and Validation
- 19.8.1. Secondary Sources
- 19.8.2. Primary Sources
- 19.8.3. Statistical Modeling
20. MARKET OPPORTUNITIES BASED ON TYPE OF DEPLOYMENT MODEL
- 20.1. Chapter Overview
- 20.2. Key Assumptions and Methodology
- 20.3. Revenue Shift Analysis
- 20.4. Market Movement Analysis
- 20.5. Penetration-Growth (P-G) Matrix
- 20.6. DevOps Market for Hybrid Cloud: Historical Trends (Since 2019) and Forecasted Estimates (Till 2035)
- 20.7. DevOps Market for Private Cloud: Historical Trends (Since 2019) and Forecasted Estimates (Till 2035)
- 20.8. DevOps Market for Public Cloud: Historical Trends (Since 2019) and Forecasted Estimates (Till 2035)
- 20.9. Data Triangulation and Validation
- 20.9.1. Secondary Sources
- 20.9.2. Primary Sources
- 20.9.3. Statistical Modeling
21. MARKET OPPORTUNITIES BASED ON TYPE OF TOOLS
- 21.1. Chapter Overview
- 21.2. Key Assumptions and Methodology
- 21.3. Revenue Shift Analysis
- 21.4. Market Movement Analysis
- 21.5. Penetration-Growth (P-G) Matrix
- 21.6. DevOps Market for Development Tools: Historical Trends (Since 2019) and Forecasted Estimates (Till 2035)
- 21.7. DevOps Market for Operation Tools: Historical Trends (Since 2019) and Forecasted Estimates (Till 2035)
- 21.8. DevOps Market for Testing Tools: Historical Trends (Since 2019) and Forecasted Estimates (Till 2035)
- 21.9. Data Triangulation and Validation
- 21.9.1. Secondary Sources
- 21.9.2. Primary Sources
- 21.9.3. Statistical Modeling
22. MARKET OPPORTUNITIES BASED ON TYPE OF INUDUSTRY VERTICAL
- 22.1. Chapter Overview
- 22.2. Key Assumptions and Methodology
- 22.3. Revenue Shift Analysis
- 22.4. Market Movement Analysis
- 22.5. Penetration-Growth (P-G) Matrix
- 22.6. DevOps Market for BFSI: Historical Trends (Since 2019) and Forecasted Estimates (Till 2035)
- 22.7. DevOps Market for Government and Public Sector: Historical Trends (Since 2019) and Forecasted Estimates (Till 2035)
- 22.8. DevOps Market for Healthcare: Historical Trends (Since 2019) and Forecasted Estimates (Till 2035)
- 22.9. DevOps Market for Manufacturing: Historical Trends (Since 2019) and Forecasted Estimates (Till 2035)
- 22.10. DevOps Market for Retail: Historical Trends (Since 2019) and Forecasted Estimates (Till 2035)
- 22.11. DevOps Market for Telecommunications and Information Technology Enabled Services (ITES): Historical Trends (Since 2019) and Forecasted Estimates (Till 2035)
- 22.12. DevOps Market for Others: Historical Trends (Since 2019) and Forecasted Estimates (Till 2035)
- 22.13. Data Triangulation and Validation
- 22.13.1. Secondary Sources
- 22.13.2. Primary Sources
- 22.13.3. Statistical Modeling
23. MARKET OPPORTUNITIES FOR DEVOPS IN NORTH AMERICA
- 23.1. Chapter Overview
- 23.2. Key Assumptions and Methodology
- 23.3. Revenue Shift Analysis
- 23.4. Market Movement Analysis
- 23.5. Penetration-Growth (P-G) Matrix
- 23.6. DevOps Market in North America: Historical Trends (Since 2019) and Forecasted Estimates (Till 2035)
- 23.6.1. DevOps Market in the US: Historical Trends (Since 2019) and Forecasted Estimates (Till 2035)
- 23.6.2. DevOps Market in Canada: Historical Trends (Since 2019) and Forecasted Estimates (Till 2035)
- 23.6.3. DevOps Market in Mexico: Historical Trends (Since 2019) and Forecasted Estimates (Till 2035)
- 23.6.4. DevOps Market in Other North American Countries: Historical Trends (Since 2019) and Forecasted Estimates (Till 2035)
- 23.7. Data Triangulation and Validation
24. MARKET OPPORTUNITIES FOR DEVOPS IN EUROPE
- 24.1. Chapter Overview
- 24.2. Key Assumptions and Methodology
- 24.3. Revenue Shift Analysis
- 24.4. Market Movement Analysis
- 24.5. Penetration-Growth (P-G) Matrix
- 24.6. DevOps Market in Europe: Historical Trends (Since 2019) and Forecasted Estimates (Till 2035)
- 24.6.1. DevOps Market in Austria: Historical Trends (Since 2019) and Forecasted Estimates (Till 2035)
- 24.6.2. DevOps Market in Belgium: Historical Trends (Since 2019) and Forecasted Estimates (Till 2035)
- 24.6.3. DevOps Market in Denmark: Historical Trends (Since 2019) and Forecasted Estimates (Till 2035)
- 24.6.4. DevOps Market in France: Historical Trends (Since 2019) and Forecasted Estimates (Till 2035)
- 24.6.5. DevOps Market in Germany: Historical Trends (Since 2019) and Forecasted Estimates (Till 2035)
- 24.6.6. DevOps Market in Ireland: Historical Trends (Since 2019) and Forecasted Estimates (Till 2035)
- 24.6.7. DevOps Market in Italy: Historical Trends (Since 2019) and Forecasted Estimates (Till 2035)
- 24.6.8. DevOps Market in Netherlands: Historical Trends (Since 2019) and Forecasted Estimates (Till 2035)
- 24.6.9. DevOps Market in Norway: Historical Trends (Since 2019) and Forecasted Estimates (Till 2035)
- 24.6.10. DevOps Market in Russia: Historical Trends (Since 2019) and Forecasted Estimates (Till 2035)
- 24.6.11. DevOps Market in Spain: Historical Trends (Since 2019) and Forecasted Estimates (Till 2035)
- 24.6.12. DevOps Market in Sweden: Historical Trends (Since 2019) and Forecasted Estimates (Till 2035)
- 24.6.13. DevOps Market in Sweden: Historical Trends (Since 2019) and Forecasted Estimates (Till 2035)
- 24.6.14. DevOps Market in Switzerland: Historical Trends (Since 2019) and Forecasted Estimates (Till 2035)
- 24.6.15. DevOps Market in the UK: Historical Trends (Since 2019) and Forecasted Estimates (Till 2035)
- 24.6.16. DevOps Market in Other European Countries: Historical Trends (Since 2019) and Forecasted Estimates (Till 2035)
- 24.7. Data Triangulation and Validation
25. MARKET OPPORTUNITIES FOR DEVOPS IN ASIA
- 25.1. Chapter Overview
- 25.2. Key Assumptions and Methodology
- 25.3. Revenue Shift Analysis
- 25.4. Market Movement Analysis
- 25.5. Penetration-Growth (P-G) Matrix
- 25.6. DevOps Market in Asia: Historical Trends (Since 2019) and Forecasted Estimates (Till 2035)
- 25.6.1. DevOps Market in China: Historical Trends (Since 2019) and Forecasted Estimates (Till 2035)
- 25.6.2. DevOps Market in India: Historical Trends (Since 2019) and Forecasted Estimates (Till 2035)
- 25.6.3. DevOps Market in Japan: Historical Trends (Since 2019) and Forecasted Estimates (Till 2035)
- 25.6.4. DevOps Market in Singapore: Historical Trends (Since 2019) and Forecasted Estimates (Till 2035)
- 25.6.5. DevOps Market in South Korea: Historical Trends (Since 2019) and Forecasted Estimates (Till 2035)
- 25.6.6. DevOps Market in Other Asian Countries: Historical Trends (Since 2019) and Forecasted Estimates (Till 2035)
- 25.7. Data Triangulation and Validation
26. MARKET OPPORTUNITIES FOR DEVOPS IN MIDDLE EAST AND NORTH AFRICA (MENA)
- 26.1. Chapter Overview
- 26.2. Key Assumptions and Methodology
- 26.3. Revenue Shift Analysis
- 26.4. Market Movement Analysis
- 26.5. Penetration-Growth (P-G) Matrix
- 26.6. DevOps Market in Middle East and North Africa (MENA): Historical Trends (Since 2019) and Forecasted Estimates (Till 2035)
- 26.6.1. DevOps Market in Egypt: Historical Trends (Since 2019) and Forecasted Estimates (Till 205)
- 26.6.2. DevOps Market in Iran: Historical Trends (Since 2019) and Forecasted Estimates (Till 2035)
- 26.6.3. DevOps Market in Iraq: Historical Trends (Since 2019) and Forecasted Estimates (Till 2035)
- 26.6.4. DevOps Market in Israel: Historical Trends (Since 2019) and Forecasted Estimates (Till 2035)
- 26.6.5. DevOps Market in Kuwait: Historical Trends (Since 2019) and Forecasted Estimates (Till 2035)
- 26.6.6. DevOps Market in Saudi Arabia: Historical Trends (Since 2019) and Forecasted Estimates (Till 2035)
- 26.6.7. DevOps Market in United Arab Emirates (UAE): Historical Trends (Since 2019) and Forecasted Estimates (Till 2035)
- 26.6.8. DevOps Market in Other MENA Countries: Historical Trends (Since 2019) and Forecasted Estimates (Till 2035)
- 26.7. Data Triangulation and Validation
27. MARKET OPPORTUNITIES FOR DEVOPS IN LATIN AMERICA
- 27.1. Chapter Overview
- 27.2. Key Assumptions and Methodology
- 27.3. Revenue Shift Analysis
- 27.4. Market Movement Analysis
- 27.5. Penetration-Growth (P-G) Matrix
- 27.6. DevOps Market in Latin America: Historical Trends (Since 2019) and Forecasted Estimates (Till 2035)
- 27.6.1. DevOps Market in Argentina: Historical Trends (Since 2019) and Forecasted Estimates (Till 2035)
- 27.6.2. DevOps Market in Brazil: Historical Trends (Since 2019) and Forecasted Estimates (Till 2035)
- 27.6.3. DevOps Market in Chile: Historical Trends (Since 2019) and Forecasted Estimates (Till 2035)
- 27.6.4. DevOps Market in Colombia Historical Trends (Since 2019) and Forecasted Estimates (Till 2035)
- 27.6.5. DevOps Market in Venezuela: Historical Trends (Since 2019) and Forecasted Estimates (Till 2035)
- 27.6.6. DevOps Market in Other Latin American Countries: Historical Trends (Since 2019) and Forecasted Estimates (Till 2035)
- 27.7. Data Triangulation and Validation
28. MARKET OPPORTUNITIES FOR DEVOPS IN REST OF THE WORLD
- 28.1. Chapter Overview
- 28.2. Key Assumptions and Methodology
- 28.3. Revenue Shift Analysis
- 28.4. Market Movement Analysis
- 28.5. Penetration-Growth (P-G) Matrix
- 28.6. DevOps Market in Rest of the World: Historical Trends (Since 2019) and Forecasted Estimates (Till 2035)
- 28.6.1. DevOps Market in Australia: Historical Trends (Since 2019) and Forecasted Estimates (Till 2035)
- 28.6.2. DevOps Market in New Zealand: Historical Trends (Since 2019) and Forecasted Estimates (Till 2035)
- 28.6.3. DevOps Market in Other Countries
- 28.7. Data Triangulation and Validation
29. MARKET CONCENTRATION ANALYSIS: DISTRIBUTION BY LEADING PLAYERS
- 29.1. Leading Player 1
- 29.2. Leading Player 2
- 29.3. Leading Player 3
- 29.4. Leading Player 4
- 29.5. Leading Player 5
- 29.6. Leading Player 6
- 29.7. Leading Player 7
- 29.8. Leading Player 8
30. ADJACENT MARKET ANALYSIS
SECTION VII: STRATEGIC TOOLS
31. KEY WINNING STRATEGIES
32. PORTER'S FIVE FORCES ANALYSIS
33. SWOT ANALYSIS
34. VALUE CHAIN ANALYSIS
35. ROOTS STRATEGIC RECOMMENDATIONS
- 35.1. Chapter Overview
- 35.2. Key Business-related Strategies
- 35.2.1. Research & Development
- 35.2.2. Product Manufacturing
- 35.2.3. Commercialization / Go-to-Market
- 35.2.4. Sales and Marketing
- 35.3. Key Operations-related Strategies
- 35.3.1. Risk Management
- 35.3.2. Workforce
- 35.3.3. Finance
- 35.3.4. Others
SECTION VIII: OTHER EXCLUSIVE INSIGHTS
36. INSIGHTS FROM PRIMARY RESEARCH
37. REPORT CONCLUSION
SECTION IX: APPENDIX
38. TABULATED DATA
39. LIST OF COMPANIES AND ORGANIZATIONS
40. CUSTOMIZATION OPPORTUNITIES
41. ROOTS SUBSCRIPTION SERVICES
42. AUTHOR DETAILS
 DevOps 市場:2026-2032 年全球市場預測(依企業規模、部署模式、服務類型、產業和組件分類)
 DevOps市場規模、佔有率、趨勢和預測:按類型、部署模型、組織規模、工具、產業和地區分類,2026-2034年
 DevOps 市場分析及預測(至 2035 年):按類型、產品、服務、技術、組件、應用、部署、最終用戶、功能和階段分類
 2026年全球DevOps市場報告2026年全球DevOps自動化工具市場報告2026年全球生成式人工智慧開發與維運(DevOps)市場報告DevOps自動化工具市場分析及預測(至2035年):按類型、產品類型、服務、技術、組件、應用、部署類型、最終用戶和功能分類
 全球開發營運市場規模、佔有率、趨勢及成長分析報告(2026-2034)
 DevOps市場-全球產業規模、佔有率、趨勢、機會及預測(依產品、部署方式、組織規模、產業、地區及競爭格局分類,2021-2031年)日本DevOps市場報告(按類型、部署模式、組織規模、工具、產業垂直領域和地區分類,2026-2034年)