


 |
市場調查報告書
商品編碼
1771419
全像顯示器市場:產業趨勢及全球預測(~2035年):依產品類型、應用、技術類型、公司類型及主要地區Holographic Display Market Till 2035: Industry Trends and Global Forecasts: Distribution by Type of Offering, Areas of Application, Type of Technology, Type of Enterprise and Key Geographical Regions |
||||||
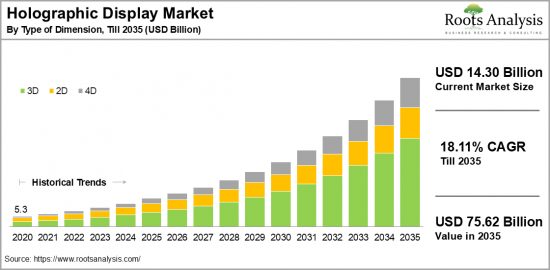
預計到2035年,全球全像顯示市場規模將從目前的143億美元成長至 756.2億美元,預測期內年複合成長率為 18.11%。
全像顯示的市場機會:依細分市場
依元件類型
- 數位千分尺
- 鏡頭
- 光源調變器
- 顯示器
- 投影機和攝影機
- 掃描儀
- 其他
依技術類型
- 電子全像
- 雷射等離子顯示器
- 活塞式
- 半透明
- 可觸摸
依尺寸類型
- 2D
- 3D
- 4D
依應用
- 商業
- 消費
- 國防
- 工業
- 醫療
- 其他
依地區
- 北美
- 美國
- 加拿大
- 墨西哥
- 其他北美美洲
- 歐洲
- 奧地利
- 比利時
- 丹麥
- 法國
- 德國
- 愛爾蘭 印度
- 義大利
- 荷蘭
- 挪威
- 俄羅斯
- 西班牙
- 瑞典
- 瑞士
- 英國
- 其他歐洲國家
- 亞洲
- 中國
- 印度
- 日本
- 新加坡
- 韓國
- 其他亞洲國家
- 拉丁美洲
- 巴西
- 智利
- 哥倫比亞
- 委內瑞拉
- 其他拉丁美洲國家
- 中東和北非
- 埃及
- 伊朗
- 伊拉克
- 以色列
- 科威特
- 沙烏地阿拉伯
- 阿拉伯聯合大公國
- 其他中東和北非國家
- 世界其他地區
- 澳洲
- 紐西蘭
- 其他國家
全像顯示市場:成長與趨勢
全像顯示是一種先進的螢幕技術,它利用光線創造看似存在於空間中的3D影像和視覺效果。該技術允許觀眾從各個角度觀察和體驗3D內容,而無需佩戴特殊眼鏡或設備。
市面上有各種類型的顯示器,例如反射式、透射式和互動式顯示器,每種類型都可滿足特定需求並具有廣泛的應用範圍。由於全像顯示具有沉浸式視覺體驗、寬視角和增強互動性等顯著優勢,因此在各行各業都備受歡迎。因此,全像技術對消費者互動有著巨大的影響,企業利用全像技術打造令人難忘的品牌體驗,並在競爭日益激烈的市場中脫穎而出。尤其是醫學影像領域,它被定位為推動該技術發展的最重要應用。
此外,作為未來視覺顯示技術的趨勢,全像技術預計將繼續快速發展。許多產業參與者正積極參與與人工智慧(AI)和擴增實境(AR)等先進技術相結合的高級應用的研發,並期待進一步提升用戶體驗。基於上述因素,全像顯示市場預計在預測期內將大幅成長。
本報告調查了全球全像顯示市場,並總結了市場概況、背景、市場影響因素分析、市場規模趨勢及預測、各細分市場和地區的詳細分析、競爭態勢以及主要公司概況。
目錄
第一部分:報告概述
第1章 引言
第2章 研究方法
第3章 市場動態
第4章 宏觀經濟指標
第二部分:定性洞察
第5章 執行摘要
第6章 引言
第7章 監理情境
第三部分:市場概況
第8章 關鍵資料綜合資料庫參與者
第9章 競爭格局
第10章 空白領域分析
第11章 競爭分析
第12章 全像顯示市場的新創企業生態系
第四部分:公司簡介
第13章 公司簡介
- 章節概述
- AFC Technology
- AV Concepts
- DisplAir
- Envisics
- EON Reality
- Holotech
- Holoxica
- HYPERVSN
- Konica Minolta
- Microsoft
- NICE System
- Leia Display System
- MDH Hologram
- NITTO DENKO
- Provision Holdings
- Qualcomm
- RealView Imaging
- ViewSonic
- VividQ
- Zebra Imaging
第五部分:市場趨勢
第14章 大趨勢分析
第15章 未滿足的需求分析
第16章 專利分析
第17章 近期趨勢
第六節:市場機會分析
第18章 全球全像顯示市場
第19章 依組件類型的市場機會
第20章 依技術類型的機會
第21章 依尺寸類型的機會
第22章 依應用的機會
第23章 北美全像顯示機會
第24章 歐洲全像顯示機會
第25章 亞洲全像顯示機會
第26章 中東與北非全像顯示機會顯示器
第27章 拉丁美洲全像顯示機會
第28章 鄰近市場分析
第七部分:策略工具
第29章 勝利策略
第30章 波特五力分析
第31章 SWOT分析
第32章 價值鏈分析
第33章 ROOTS策略建議
第八部分:其他獨家見解
第34章 一手資料研究洞察
第35章 報告結論
第九節:附錄
第36章 表格資料
第37章 公司與組織清單
第38章 客製化機會
第39章 ROOTS 訂閱服務
第40章 作者詳情
Holographic Display Market Overview
As per Roots Analysis, the global holographic display market size is estimated to grow from USD 14.30 billion in the current year to USD 75.62 billion by 2035, at a CAGR of 18.11% during the forecast period, till 2035.
The opportunity for holographic display market has been distributed across the following segments:
Type of Component
- Digital Micrometer
- Lens
- Light Modulator
- Monitor
- Projectors & Camera
- Scanner
- Others
Type of Technology
- Electro-Holographic
- Laser Plasma Displays
- Piston
- Semi-Transparent
- Touchable
Type of Dimension
- 2D
- 3D
- 4D
Type of Application
- Commercial
- Consumer
- Defense
- Industrial Application
- Medical
- Other
Geographical Regions
- North America
- US
- Canada
- Mexico
- Other North American countries
- Europe
- Austria
- Belgium
- Denmark
- France
- Germany
- Ireland
- Italy
- Netherlands
- Norway
- Russia
- Spain
- Sweden
- Switzerland
- UK
- Other European countries
- Asia
- China
- India
- Japan
- Singapore
- South Korea
- Other Asian countries
- Latin America
- Brazil
- Chile
- Colombia
- Venezuela
- Other Latin American countries
- Middle East and North Africa
- Egypt
- Iran
- Iraq
- Israel
- Kuwait
- Saudi Arabia
- UAE
- Other MENA countries
- Rest of the World
- Australia
- New Zealand
- Other countries
HOLOGRAPHIC DISPLAY MARKET: GROWTH AND TRENDS
A holographic display refers to a sophisticated type of screen that generates three-dimensional (3D) images or visuals by controlling light to make them appear as if they occupy real space. This technology enables viewers to observe and engage with 3D content from various angles without the need for special glasses or devices.
The market features a range of displays, including reflection-based, transmission-based, and interactive options that cater to specific needs and broaden their usability. Further, their remarkable benefits in immersive visualization, expansive viewing angles, and improved interactivity are driving demand across various sectors. Consequently, the influence of holographic displays on consumer interaction is significant, and businesses are utilizing holography to create unforgettable brand experiences that differentiate them in an increasingly saturated market. Nevertheless, medical imaging remains the foremost application propelling the industry forward.
It is worth highlighting that future trends in visual display technology indicate that holography will continue to advance swiftly. An increasing number of industry stakeholders are committing to research and development for more advanced applications that involve artificial intelligence and augmented reality, further enhancing user experiences. Owing to above-mentioned factors, the holographic displays market is projected to experience significant growth during the forecast period.
HOLOGRAPHIC DISPLAY MARKET: KEY SEGMENTS
Market Share by Type of Component
Based on type of component, the global holographic display market is segmented into digital micrometers, lenses, light modulators, monitors, projectors & cameras, scanners, and others. According to our estimates, currently, lens segment captures the majority share of the market. This can be attributed to its ability to deliver image clarity and focus, ensuring accurate image formation in holographic displays.
However, the light modulator segment is anticipated to experience a relatively higher CAGR during the forecast period. This growth can be attributed to the crucial function of light modulators in manipulating light waves to generate holographic images, making them a fundamental component of holographic display technology.
Market Share by Type of Technology
Based on type of technology, the holographic display market is segmented into electro-holographic, laser plasma displays, piston, semi-transparent, and touchable. According to our estimates, currently, electro-holographic segment captures the majority of the market. This can be attributed to its superior 3D visualization, which offers enhanced depth, clarity, and resolution when compared to alternative technologies.
On the other hand, laser plasma displays are becoming more popular in the market and are expected to witness significant CAGR during the forecast period, owing to its capability to create authentic 3D images and its growing application in medical and scientific visualizations.
Market Share by Type of Dimension
Based on type of dimension, the holographic display market is segmented into 2D, 3D, and 4D. According to our estimates, currently, 3D segment captures the majority share of the market. The realistic and lifelike visualizations offered by 3D holographic displays make them more captivating and effective for use in entertainment, healthcare, and retail sectors. Consequently, the increasing demand for immersive experiences with holographic displays is likely to support the expansion of 3D displays.
Market Share by Type of Application
Based on type of application, the holographic display market is segmented into commercial, consumer, defense, industrial applications, medical, and others. According to our estimates, currently, medical applications segment captures the majority share of the market. This can be attributed to the increasing applications of holographic displays within the healthcare industry. The rising use of advanced technology has heightened the demand for state-of-the-art imaging equipment, such as holographic displays. These displays provide detailed, real-time 3D representations of organs, tissues, and surgical procedures. Their enhanced capabilities in improving diagnostics, surgical accuracy, and patient outcomes are likely to continue driving market demand.
However, the commercial sector is projected to grow at a higher compound annual growth rate (CAGR) during this forecast period. This can be attributed to the utilization of these displays in a variety of applications, including digital signage, product showcases, and immersive brand storytelling in stores and malls.
Market Share by Geographical Regions
Based on geographical regions, the holographic display market is segmented into North America, Europe, Asia, Latin America, Middle East and North Africa, and the rest of the world. According to our estimates, currently, North America captures the majority share of the market. This can be attributed to the robust consumer electronics sector and the well-established media and entertainment industry.
Meanwhile, Asia is projected to achieve the highest compound annual growth rate (CAGR) during this forecast period. This can be attributed to the consumer electronics centers in China, Japan, and South Korea. The highest levels of production and consumption of consumer electronics, particularly through the integration of holographic technologies in smartphones, tablets, and wearables, are fueling the growth of this market in Asia.
Example Players in Holographic Display Market
- AFC Technology
- AV Concepts
- DisplAir
- Envisics
- EON Reality
- Holotech
- Holoxica
- HYPERVSN
- Konica Minolta
- Leia Display System
- MDH Hologram
- NITTO DENKO
- Provision Holdings
- Qualcomm
- Realfiction
- RealView Imaging
- ViewSonic
- VividQ
- Zebra Imaging
HOLOGRAPHIC DISPLAY MARKET: RESEARCH COVERAGE
The report on the holographic display market features insights on various sections, including:
- Market Sizing and Opportunity Analysis: An in-depth analysis of the holographic display market, focusing on key market segments, including [A] type of offering, [B] areas of application, [C] type of technology, [D] type of enterprise and [E] key geographical regions
- Competitive Landscape: A comprehensive analysis of the companies engaged in the holographic display market, based on several relevant parameters, such as [A] year of establishment, [B] company size, [C] location of headquarters and [D] ownership structure.
- Company Profiles: Elaborate profiles of prominent players engaged in the holographic display market, providing details on [A] location of headquarters, [B] company size, [C] company mission, [D] company footprint, [E] management team, [F] contact details, [G] financial information, [H] operating business segments, [I] service / product portfolio, [J] moat analysis, [K] recent developments, and an informed future outlook.
- Megatrends: An evaluation of ongoing megatrends in the holographic display industry.
- Patent Analysis: An insightful analysis of patents filed / granted in the holographic display domain, based on relevant parameters, including [A] type of patent, [B] patent publication year, [C] patent age and [D] leading players.
- Recent Developments: An overview of the recent developments made in the holographic display market, along with analysis based on relevant parameters, including [A] year of initiative, [B] type of initiative, [C] geographical distribution and [D] most active players.
- Porter's Five Forces Analysis: An analysis of five competitive forces prevailing in the holographic display market, including threats of new entrants, bargaining power of buyers, bargaining power of suppliers, threats of substitute products and rivalry among existing competitors.
- SWOT Analysis: An insightful SWOT framework, highlighting the strengths, weaknesses, opportunities and threats in the domain. Additionally, it provides Harvey ball analysis, highlighting the relative impact of each SWOT parameter.
KEY QUESTIONS ANSWERED IN THIS REPORT
- How many companies are currently engaged in holographic display market?
- Which are the leading companies in this market?
- What factors are likely to influence the evolution of this market?
- What is the current and future market size?
- What is the CAGR of this market?
- How is the current and future market opportunity likely to be distributed across key market segments?
REASONS TO BUY THIS REPORT
- The report provides a comprehensive market analysis, offering detailed revenue projections of the overall market and its specific sub-segments. This information is valuable to both established market leaders and emerging entrants.
- Stakeholders can leverage the report to gain a deeper understanding of the competitive dynamics within the market. By analyzing the competitive landscape, businesses can make informed decisions to optimize their market positioning and develop effective go-to-market strategies.
- The report offers stakeholders a comprehensive overview of the market, including key drivers, barriers, opportunities, and challenges. This information empowers stakeholders to stay abreast of market trends and make data-driven decisions to capitalize on growth prospects.
ADDITIONAL BENEFITS
- Complimentary Excel Data Packs for all Analytical Modules in the Report
- 15% Free Content Customization
- Detailed Report Walkthrough Session with Research Team
- Free Updated report if the report is 6-12 months old or older
TABLE OF CONTENTS
SECTION I: REPORT OVERVIEW
1. PREFACE
- 1.1. Introduction
- 1.2. Market Share Insights
- 1.3. Key Market Insights
- 1.4. Report Coverage
- 1.5. Key Questions Answered
- 1.6. Chapter Outlines
2. RESEARCH METHODOLOGY
- 2.1. Chapter Overview
- 2.2. Research Assumptions
- 2.3. Database Building
- 2.3.1. Data Collection
- 2.3.2. Data Validation
- 2.3.3. Data Analysis
- 2.4. Project Methodology
- 2.4.1. Secondary Research
- 2.4.1.1. Annual Reports
- 2.4.1.2. Academic Research Papers
- 2.4.1.3. Company Websites
- 2.4.1.4. Investor Presentations
- 2.4.1.5. Regulatory Filings
- 2.4.1.6. White Papers
- 2.4.1.7. Industry Publications
- 2.4.1.8. Conferences and Seminars
- 2.4.1.9. Government Portals
- 2.4.1.10. Media and Press Releases
- 2.4.1.11. Newsletters
- 2.4.1.12. Industry Databases
- 2.4.1.13. Roots Proprietary Databases
- 2.4.1.14. Paid Databases and Sources
- 2.4.1.15. Social Media Portals
- 2.4.1.16. Other Secondary Sources
- 2.4.2. Primary Research
- 2.4.2.1. Introduction
- 2.4.2.2. Types
- 2.4.2.2.1. Qualitative
- 2.4.2.2.2. Quantitative
- 2.4.2.3. Advantages
- 2.4.2.4. Techniques
- 2.4.2.4.1. Interviews
- 2.4.2.4.2. Surveys
- 2.4.2.4.3. Focus Groups
- 2.4.2.4.4. Observational Research
- 2.4.2.4.5. Social Media Interactions
- 2.4.2.5. Stakeholders
- 2.4.2.5.1. Company Executives (CXOs)
- 2.4.2.5.2. Board of Directors
- 2.4.2.5.3. Company Presidents and Vice Presidents
- 2.4.2.5.4. Key Opinion Leaders
- 2.4.2.5.5. Research and Development Heads
- 2.4.2.5.6. Technical Experts
- 2.4.2.5.7. Subject Matter Experts
- 2.4.2.5.8. Scientists
- 2.4.2.5.9. Doctors and Other Healthcare Providers
- 2.4.2.6. Ethics and Integrity
- 2.4.2.6.1. Research Ethics
- 2.4.2.6.2. Data Integrity
- 2.4.3. Analytical Tools and Databases
- 2.4.1. Secondary Research
3. MARKET DYNAMICS
- 3.1. Forecast Methodology
- 3.1.1. Top-Down Approach
- 3.1.2. Bottom-Up Approach
- 3.1.3. Hybrid Approach
- 3.2. Market Assessment Framework
- 3.2.1. Total Addressable Market (TAM)
- 3.2.2. Serviceable Addressable Market (SAM)
- 3.2.3. Serviceable Obtainable Market (SOM)
- 3.2.4. Currently Acquired Market (CAM)
- 3.3. Forecasting Tools and Techniques
- 3.3.1. Qualitative Forecasting
- 3.3.2. Correlation
- 3.3.3. Regression
- 3.3.4. Time Series Analysis
- 3.3.5. Extrapolation
- 3.3.6. Convergence
- 3.3.7. Forecast Error Analysis
- 3.3.8. Data Visualization
- 3.3.9. Scenario Planning
- 3.3.10. Sensitivity Analysis
- 3.4. Key Considerations
- 3.4.1. Demographics
- 3.4.2. Market Access
- 3.4.3. Reimbursement Scenarios
- 3.4.4. Industry Consolidation
- 3.5. Robust Quality Control
- 3.6. Key Market Segmentations
- 3.7. Limitations
4. MACRO-ECONOMIC INDICATORS
- 4.1. Chapter Overview
- 4.2. Market Dynamics
- 4.2.1. Time Period
- 4.2.1.1. Historical Trends
- 4.2.1.2. Current and Forecasted Estimates
- 4.2.2. Currency Coverage
- 4.2.2.1. Overview of Major Currencies Affecting the Market
- 4.2.2.2. Impact of Currency Fluctuations on the Industry
- 4.2.3. Foreign Exchange Impact
- 4.2.3.1. Evaluation of Foreign Exchange Rates and Their Impact on Market
- 4.2.3.2. Strategies for Mitigating Foreign Exchange Risk
- 4.2.4. Recession
- 4.2.4.1. Historical Analysis of Past Recessions and Lessons Learnt
- 4.2.4.2. Assessment of Current Economic Conditions and Potential Impact on the Market
- 4.2.5. Inflation
- 4.2.5.1. Measurement and Analysis of Inflationary Pressures in the Economy
- 4.2.5.2. Potential Impact of Inflation on the Market Evolution
- 4.2.6. Interest Rates
- 4.2.6.1. Overview of Interest Rates and Their Impact on the Market
- 4.2.6.2. Strategies for Managing Interest Rate Risk
- 4.2.7. Commodity Flow Analysis
- 4.2.7.1. Type of Commodity
- 4.2.7.2. Origins and Destinations
- 4.2.7.3. Values and Weights
- 4.2.7.4. Modes of Transportation
- 4.2.8. Global Trade Dynamics
- 4.2.8.1. Import Scenario
- 4.2.8.2. Export Scenario
- 4.2.9. War Impact Analysis
- 4.2.9.1. Russian-Ukraine War
- 4.2.9.2. Israel-Hamas War
- 4.2.10. COVID Impact / Related Factors
- 4.2.10.1. Global Economic Impact
- 4.2.10.2. Industry-specific Impact
- 4.2.10.3. Government Response and Stimulus Measures
- 4.2.10.4. Future Outlook and Adaptation Strategies
- 4.2.11. Other Indicators
- 4.2.11.1. Fiscal Policy
- 4.2.11.2. Consumer Spending
- 4.2.11.3. Gross Domestic Product (GDP)
- 4.2.11.4. Employment
- 4.2.11.5. Taxes
- 4.2.11.6. R&D Innovation
- 4.2.11.7. Stock Market Performance
- 4.2.11.8. Supply Chain
- 4.2.11.9. Cross-Border Dynamics
- 4.2.1. Time Period
SECTION II: QUALITATIVE INSIGHTS
5. EXECUTIVE SUMMARY
6. INTRODUCTION
- 6.1. Chapter Overview
- 6.2. Overview of Holographic Display Market
- 6.2.1. Type of Component
- 6.2.2. Type of Technology
- 6.2.3. Type of Dimension
- 6.2.4. Type of Application
- 6.3. Future Perspective
7. REGULATORY SCENARIO
SECTION III: MARKET OVERVIEW
8. COMPREHENSIVE DATABASE OF LEADING PLAYERS
9. COMPETITIVE LANDSCAPE
- 9.1. Chapter Overview
- 9.2. Holographic Display: Overall Market Landscape
- 9.2.1. Analysis by Year of Establishment
- 9.2.2. Analysis by Company Size
- 9.2.3. Analysis by Location of Headquarters
- 9.2.4. Analysis by Ownership Structure
10. WHITE SPACE ANALYSIS
11. COMPANY COMPETITIVENESS ANALYSIS
12. STARTUP ECOSYSTEM IN THE HOLOGRAPHIC DISPLAY MARKET
- 12.1. Holographic Display: Market Landscape of Startups
- 12.1.1. Analysis by Year of Establishment
- 12.1.2. Analysis by Company Size
- 12.1.3. Analysis by Company Size and Year of Establishment
- 12.1.4. Analysis by Location of Headquarters
- 12.1.5. Analysis by Company Size and Location of Headquarters
- 12.1.6. Analysis by Ownership Structure
- 12.2. Key Findings
SECTION IV: COMPANY PROFILES
13. COMPANY PROFILES
- 13.1. Chapter Overview
- 13.2. AFC Technology*
- 13.2.1. Company Overview
- 13.2.2. Company Mission
- 13.2.3. Company Footprint
- 13.2.4. Management Team
- 13.2.5. Contact Details
- 13.2.6. Financial Performance
- 13.2.7. Operating Business Segments
- 13.2.8. Service / Product Portfolio (project specific)
- 13.2.9. MOAT Analysis
- 13.2.10. Recent Developments and Future Outlook
- 13.3. AV Concepts
- 13.4. DisplAir
- 13.5. Envisics
- 13.6. EON Reality
- 13.7. Holotech
- 13.8. Holoxica
- 13.9. HYPERVSN
- 13.10. Konica Minolta
- 13.11. Microsoft
- 13.12. NICE System
- 13.13. Leia Display System
- 13.14. MDH Hologram
- 13.15. NITTO DENKO
- 13.16. Provision Holdings
- 13.17. Qualcomm
- 13.18. RealView Imaging
- 13.19. ViewSonic
- 13.20. VividQ
- 13.21. Zebra Imaging
SECTION V: MARKET TRENDS
14. MEGA TRENDS ANALYSIS
15. UNMET NEED ANALYSIS
16. PATENT ANALYSIS
17. RECENT DEVELOPMENTS
- 17.1. Chapter Overview
- 17.2. Recent Funding
- 17.3. Recent Partnerships
- 17.4. Other Recent Initiatives
SECTION VI: MARKET OPPORTUNITY ANALYSIS
18. GLOBAL HOLOGRAPHIC DISPLAY MARKET
- 18.1. Chapter Overview
- 18.2. Key Assumptions and Methodology
- 18.3. Trends Disruption Impacting Market
- 18.4. Demand Side Trends
- 18.5. Supply Side Trends
- 18.6. Global Holographic Display Market, Historical Trends (Since 2020) and Forecasted Estimates (Till 2035)
- 18.7. Multivariate Scenario Analysis
- 18.7.1. Conservative Scenario
- 18.7.2. Optimistic Scenario
- 18.8. Investment Feasibility Index
- 18.9. Key Market Segmentations
19. MARKET OPPORTUNITIES BASED ON TYPE OF COMPONENT
- 19.1. Chapter Overview
- 19.2. Key Assumptions and Methodology
- 19.3. Revenue Shift Analysis
- 19.4. Market Movement Analysis
- 19.5. Penetration-Growth (P-G) Matrix
- 19.6. Holographic Display Market for Digital Micrometer: Historical Trends (Since 2020) and Forecasted Estimates (Till 2035)
- 19.7. Holographic Display Market for Lense: Historical Trends (Since 2020) and Forecasted Estimates (Till 2035)
- 19.8. Holographic Display Market for Light Modulators: Historical Trends (Since 2020) and Forecasted Estimates (Till 2035)
- 19.9. Holographic Display Market for Monitor: Historical Trends (Since 2020) and Forecasted Estimates (Till 2035)
- 19.10. Holographic Display Market for Projectors & Camera: Historical Trends (Since 2020) and Forecasted Estimates (Till 2035)
- 19.11. Holographic Display Market for Scanner: Historical Trends (Since 2020) and Forecasted Estimates (Till 2035)
- 19.12. Holographic Display Market for Other: Historical Trends (Since 2020) and Forecasted Estimates (Till 2035)
- 19.13. Data Triangulation and Validation
- 19.13.1. Secondary Sources
- 19.13.2. Primary Sources
- 19.13.3. Statistical Modeling
20. MARKET OPPORTUNITIES BASED ON TYPE OF TECHNOLOGY
- 20.1. Chapter Overview
- 20.2. Key Assumptions and Methodology
- 20.3. Revenue Shift Analysis
- 20.4. Market Movement Analysis
- 20.5. Penetration-Growth (P-G) Matrix
- 20.6. Holographic Display Market for Electro-Holographic: Historical Trends (Since 2020) and Forecasted Estimates (Till 2035)
- 20.7. Holographic Display Market for Laser Plasma Displays: Historical Trends (Since 2020) and Forecasted Estimates (Till 2035)
- 20.8. Holographic Display Market for Piston: Historical Trends (Since 2020) and Forecasted Estimates (Till 2035)
- 20.9. Holographic Display Market for Semi-Transparent: Historical Trends (Since 2020) and Forecasted Estimates (Till 2035)
- 20.10. Holographic Display Market for Touchable: Historical Trends (Since 2020) and Forecasted Estimates (Till 2035)
- 20.11. Data Triangulation and Validation
- 20.11.1. Secondary Sources
- 20.11.2. Primary Sources
- 20.11.3. Statistical Modeling
21. MARKET OPPORTUNITIES BASED ON TYPE OF DIMENSION
- 21.1. Chapter Overview
- 21.2. Key Assumptions and Methodology
- 21.3. Revenue Shift Analysis
- 21.4. Market Movement Analysis
- 21.5. Penetration-Growth (P-G) Matrix
- 21.6. Holographic Display Market for 2D: Historical Trends (Since 2020) and Forecasted Estimates (Till 2035)
- 21.7. Holographic Display Market for 3D: Historical Trends (Since 2020) and Forecasted Estimates (Till 2035)
- 21.8. Holographic Display Market for 4D: Historical Trends (Since 2020) and Forecasted Estimates (Till 2035)
- 21.9. Data Triangulation and Validation
- 21.9.1. Secondary Sources
- 21.9.2. Primary Sources
- 21.9.3. Statistical Modeling
22. MARKET OPPORTUNITIES BASED ON TYPE OF APPLICATION
- 22.1. Chapter Overview
- 22.2. Key Assumptions and Methodology
- 22.3. Revenue Shift Analysis
- 22.4. Market Movement Analysis
- 22.5. Penetration-Growth (P-G) Matrix
- 22.6. Holographic Display Market for Commercial: Historical Trends (Since 2020) and Forecasted Estimates (Till 2035)
- 22.7. Holographic Display Market for Consumer: Historical Trends (Since 2020) and Forecasted Estimates (Till 2035)
- 22.8. Holographic Display Market for Defense: Historical Trends (Since 2020) and Forecasted Estimates (Till 2035)
- 22.9. Holographic Display Market for Industrial Application: Historical Trends (Since 2020) and Forecasted Estimates (Till 2035)
- 22.10. Holographic Display Market for Medical: Historical Trends (Since 2020) and Forecasted Estimates (Till 2035)
- 22.11. Holographic Display Market for Other: Historical Trends (Since 2020) and Forecasted Estimates (Till 2035)
- 22.12. Data Triangulation and Validation
- 22.12.1. Secondary Sources
- 22.12.2. Primary Sources
- 22.12.3. Statistical Modeling
23. MARKET OPPORTUNITIES FOR HOLOGRAPHIC DISPLAY IN NORTH AMERICA
- 23.1. Chapter Overview
- 23.2. Key Assumptions and Methodology
- 23.3. Revenue Shift Analysis
- 23.4. Market Movement Analysis
- 23.5. Penetration-Growth (P-G) Matrix
- 23.6. Holographic Display Market in North America: Historical Trends (Since 2020) and Forecasted Estimates (Till 2035)
- 23.6.1. Holographic Display Market in the US: Historical Trends (Since 2020) and Forecasted Estimates (Till 2035)
- 23.6.2. Holographic Display Market in Canada: Historical Trends (Since 2020) and Forecasted Estimates (Till 2035)
- 23.6.3. Holographic Display Market in Mexico: Historical Trends (Since 2020) and Forecasted Estimates (Till 2035)
- 23.6.4. Holographic Display Market in Other North American Countries: Historical Trends (Since 2020) and Forecasted Estimates (Till 2035)
- 23.7. Data Triangulation and Validation
24. MARKET OPPORTUNITIES FOR HOLOGRAPHIC DISPLAY IN EUROPE
- 24.1. Chapter Overview
- 24.2. Key Assumptions and Methodology
- 24.3. Revenue Shift Analysis
- 24.4. Market Movement Analysis
- 24.5. Penetration-Growth (P-G) Matrix
- 24.6. Holographic Display Market in Europe: Historical Trends (Since 2020) and Forecasted Estimates (Till 2035)
- 24.6.1. Holographic Display Market in Austria: Historical Trends (Since 2020) and Forecasted Estimates (Till 2035)
- 24.6.2. Holographic Display Market in Belgium: Historical Trends (Since 2020) and Forecasted Estimates (Till 2035)
- 24.6.3. Holographic Display Market in Denmark: Historical Trends (Since 2020) and Forecasted Estimates (Till 2035)
- 24.6.4. Holographic Display Market in France: Historical Trends (Since 2020) and Forecasted Estimates (Till 2035)
- 24.6.5. Holographic Display Market in Germany: Historical Trends (Since 2020) and Forecasted Estimates (Till 2035)
- 24.6.6. Holographic Display Market in Ireland: Historical Trends (Since 2020) and Forecasted Estimates (Till 2035)
- 24.6.7. Holographic Display Market in Italy: Historical Trends (Since 2020) and Forecasted Estimates (Till 2035)
- 24.6.8. Holographic Display Market in Netherlands: Historical Trends (Since 2020) and Forecasted Estimates (Till 2035)
- 24.6.9. Holographic Display Market in Norway: Historical Trends (Since 2020) and Forecasted Estimates (Till 2035)
- 24.6.10. Holographic Display Market in Russia: Historical Trends (Since 2020) and Forecasted Estimates (Till 2035)
- 24.6.11. Holographic Display Market in Spain: Historical Trends (Since 2020) and Forecasted Estimates (Till 2035)
- 24.6.12. Holographic Display Market in Sweden: Historical Trends (Since 2020) and Forecasted Estimates (Till 2035)
- 24.6.13. Holographic Display Market in Sweden: Historical Trends (Since 2020) and Forecasted Estimates (Till 2035)
- 24.6.14. Holographic Display Market in Switzerland: Historical Trends (Since 2020) and Forecasted Estimates (Till 2035)
- 24.6.15. Holographic Display Market in the UK: Historical Trends (Since 2020) and Forecasted Estimates (Till 2035)
- 24.6.16. Holographic Display Market in Other European Countries: Historical Trends (Since 2020) and Forecasted Estimates (Till 2035)
- 24.7. Data Triangulation and Validation
25. MARKET OPPORTUNITIES FOR HOLOGRAPHIC DISPLAY IN ASIA
- 25.1. Chapter Overview
- 25.2. Key Assumptions and Methodology
- 25.3. Revenue Shift Analysis
- 25.4. Market Movement Analysis
- 25.5. Penetration-Growth (P-G) Matrix
- 25.6. Holographic Display Market in Asia: Historical Trends (Since 2020) and Forecasted Estimates (Till 2035)
- 25.6.1. Holographic Display Market in China: Historical Trends (Since 2020) and Forecasted Estimates (Till 2035)
- 25.6.2. Holographic Display Market in India: Historical Trends (Since 2020) and Forecasted Estimates (Till 2035)
- 25.6.3. Holographic Display Market in Japan: Historical Trends (Since 2020) and Forecasted Estimates (Till 2035)
- 25.6.4. Holographic Display Market in Singapore: Historical Trends (Since 2020) and Forecasted Estimates (Till 2035)
- 25.6.5. Holographic Display Market in South Korea: Historical Trends (Since 2020) and Forecasted Estimates (Till 2035)
- 25.6.6. Holographic Display Market in Other Asian Countries: Historical Trends (Since 2020) and Forecasted Estimates (Till 2035)
- 25.7. Data Triangulation and Validation
26. MARKET OPPORTUNITIES FOR HOLOGRAPHIC DISPLAY IN MIDDLE EAST AND NORTH AFRICA (MENA)
- 26.1. Chapter Overview
- 26.2. Key Assumptions and Methodology
- 26.3. Revenue Shift Analysis
- 26.4. Market Movement Analysis
- 26.5. Penetration-Growth (P-G) Matrix
- 26.6. Holographic Display Market in Middle East and North Africa (MENA): Historical Trends (Since 2020) and Forecasted Estimates (Till 2035)
- 26.6.1. Holographic Display Market in Egypt: Historical Trends (Since 2020) and Forecasted Estimates (Till 205)
- 26.6.2. Holographic Display Market in Iran: Historical Trends (Since 2020) and Forecasted Estimates (Till 2035)
- 26.6.3. Holographic Display Market in Iraq: Historical Trends (Since 2020) and Forecasted Estimates (Till 2035)
- 26.6.4. Holographic Display Market in Israel: Historical Trends (Since 2020) and Forecasted Estimates (Till 2035)
- 26.6.5. Holographic Display Market in Kuwait: Historical Trends (Since 2020) and Forecasted Estimates (Till 2035)
- 26.6.6. Holographic Display Market in Saudi Arabia: Historical Trends (Since 2020) and Forecasted Estimates (Till 2035)
- 26.6.7. Neuromorphic Computing Marke in United Arab Emirates (UAE): Historical Trends (Since 2020) and Forecasted Estimates (Till 2035)
- 26.6.8. Holographic Display Market in Other MENA Countries: Historical Trends (Since 2020) and Forecasted Estimates (Till 2035)
- 26.7. Data Triangulation and Validation
27. MARKET OPPORTUNITIES FOR HOLOGRAPHIC DISPLAY IN LATIN AMERICA
- 27.1. Chapter Overview
- 27.2. Key Assumptions and Methodology
- 27.3. Revenue Shift Analysis
- 27.4. Market Movement Analysis
- 27.5. Penetration-Growth (P-G) Matrix
- 27.6. Holographic Display Market in Latin America: Historical Trends (Since 2020) and Forecasted Estimates (Till 2035)
- 27.6.1. Holographic Display Market in Argentina: Historical Trends (Since 2020) and Forecasted Estimates (Till 2035)
- 27.6.2. Holographic Display Market in Brazil: Historical Trends (Since 2020) and Forecasted Estimates (Till 2035)
- 27.6.3. Holographic Display Market in Chile: Historical Trends (Since 2020) and Forecasted Estimates (Till 2035)
- 27.6.4. Holographic Display Market in Colombia Historical Trends (Since 2020) and Forecasted Estimates (Till 2035)
- 27.6.5. Holographic Display Market in Venezuela: Historical Trends (Since 2020) and Forecasted Estimates (Till 2035)
- 27.6.6. Holographic Display Market in Other Latin American Countries: Historical Trends (Since 2020) and Forecasted Estimates (Till 2035)
- 27.7. Data Triangulation and Validation
28. ADJACENT MARKET ANALYSIS
SECTION VII: STRATEGIC TOOLS
29. KEY WINNING STRATEGIES
30. PORTER'S FIVE FORCES ANALYSIS
31. SWOT ANALYSIS
32. VALUE CHAIN ANALYSIS
33. ROOTS STRATEGIC RECOMMENDATIONS
SECTION VIII: OTHER EXCLUSIVE INSIGHTS
34. INSIGHTS FROM PRIMARY RESEARCH
35. REPORT CONCLUSION
SECTION IX: APPENDIX
36. TABULATED DATA
37. LIST OF COMPANIES AND ORGANIZATIONS
38. CUSTOMIZATION OPPORTUNITIES
39. ROOTS SUBSCRIPTION SERVICES
40. AUTHOR DETAILS
 全像顯示器市場:按顯示類型、影像尺寸、技術和應用分類的全球市場預測 – 2026-2032 年
 2026年全球觸控全像顯示器市場報告2026年全球3D全像市場報告汽車全像顯示器市場:按組件、尺寸、解析度類型、技術類型、顯示器尺寸、應用、車輛類型、銷售管道類型分類,全球預測,2026-2032年
 全像顯示市場分析及至2035年預測:按類型、產品、技術、組件、應用、材料類型、設備、製程、最終用戶及安裝類型分類
 全球全像顯示器市場規模、佔有率、趨勢和成長分析報告(2026-2034年)2026年全像顯示器市場報告
 全像顯示器市場規模、佔有率和成長分析(按組件、產品、技術、尺寸、應用和地區分類)—2026-2033年產業預測
 全像顯示器市場-全球產業規模、佔有率、趨勢、機會和預測,按產品類型、技術、最終用戶、地區和競爭格局分類,2020-2030年預測
 全像顯示市場報告(按組件、技術、尺寸、應用、最終用戶和地區)2025-2033