


 |
市場調查報告書
商品編碼
1771305
藥物機械設備組合產品市場:產業趨勢及全球預測-依設備類型、服務重點、公司規模及主要地區Drug Device Combination Products Market: Industry Trends and Global Forecasts - Distribution by Type of Device, Service Focus Area, Company Size, and Key Geographical Regions |
||||||
全球藥物機械設備組合產品市場:成長與趨勢
不遵守處方藥物治療是一個重大問題,它不僅對患者的健康產生負面影響,也加重了整個製藥業的負擔。根據Contract Pharma最近報道,不遵守處方藥物治療估計每年給藥物開發商造成的損失超過 2500億美元。此外,缺乏有效的解決方案來在目標給藥部位持續或控制釋放活性藥物成分(API),仍然是藥物傳輸領域的一大挑戰。事實上,API 的釋放控制不佳會導致藥物血漿濃度波動,並引發各種副作用。這導致患者對有效藥物輸送治療方案的需求日益增加。
值得注意的是,近年來,組合產品的開發引起了製藥公司的濃厚興趣。這些產品整合了兩種或多種受FDA監管的成分,以實現活性藥物成分的控釋。然而,開發藥械組合產品是一個複雜且耗時的過程,需要創新技術、大量投資和專業知識。其他挑戰包括確保藥械相容性、滿足用戶要求、進行放行測試以及遵守製造和包裝標準。為了克服這些障礙並改善患者治療效果,許多開發人員現在將關鍵工作外包給提供組合產品測試和驗證服務的專業公司。
全球藥械組合產品市場:關鍵洞察
本報告分析了全球藥械組合產品市場的現狀,並揭示了潛在的成長機會。主要調查結果包括:
- 目前,全球有超過 25 家公司為各種藥械組合產品提供開發和測試服務。
- 服務提供者聲稱擁有為各種組合產品提供廣泛服務所需的專業知識。
- 大多數支援藥物輸送裝置/系統開發和測試的公司(超過 85%)總部位於北美。
- 超過 45%的服務供應商支援組合產品的效能測試和產品開發,其中 40%為大型/超大型公司。
- 大約 75%的組合產品服務提供者進行製程開發和驗證,例如 BS、EKG Labs、Exponent 和 Surpass。
- 為了在這個競爭激烈的行業中保持領先地位,服務提供者不斷努力升級其現有的服務產品。
- 為了滿足不斷成長的需求,許多公司透過建立新設施(約40%)或擴大現有產能(約50%)來擴展其服務組合。
- 大多數擴張措施均由美國的組合產品服務提供者實施,例如DDL、NAMSA和Nelson Labs。
- 大多數擴張措施都是為了滿足日益成長的組合產品相關測試服務需求。
- 大多數報告的擴張都是本地擴張,但一些美國公司也在進行國際擴張。
- 目前,已有超過210種已開發或開發的複方製劑產品,用於治療各種臨床適應症。這些複方製劑產品可用於腸外給藥和非腸外給藥。
- 公司擁有一系列已開發/開發的用於各種治療領域的複方製劑產品,其中大多數產品接受生物製劑給藥評估。
- 目前開發的大多數(約80%)大容量WI複方製劑產品用於基礎劑量給藥。
- 相當一部分(33%)大容量WI複方製劑產品用於治療神經系統疾病,例如D-mine®幫浦和ND0701。
- 超過90%的預充式注射器複方製劑產品已開發或開發用於生物製劑給藥。
- 預計複方製劑產品開發商將與服務提供者建立策略聯盟,以開發和測試他們自己的複方製劑產品。
- 提供獨特的框架,讓開發人員可以根據智力資本決定是外包製造還是內部製造。
- 隨著組合產品需求的不斷成長,預計未來十年相關服務提供者市場將以穩定的年化率成長。
參與藥械組合產品市場的公司
- EKG LABS
- Eurofins Medical Device Testing
- Exponent
- Kymanox
- Medical Engineering Technologies
- Pace Analytical Services
- Suttons Creek
- West Pharmaceutical Services
本報告調查全球藥械組合產品市場,提供市場概述,以及依設備類型、服務重點、公司規模和地區的趨勢,和參與市場的公司簡介。
目錄
第1章 前言
第2章 執行摘要
第3章 導論
- 章節概述
- 組合產品簡介
- 開發組合產品的挑戰
- 外包組合產品營運/服務
- 外包組合產品營運的優勢
- 選擇CDMO時的關鍵考量因素
- 未來展望
第4章 組合產品服務提供者:市場格局
- 章節概述
- 組合產品服務提供者:市場格局
第5章 競爭格局分析
- 章節概述
- 假設/關鍵參數
- 研究方法
- 組合產品服務提供者:競爭力分析
第6章 組合產品服務提供者:公司簡介
- 章節概述
- EKG LABS
- Eurofins Medical Device Testing
- Exponent
- Kymanox
- Medical Engineering Technologies
- Pace Analytical Services
- Suttons Creek
- West Pharmaceutical Services
- 結論:產業參與者的努力
第7章 近期擴張
第8章 案例研究:大容量穿戴式注射器與預灌封注射器組合產品
- 章節概述
- 大容量穿戴式注射器組合產品
- 預灌封注射器組合產品
第9章 潛在夥伴分析
- 章節概述
- 大容量穿戴式注射器組合產品
- 預灌封注射器組合產品
第10章 外包:GO/NO-GO框架
- 章節概述
- 外包:Go/No-Go框架
- 預灌封注射器組合產品開發商:Go/No-Go框架
第11章 市場預測
- 第概述
- 關鍵假設與預測研究方法
- 2035年全球組合產品服務供應商市場
- 全球組合產品服務供應商市場:依設備類型
- 全球組合產品服務提供者市場:依服務重點領域
- 全球組合產品服務供應商市場:依公司規模
- 全球組合產品服務提供者市場:依地區
第12章 結論
第13章 高層洞察
第14章 附錄1:表格資料
第15章 附錄2:公司與組織清單
GLOBAL DRUG DEVICE COMBINATION PRODUCTS MARKET: GROWTH AND TRENDS
Non-adherence to prescribed medication regimens is a significant issue that not only negatively impacts patient health but also increases the overall burden on the pharmaceutical industry. As recently reported by Contract Pharma, medication non-adherence is estimated to cost drug developers over USD 250 billion each year. Additionally, the lack of effective solutions for sustained or controlled release of active pharmaceutical ingredients (APIs) at targeted delivery sites remains a major challenge in drug delivery. In fact, inadequate control over API release can lead to fluctuations in plasma drug levels, which may result in various side effects. This has led to a rise in the demand for effective drug delivery treatment options for patients.
Notably, in the recent past the development of combination products has attracted significant interest from pharmaceutical companies. These products integrate two or more FDA-regulated components to enable controlled release of APIs. However, creating drug-device combination products is a complex and lengthy process that demands innovative technologies, substantial investment, and specialized expertise. Additional challenges include ensuring drug-device compatibility, addressing user requirements, conducting release testing, and meeting production and packaging standards. To address these hurdles and improve patient outcomes, many developers are now outsourcing key operations to specialized companies that provide testing and validation services for combination products.
GLOBAL DRUG DEVICE COMBINATION PRODUCTS MARKET: KEY INSIGHTS
The report delves into the current state of global drug device combination products market and identifies potential growth opportunities within industry. Some key findings from the report include:
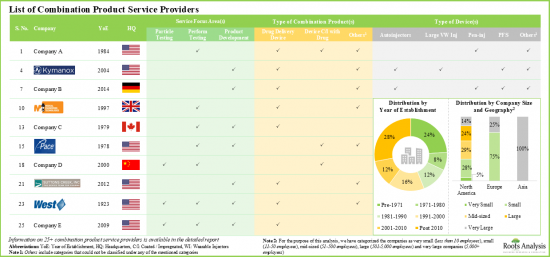
- At present, more than 25 companies across the globe offer services for the development and testing of various drug-device combination products.
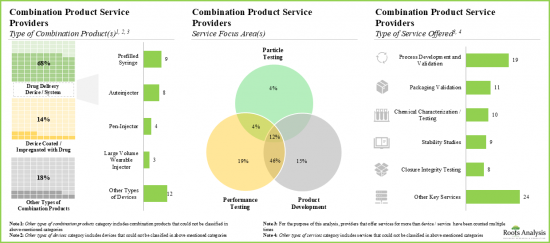
- Service providers claim to have the necessary expertise to provide a wide range of services for different types of combination products; majority (~20%) of these services are focused on performance testing.
- Majority of the players (over 85%) that support development and testing of drug delivery devices / systems are headquartered in North America.
- Over 45% of the service providers assist the performance testing and product development of combination products; of these, 40% are large / very large players.
- Around 75% of the combination product service providers perform the process development and validation; examples include BS, EKG Labs, Exponent and Surpass.
- In order to gain an edge in this competitive industry, service providers are continuously undertaking initiatives to upgrade their existing service offerings.
- To keep pace with the growing demand, many companies have undertaken expansion initiatives, such as establishing new facilities (~40%) or expanding their existing capabilities (~50%), to strengthen their service portfolio.
- Majority of the expansion initiatives were undertaken by combination product service providers based in the US; examples include DDL, NAMSA, and Nelson Labs.
- Majority expansions were undertaken in order to meet the increasing demand for testing services related to combination products.
- Most of the expansions reported were local initiatives; some companies based in the US have undertaken international expansions initiatives as well.
- Presently, over 210 combination products have been / are being developed for the treatment of various clinical conditions; these can be used for both parenteral as well as non-parenteral drug delivery.
- The pipeline features a variety of combination products that have been / are being developed for various therapeutic areas; majority of the products are being evaluated for the administration of biologics.
- Majority of the large volume WI combination products (~80%) that are currently under development are being developed to provide basal dose.
- A sizeable proportion of large volume WI combination products are being developed for the treatment of neurological disorders (33%); examples include D-mine(R) Pump, and ND0701.
- Over 90% of the prefilled syringe combination products have been / are being developed to administer biologics; of these, majority are antibody-based molecules (48%).
- Combination product developers are anticipated to forge strategic alliances with service providers for the development and testing of their proprietary combination products.
- Built on our intellectual capital, we have proposed a proprietary framework to allow developers to decide whether to outsource manufacturing or keep it in-house; we expect majority of the small firms to outsource such operations.
- With the rising demand for combination products, the affiliated market for service providers is expected to grow at a steady annualized rate over the coming decade.
Example Players in the Drug Device Combination Products Market
- EKG LABS
- Eurofins Medical Device Testing
- Exponent
- Kymanox
- Medical Engineering Technologies
- Pace Analytical Services
- Suttons Creek
- West Pharmaceutical Services
GLOBAL DRUG DEVICE COMBINATION PRODUCTS MARKET: RESEARCH COVERAGE
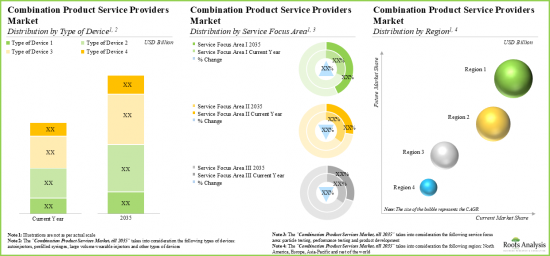
- Market Sizing and Opportunity Analysis: The report features an in-depth analysis of the global drug device combination products market, focusing on key market segments, including [A] type of device, [B] service focus area, [C] company size and [D] key geographical regions.
- Market Landscape: A comprehensive evaluation of combination product service providers, considering various parameters, such as [A] year of establishment, [B] company size, [C] location of headquarters, [D] type of combination product(s), [E] type of device(s), [F] service focus area(s), [G] type of service(s) offered, [H] location of facility and [I] leading players (in terms of number of services offered).
- Company Competitiveness Analysis: A comprehensive competitive analysis of combination product service providers, examining factors, such as [A] supplier power and [B] service portfolio strength.
- Company Profiles: In-depth profiles of companies that offer services for development and testing of combination products, focusing on [A] company overviews and [B] recent developments and an informed future outlook.
- Recent Expansions: An insightful analysis of recent expansions undertaken by various combination product service providers, based on various relevant parameters, such as [A] year of expansion, [B] type of expansion, [C] location of expanded facility, [D] most active players (in terms of number of recent expansions) and [E] geographical distribution.
- Case Study: A detailed discussion on the most advanced and popular combination products, including large volume wearable injectors and prefilled syringes combination products, providing information on their developer(s) and combination product specific features.
- Likely Partner Analysis: A comprehensive analysis of more than 90 combination product developers that are likely to partner with combination product service providers. These players analyzed based on various parameters, such as [A] pipeline strength, [B] developer strength and [C] product strength.
- Go or No-Go Framework Analysis: In-depth analysis highlighting the various factors that need to be considered by combination product developers while deciding whether to develop their respective products in-house or engage the services of a service provider.
KEY QUESTIONS ANSWERED IN THIS REPORT
- How many companies are currently engaged in this market?
- Which are the leading companies in this market?
- What factors are likely to influence the evolution of this market?
- What is the current and future market size?
- What is the CAGR of this market?
- How is the current and future market opportunity likely to be distributed across key market segments?
REASONS TO BUY THIS REPORT
- The report provides a comprehensive market analysis, offering detailed revenue projections of the overall market and its specific sub-segments. This information is valuable to both established market leaders and emerging entrants.
- Stakeholders can leverage the report to gain a deeper understanding of the competitive dynamics within the market. By analyzing the competitive landscape, businesses can make informed decisions to optimize their market positioning and develop effective go-to-market strategies.
- The report offers stakeholders a comprehensive overview of the market, including key drivers, barriers, opportunities, and challenges. This information empowers stakeholders to stay abreast of market trends and make data-driven decisions to capitalize on growth prospects.
ADDITIONAL BENEFITS
- Complimentary PPT Insights Packs
- Complimentary Excel Data Packs for all Analytical Modules in the Report
- 15% Free Content Customization
- Detailed Report Walkthrough Session with Research Team
- Free Updated report if the report is 6-12 months old or older
TABLE OF CONTENTS
1. PREFACE
- 1.1. Scope of the Report
- 1.2. Research Methodology
- 1.2.1. Research Assumptions
- 1.2.2. Project Methodology
- 1.2.3. Forecast Methodology
- 1.2.4. Robust Quality Control
- 1.2.5. Key Considerations
- 1.2.5.1. Demographics
- 1.2.5.2. Economic Factors
- 1.2.5.3. Government Regulations
- 1.2.5.4. Supply Chain
- 1.2.5.5. COVID Impact / Related Factors
- 1.2.5.6. Market Access
- 1.2.5.7. Healthcare Policies
- 1.2.5.8. Industry Consolidation
- 1.3 Key Questions Answered
- 1.4. Chapter Outlines
2. EXECUTIVE SUMMARY
3. INTRODUCTION
- 3.1. Chapter Overview
- 3.2. Introduction to Combination Products
- 3.3. Challenges Associated with Development of Combination Products
- 3.4. Outsourced Combination Products Operations / Services
- 3.5. Advantages of Outsourcing Operations for Combination Products
- 3.6. Key Considerations while Selecting a CDMO
- 3.7. Future Perspectives
4. COMBINATION PRODUCTS SERVICE PROVIDERS: MARKET LANDSCAPE
- 4.1. Chapter Overview
- 4.2. Combination Products Service Providers: Overall Market Landscape
- 4.2.1. Analysis by Year of Establishment
- 4.2.2. Analysis by Company Size
- 4.2.3. Analysis by Location of Headquarters
- 4.2.4. Analysis by Type of Combination Product
- 4.2.5. Analysis by Type of Device
- 4.2.6. Analysis by Service Focus Area(s)
- 4.2.7. Analysis by Type of Service(s) Offered
- 4.2.8. Analysis by Location of Facility
- 4.2.9. Leading Combination Products Service Providers: Analysis by Number of Service(s) Offered
- 4.2.10. 4D Bubble Representation: Analysis by Company Size, Location of Headquarters (Region), Number of Service Focus Area(s) and Number of Service(s) Offered
- 4.2.11. Mekko Representation: Analysis by Company Size and Number of Service Focus Area(s)
5. COMPANY COMPETITIVENESS ANALYSIS
- 5.1. Chapter Overview
- 5.2. Assumptions / Key Parameters
- 5.3. Methodology
- 5.4. Combination Products Service Providers: Company Competitiveness Analysis
- 5.4.1. Combination Products Service Providers based in North America
- 5.4.2. Combination Products Service Providers based in Europe and Asia
6. COMBINATION PRODUCTS SERVICE PROVIDERS: COMPANY PROFILES
- 6.1. Chapter Overview
- 6.2. EKG LABS
- 6.2.1. Company Overview
- 6.2.2. Recent Developments and Future Outlook
- 6.3. Eurofins Medical Device Testing
- 6.3.1. Company Overview
- 6.3.2. Recent Developments and Future Outlook
- 6.4. Exponent
- 6.4.1. Company Overview
- 6.4.2. Recent Developments and Future Outlook
- 6.5. Kymanox
- 6.5.1. Company Overview
- 6.5.2. Recent Developments and Future Outlook
- 6.6. Medical Engineering Technologies
- 6.6.1. Company Overview
- 6.6.2. Recent Developments and Future Outlook
- 6.7. Pace Analytical Services
- 6.7.1. Company Overview
- 6.7.2. Recent Developments and Future Outlook
- 6.8. Suttons Creek
- 6.8.1. Company Overview
- 6.8.2. Recent Developments and Future Outlook
- 6.9. West Pharmaceutical Services
- 6.9.1. Company Overview
- 6.9.2. Recent Developments and Future Outlook
- 6.10. Concluding Remarks: Initiatives Undertaken by Industry Players
7. RECENT EXPANSIONS
- 7.1. Chapter Overview
- 7.2. Combination Products Service Providers: List of Recent Expansions
- 7.2.1. Analysis by Year of Expansion
- 7.2.2. Analysis by Type of Expansion
- 7.2.3. Analysis by Location of Expanded Facility
- 7.2.4. Analysis by Type of Expansion (Country-wise)
- 7.2.5. Most Active Players: Analysis by Number of Expansions
- 7.2.6. Geographical Analysis
8. CASE STUDY: LARGE VOLUME WEARABLE INJECTORS AND PREFILLED SYRINGES COMBINATION PRODUCTS
- 8.1. Chapter Overview
- 8.2. Large Volume Wearable Injector Combination Products
- 8.2.1. Large Volume Drug Device Combination Products: Market Landscape
- 8.2.1.1. Analysis by Phase of Development
- 8.2.1.2. Analysis by Type of Device
- 8.2.1.3. Analysis by Drug Compatibility
- 8.2.1.4. Analysis by Type of Dosage
- 8.2.1.5. Analysis by Route of Administration
- 8.2.1.6. Analysis by Method of Administration
- 8.2.1.7. Analysis by Therapeutic Area
- 8.2.1.8. Analysis by Storage Volume / Capacity
- 8.2.1.9. Analysis by Usability
- 8.2.1.10. Analysis by Technology Used
- 8.2.1.11. Analysis by Mechanism of Action
- 8.2.1.12. Analysis by Type of Drug Container
- 8.2.2. Large Volume Drug Device Combination Products: Developer Landscape
- 8.2.2.1. Analysis by Year of Establishment
- 8.2.2.2. Analysis by Company Size
- 8.2.2.3. Analysis by Location of Headquarters
- 8.2.2.4. Most Active Players: Analysis by Number of Products Manufactured
- 8.2.1. Large Volume Drug Device Combination Products: Market Landscape
- 8.3. Prefilled Syringes Combination Products
- 8.3.1. Prefilled Syringe Combination Products: List of Approved Drugs
- 8.3.1.1. Analysis by Type of Drug Molecule
- 8.3.1.2. Analysis by Approval Year
- 8.3.1.3. Analysis by Geography
- 8.3.1.4. Analysis by Route of Administration
- 8.3.1.5. Analysis by Therapeutic Area
- 8.3.1.6. Analysis by Dosage Strength
- 8.3.1.7. Analysis by Other Approved Dosage Forms
- 8.3.2. Prefilled Syringe Combination Products: List of Clinical Stage Drugs
- 8.3.2.1. Analysis by Type of Drug Molecule
- 8.3.2.2. Analysis by Phase of Development
- 8.3.2.3. Analysis by Route of Administration
- 8.3.2.4. Analysis by Therapeutic Area
- 8.3.3. Prefilled Syringes Combination Products: Information on Developers
- 8.3.3.1. Analysis by Year of Establishment
- 8.3.3.2. Analysis by Company Size
- 8.3.3.3. Analysis by Location of Headquarters
- 8.3.1. Prefilled Syringe Combination Products: List of Approved Drugs
9. LIKELY PARTNER ANALYSIS
- 9.1. Chapter Overview
- 9.2. Large Volume Wearable Injectors Combination Products
- 9.2.1. Scoring Criteria and Key Assumptions
- 9.2.2. Scope and Methodology
- 9.2.3. Potential Strategic Partners
- 9.2.3.1. Most Likely Partners
- 9.2.3.2. Likely Partners
- 9.2.3.3. Less Likely Partners
- 9.3. Prefilled Syringes Combination Products
- 9.3.1. Scoring Criteria and Key Assumptions
- 9.3.2. Scope and Methodology
- 9.3.3. Potential Strategic Partners
- 9.3.3.1. Most Likely Partners
- 9.3.3.2. Likely Partners
- 9.3.3.3. Less Likely Partners
10. OUTSOURCING: GO / NO-GO FRAMEWORK
- 10.1. Chapter Overview
- 10.2. Outsourcing: Go / No-Go Framework
- 10.3. Prefilled Syringes Combination Products Developers: Go / No-Go Framework
- 10.3.1. Assumptions and Key Parameters
- 10.3.2. Methodology
- 10.3.3. Results and Interpretations
- 10.3.3.1. Outsourcing: Go / No-Go Framework for Very Small and Small Companies
- 10.3.3.2. Outsourcing: Go / No-Go Framework for Mid-sized Companies
- 10.3.3.3. Outsourcing: Go / No-Go Framework for Large Companies
11. MARKET FORECAST
- 11.1. Chapter Overview
- 11.2. Key Assumptions and Forecast Methodology
- 11.3. Global Combination Products Service Providers Market, Till 2035
- 11.3.1. Global Combination Products Service Providers Market: Distribution by Type of Device
- 11.3.1.1. Combination Products Service Providers Market for Large Volume Wearable Injectors
- 11.3.1.2. Combination Products Service Providers Market for Autoinjector Combination Products
- 11.3.1.3. Combination Products Service Providers Market for Prefilled Syringe
- 11.3.1.4. Combination Products Service Providers Market for Other Types of Combination Products
- 11.3.2. Global Combination Products Service Providers Market: Distribution by Service Focus Area
- 11.3.2.1. Combination Products Service Providers Market for Particle Testing
- 11.3.2.2. Combination Products Service Providers Market for Performance Testing
- 11.3.2.3. Combination Products Service Providers Market for Product Development
- 11.3.3. Global Combination Products Service Providers Market: Distribution by Company Size
- 11.3.3.1. Combination Products Service Providers Market for Very Small Companies
- 11.3.3.2. Combination Products Service Providers Market for Small Companies
- 11.3.3.3. Combination Products Service Providers Market for Mid-sized Companies
- 11.3.3.4. Combination Products Service Providers Market for Large Companies
- 11.3.3.5. Combination Products Service Providers Market for Very Large Companies
- 11.3.4 Combination Products Service Providers Market: Distribution by Region
- 11.3.4.1. Combination Products Service Providers Market in North America, Till 2035
- 11.3.4.2. Combination Products Service Providers Market in Europe, Till 2035
- 11.3.4.3. Combination Products Service Providers Market in Asia, Till 2035
- 11.3.4.4. Combination Products Service Providers in Rest of the World, Till 2035
- 11.3.1. Global Combination Products Service Providers Market: Distribution by Type of Device
12. CONCLUDING REMARKS
13. EXECUTIVE INSIGHTS
14. APPENDIX 1: TABULATED DATA
15. APPENDIX 2: LIST OF COMPANIES AND ORGANIZATIONS
List of Tables
- Table 4.1 Combination Products Service Providers: Information on Year of Establishment, Company Size and Location of Headquarters
- Table 4.2 Combination Products Service Providers: Information on Type of Combination Product
- Table 4.3 Combination Products Service Providers: Information on Type of Device
- Table 4.4 Combination Products Service Providers: Information on Service Focus Area(s)
- Table 4.5 Combination Products Service Providers: Information on Type of Service(s) Offered
- Table 4.6 Combination Products Service Providers: Information on Location of Facility(s)
- Table 6.1 Combination Products Service Providers: List of Companies Profiled
- Table 6.2 EKG LABS: Company Overview
- Table 6.3 Eurofins Medical Device Testing: Company Overview
- Table 6.4 Eurofins Medical Device Testing: Recent Developments and Future Outlook
- Table 6.5 Exponent: Company Overview
- Table 6.6 Exponent: Recent Developments and Future Outlook
- Table 6.7 Kymanox: Company Overview
- Table 6.8 Kymanox: Recent Developments and Future Outlook
- Table 6.9 Medical Engineering Technologies: Company Overview
- Table 6.10 Medical Engineering Technologies: Recent Developments and Future Outlook
- Table 6.11 Pace Analytical Services: Company Overview
- Table 6.12 Pace Analytical Services: Recent Developments and Future Outlook
- Table 6.13 Suttons Creek: Company Overview
- Table 6.14 Suttons Creek: Recent Developments and Future Outlook
- Table 6.15 West Pharmaceutical Services: Company Overview
- Table 6.16 West Pharmaceutical Services: Recent Developments and Future Outlook
- Table 7.1 Combination Products Service Providers: List of Expansions, Since 2017
- Table 8.1 Large Volume Drug Device Combinations: Information on Phase of Development and Device Features
- Table 8.2 Large Volume Drug Device Combinations: Information on Drug Administration Related Parameters
- Table 8.3 Large Volume Wearable Injectors for Drug Device Combinations: Information on Developers
- Table 8.4 Prefilled Syringes Combination Products: List of Approved Drugs, Since 2013
- Table 8.5 Prefilled Syringes Combination Products: Information on Approval Year, Since 2013
- Table 8.6 Prefilled Syringes Combination Products: Information on Target Indication(s) and Dosage Strength
- Table 8.7 Prefilled Syringes Combination Products: List of Other Drug Delivery Solutions, Since 2013
- Table 8.8 Prefilled Syringes Combination Products: List of Clinical Stage Drugs
- Table 8.9 Prefilled Syringes Combination Products: List of Developers
- Table 9.1 Most Likely Partners
- Table 9.2 Likely Partners
- Table 9.3 Least Likely Partners
- Table 14.1 Combination Products Service Providers: Cumulative Distribution by Year of Establishment
- Table 14.2 Combination Products Service Providers: Distribution by Company Size
- Table 14.3 Combination Products Service Providers: Distribution by Location of Headquarters
- Table 14.4 Combination Products Service Providers: Distribution by Company Size and Location of Headquarters
- Table 14.5 Combination Products Service Providers: Distribution by Type of Combination Product
- Table 14.6 Combination Products Service Providers: Distribution by Company Size and Type of Combination Product
- Table 14.7 Combination Products Service Providers: Distribution by Type of Device
- Table 14.8 Combination Product Service Providers: Distribution by Service Focus Area(s)
- Table 14.9 Combination Product Service Providers: Distribution by Type of Service(s) Offered
- Table 14.10 Combination Product Service Providers: Distribution by Location of Facility (Region-wise)
- Table 14.11 Combination Product Service Providers: Distribution by Location of Facility (Country-wise)
- Table 14.12 Leading Combination Product Service Providers: Distribution by Number of Key Service(s) Offered
- Table 14.13 4D Bubble Analysis: Distribution by Company Size, Company Headquarters (Region), Number of Service Focus Area(s) and Number of
- Table 14.14 Mekko Representation: Distribution by Company Size and Service Focus Area(s)
- Table 14.15 Recent Expansions: Cumulative Year-wise Trend, Since 2017
- Table 14.16 Recent Expansions: Distribution by Type of Expansion
- Table 14.17 Recent Expansions: Distribution by Year of Expansion and Type of Expansion
- Table 14.18 Recent Expansions: Distribution by Location of Expanded Facility
- Table 14.19 Recent Expansions: Distribution by Type of Expansion and Location of Expanded Facility
- Table 14.20 Recent Expansions: Distribution by Type of Expansion (Country-wise)
- Table 14.21 Recent Expansions: Distribution by Location of Expanded Facility and Type of Expansion (Country-wise)
- Table 14.22 Most Active Players: Distribution by Number of Recent Expansions
- Table 14.23 Large Volume Drug Device Combinations: Distribution by Phase of Development
- Table 14.24 Large Volume Drug Device Combinations: Distribution by Type of Device
- Table 14.25 Large Volume Drug Device Combinations: Distribution by Mechanism of Action
- Table 14.26 Large Volume Drug Device Combinations: Distribution by Type of Technology Used
- Table 14.27 Large Volume Drug Device Combinations: Distribution by Route of Administration
- Table 14.28 Large Volume Drug Device Combinations: Distribution by Method of Administration
- Table 14.29 Large Volume Drug Device Combinations: Distribution by Therapeutic Area
- Table 14.30 Large Volume Drug Device Combinations: Distribution by Type of Dosage
- Table 14.31 Large Volume Drug Device Combinations: Distribution by Storage Volume / Capacity (in mL)
- Table 14.32 Large Volume Drug Device Combinations: Distribution by Usability
- Table 14.33 Large Volume Drug Device Combinations: Distribution by Drug Compatibility
- Table 14.34 Large Volume Drug Device Combinations: Distribution by Drug Container
- Table 14.35 Large Volume Wearable Injectors for Drug Device Combinations: Distribution of Developers by Year of Establishment
- Table 14.36 Large Volume Wearable Injectors for Drug Device Combinations: Distribution of Developers by Company Size
- Table 14.37 Large Volume Wearable Injectors for Drug Device Combinations: Distribution of Developers by Location of Headquarters
- Table 14.38 Leading Players: Distribution by Number of Products
- Table 14.39 Approved Prefilled Syringes Combination Products: Distribution by Type of Drug Molecule
- Table 14.40 Approved Prefilled Syringes Combination Products: Distribution by Approval Year
- Table 14.41 Approved Prefilled Syringe Combination Products: Distribution by Geography
- Table 14.42 Approved Prefilled Syringe Combination Products: Distribution by Route of Administration
- Table 14.43 Approved Prefilled Syringe Combination Products: Distribution by Therapeutic Area
- Table 14.44 Approved Prefilled Syringe Combination Products: Distribution by Other Dosage Forms
- Table 14.45 Clinical Stage Prefilled Syringes Combination Products: Distribution by Type of Drug Molecule
- Table 14.46 Clinical Stage Prefilled Syringes Combination Products: Distribution by Phase of Development
- Table 14.47 Clinical Stage Prefilled Syringes Combination Products: Distribution by Route of Administration
- Table 14.48 Clinical Stage Prefilled Syringes Combination Products: Distribution by Therapeutic Area
- Table 14.49 Prefilled Syringe Combination Product Developers: Distribution by Year of Establishment
- Table 14.50 Prefilled Syringe Combination Product Developers: Distribution by Company Size
- Table 14.51 Prefilled Syringe Combination Product Developers: Distribution by Location of Headquarters
- Table 14.52 Global Combination Products Service Providers Market, Till 2035 (USD Million), Conservative, Base and Optimistic Scenarios
- Table 14.53 Global Combination Products Service Providers Market: Distribution by Type of Device
- Table 14.54 Combination Products Service Providers Market for Large Volume Wearable Injectors, Till 2035 (USD Million), Conservative, Base and Optimistic Scenarios
- Table 14.55 Combination Products Service Providers Market for Autoinjectors, Till 2035 (USD Million), Conservative, Base and Optimistic Scenarios
- Table 14.56 Combination Products Service Providers Market for Prefilled Syringes, Till 2035 (USD Million), Conservative, Base and Optimistic Scenarios
- Table 14.57 Combination Products Service Providers Market for Other Types of Combination Products, Till 2035 (USD Million), Conservative, Base and Optimistic Scenarios
- Table 14.58 Global Combination Products Service Providers Market: Distribution by Service Focus Area
- Table 14.59 Combination Products Service Providers Market for Particle Testing, Till 2035 (USD Million), Conservative, Base and Optimistic Scenarios
- Table 14.60 Combination Products Service Providers Market for Performance Testing Till, 2035 (USD Million), Conservative, Base and Optimistic Scenarios
- Table 14.61 Combination Products Service Providers Market for Product Development, Till 2035 (USD Million), Conservative, Base and
- Table 14.62 Global Combination Products Service Providers Market: Distribution by Company Size
- Table 14.63 Combination Products Service Providers Market for Very Small Companies, Till 2035 (USD Million), Conservative, Base and
- Table 14.64 Combination Products Service Providers Market for Small Companies, Till 2035 (USD Million), Conservative, Base and Optimistic Scenarios
- Table 14.65 Combination Products Service Providers Market for Mid-sized Companies, Till 2035 (USD Million), Conservative, Base and Optimistic
- Table 14.66 Combination Products Service Providers Market for Large Companies, Till 2035 (USD Million), Conservative, Base and Optimistic Scenarios
- Table 14.67 Combination Products Service Providers Market for Very Large Companies, Till 2035 (USD Million), Conservative, Base and Optimistic
- Table 14.68 Global Combination Products Service Providers Market: Distribution by Region
- Table 14.69 Combination Products Service Providers Market in North America, Till 2035 (USD Million), Conservative, Base and Optimistic Scenarios
- Table 14.70 Combination Products Service Providers Market in Europe, Till 2035 (USD Million), Conservative, Base and Optimistic Scenarios
- Table 14.71 Combination Products Service Providers Market in Asia, Till 2035 (USD Million), Conservative, Base and Optimistic Scenarios
- Table 14.72 Combination Products Service Providers Market in Rest of the World, Till 2035 (USD Million), Conservative, Base and Optimistic Scenarios
List of Figures
- Figure 2.1 Executive Summary: Combination Products Service Providers Market Landscape
- Figure 2.2 Executive Summary: Recent Expansions
- Figure 2.3 Executive Summary: Case Study on Large Volume Wearable Injectors and Prefilled Syringes Combination Products
- Figure 2.4 Executive Summary: Market Forecast
- Figure 3.1 Types of Combination Products
- Figure 3.2 Recently Approved Combination Products
- Figure 3.3 Challenges Associated with Development of Combination Products
- Figure 3.4 Key Outsourced Combination Product Operations / Services
- Figure 4.1 Combination Products Service Providers: Distribution by Year of Establishment
- Figure 4.2 Combination Products Service Providers: Distribution by Company Size
- Figure 4.3 Combination Products Service Providers: Distribution by Location of Headquarters
- Figure 4.4 Combination Products Service Providers: Distribution by Company Size and Location of Headquarters
- Figure 4.5 Combination Products Service Providers: Distribution by Type of Combination Product
- Figure 4.6 Combination Products Service Providers: Distribution by Company Size and Type of Combination Product
- Figure 4.7 Combination Products Service Providers: Distribution by Type of Device
- Figure 4.8 Combination Product Service Providers: Distribution by Service Focus Area(s)
- Figure 4.9 Combination Product Service Providers: Distribution by Type of Service(s) Offered
- Figure 4.10 Combination Product Service Providers: Distribution by Location of Facility (Region-wise)
- Figure 4.11 Combination Product Service Providers: Distribution by Location of Facility (Country-wise)
- Figure 4.12 Leading Combination Products Service Providers: Distribution by Number of Service(s) Offered
- Figure 4.13 4D Bubble Representation: Distribution by Company Size, Location of Headquarters (Region), Number of Service Focus Area(s) and Number of Service(s) Offered
- Figure 4.14 Mekko Representation: Distribution by Company Size and Service Focus Area(s)
- Figure 5.1 Company Competitiveness Analysis: Players based in North America
- Figure 5.2 Company Competitiveness Analysis: Players based in Europe and Asia
- Figure 6.1 Company Profiles: Initiatives Undertaken by Industry Players
- Figure 7.1 Recent Expansions: Cumulative Year-wise Trend, Since 2017
- Figure 7.2 Recent Expansions: Distribution by Type of Expansion
- Figure 7.3 Recent Expansions: Distribution by Year of Expansion and Type of Expansion
- Figure 7.4 Recent Expansions: Distribution by Location of Expanded Facility
- Figure 7.5 Recent Expansions: Distribution by Type of Expansion (Country-wise)
- Figure 7.6 Recent Expansions: Distribution by Location of Expanded Facility and Type of Expansion (Country-wise)
- Figure 7.7 Most Active Players: Distribution by Number of Expansions
- Figure 9.1 Large Volume Drug Device Combination Products: Distribution by Phase of Development
- Figure 9.2 Large Volume Drug Device Combination Products: Distribution by Type of Device
- Figure 9.3 Large Volume Drug Device Combination Products: Distribution by Mechanism of Action
- Figure 9.4 Large Volume Drug Device Combination Products: Distribution by Type of Technology Used
- Figure 9.5 Large Volume Drug Device Combination Products: Distribution by Route of Administration
- Figure 9.6 Large Volume Drug Device Combination Products: Distribution by Method of Administration
- Figure 9.7 Large Volume Drug Device Combination Products: Distribution by Therapeutic Area
- Figure 9.8 Large Volume Drug Device Combination Products: Distribution by Type of Dosage
- Figure 9.9 Large Volume Drug Device Combination Products: Distribution by Storage Volume / Capacity (in mL)
- Figure 9.10 Large Volume Drug Device Combination Products: Distribution by Usability
- Figure 9.11 Large Volume Drug Device Combination Products: Distribution by Drug compatibility
- Figure 9.12 Large Volume Drug Device Combination Products: Distribution by Drug Container
- Figure 9.13 Large Volume Drug Device Combination Products Developers: Distribution by Year of Establishment
- Figure 9.14 Large Volume Drug Device Combination Products Developers: Distribution by Company Size
- Figure 9.15 Large Volume Drug Device Combination Products: Distribution by Location of Headquarters
- Figure 9.16 Most Active Players: Distribution by Number of Products Manufactured
- Figure 9.17 Approved Prefilled Syringes Combination Products: Distribution by Type of Drug Molecule
- Figure 9.18 Approved Prefilled Syringes Combination Products: Distribution by Approval Year
- Figure 9.19 Approved Prefilled Syringes Combination Products: Distribution by Geography
- Figure 9.20 Approved Prefilled Syringes Combination Products: Distribution by Route of Administration
- Figure 9.21 Approved Prefilled Syringes Combination Products: Distribution by Therapeutic Area
- Figure 9.22 Approved Prefilled Syringes Combination Products: Distribution by Other Dosage Forms
- Figure 9.23 Clinical Stage Prefilled Syringes Combination Products: Distribution by Type of Drug Molecule
- Figure 9.24 Clinical Stage Prefilled Syringes Combination Products: Distribution by Phase of Development
- Figure 9.25 Clinical Stage Prefilled Syringes Combination Products: Distribution by Route of Administration
- Figure 9.26 Clinical Stage Prefilled Syringes Combination Products: Distribution by Therapeutic Area
- Figure 9.27 Prefilled Syringes Combination Product Developers: Distribution by Year of Establishment
- Figure 9.28 Prefilled Syringes Combination Product Developers: Distribution by Company Size
- Figure 9.29 Prefilled Syringes Combination Product Developers: Distribution by Location of Headquarters
- Figure 10.1 Outsourcing: Go / No-Go Framework
- Figure 10.2 Outsourcing: Go / No-Go Framework for Prefilled Syringes Combination Product Developers
- Figure 10.3 Prefilled Syringes Combination Products Developers: Benchmarking of Very Small / Small Companies
- Figure 10.4 Prefilled Syringes Combination Products Developers: Benchmarking of Mid-sized Companies
- Figure 10.5 Prefilled Syringes Combination Products Developers: Benchmarking of Large Companies
- Figure 11.1 Global Combination Products Service Providers Market, Till 2035 (USD Million)
- Figure 11.2 Global Combination Products Service Providers Market: Distribution by Type of Device (USD Million)
- Figure 11.3 Combination Products Service Providers Market for Large Volume Wearable Injectors, Till 2035 (USD Million)
- Figure 11.4 Combination Products Service Providers Market for Autoinjector, Till 2035 (USD Million)
- Figure 11.5 Combination Products Service Providers Market for Prefilled Syringes, Till 2035 (USD Million)
- Figure 11.6 Combination Products Service Providers Market for Other Types of Combination Products, Till 2035 (USD Million)
- Figure 11.7 Global Combination Products Service Providers Market: Distribution by Service Focus Area (USD Million)
- Figure 11.8 Combination Products Service Providers Market for Particle Testing, Till 2035 (USD Million)
- Figure 11.9 Combination Products Service Providers Market for Performance Testing, Till 2035 (USD Million)
- Figure 11.10 Combination Products Service Providers Market for Product Development, Till 2035 (USD Million)
- Figure 11.11 Global Combination Products Service Providers Market: Distribution by Company Size (USD Million)
- Figure 11.12 Combination Products Service Providers Market for Very Small Companies, Till 2035 (USD Million)
- Figure 11.13 Combination Products Service Providers Market for Small Companies, Till 2035 (USD Million)
- Figure 11.14 Combination Products Service Providers Market for Mid-sized Companies, Till 2035 (USD Million)
- Figure 11.15 Combination Products Service Providers Market for Large Companies, Till 2035 (USD Million)
- Figure 11.16 Combination Products Service Providers Market for Very Large Companies, Till 2035 (USD Million)
- Figure 11.17 Global Combination Products Service Providers Market: Distribution by Region (USD Million)
- Figure 11.18 Combination Products Service Providers Market in North America, Till 2035 (USD Million)
- Figure 11.19 Combination Products Service Providers Market in Europe, Till 2035 (USD Million)
- Figure 11.20 Combination Products Service Providers Market in Asia, Till 2035 (USD Million)
- Figure 11.21 Combination Products Service Providers Market in Rest of the World, Till 2035 (USD Million)
- Figure 12.1 Conclusion: Combination Products Service Providers Market Landscape
- Figure 12.2 Conclusion: Company Competitiveness Analysis
- Figure 12.3 Conclusion: Recent Expansions
- Figure 12.4 Conclusion: Combination Products Case Study on Large Volume Wearable Injectors and Prefilled Syringes
- Figure 12.5 Conclusion: Likely Partner Analysis
- Figure 12.6 Conclusion: Outsourcing Go / No-Go Framework
- Figure 12.7 Conclusion: Market Forecast
 醫藥及醫療設備組合產品市場:2026-2032年全球市場預測(依產品類型、技術、劑型、治療領域及最終用戶分類)
 醫藥和醫療設備組合產品的市場規模、佔有率、趨勢和預測:按產品、應用、最終用戶和地區分類,2026-2034 年
 床邊DR市場報告:趨勢、預測與競爭分析(至2035年)
 全球醫藥及醫療設備綜合產品市場規模、佔有率、趨勢及成長分析報告(2026-2034)
 2026年全球藥品和醫療設備組合市場報告全球藥品和醫療設備綜合市場規模、佔有率、趨勢和成長分析報告(2026-2034)
 全球藥物-醫療設備組合產品市場(按產品類型、應用、最終用戶和地區分類)- 預測至 2030 年藥物-設備組合產品市場,按產品類型、按應用、按最終用戶、按技術、按國家和地區 - 2025 年至 2032 年全球行業分析、市場規模、市場佔有率和預測
 醫藥品·醫療設備組合產品市場,規模,佔有率,趨勢,產業分析報告:各產品類型,各用途,各終端用戶,各地區 - 市場預測,2025年~2034年
 藥物/器械組合的全球市場