


 |
市場調查報告書
商品編碼
1771304
醫學影像人工智慧市場:產業趨勢及全球預測-依應用、影像類型和主要地區AI in Medical Imaging Market: Industry Trends and Global Forecasts - Distribution by Application Area, Type of Image Processed and Key Geographical Regions |
||||||
醫學影像人工智慧市場:概覽
今年,全球醫學影像人工智慧市場規模達 17.5億美元。預計在預測期內,該市場將以 30%的年複合成長率成長。
市場規模與機會分析依下列參數細分:
應用領域
- 肺部感染/呼吸系統疾病
- 腦損傷/腦疾病
- 肺癌
- 心臟病/心血管疾病
- 骨畸形/骨科疾病
- 乳癌
- 其他
影像處理類型
- X光
- MRI
- CT
- 超音波
主要地區
- 北美
- 歐洲
- 亞太地區及世界其他地區
全球醫學影像人工智慧市場:成長與趨勢
近年來,大量的醫學影像催生了對多功能自改進演算法和先進並行化技術的需求。醫學影像技術中的人工智慧是一種複雜的機器學習演算法,它使用多層結構互連的節點/神經元神經網路,能夠解讀大量非結構化資料並產生有價值的洞察。因此,該技術正逐漸被應用於醫療領域的各種應用,例如影像診斷和資料處理。此外,專家認為,在基於醫學影像的影像處理解決方案中利用人工智慧卓越的模式識別能力,將有助於放射科醫生做出更明智的決策。
隨著時間的推移,一些行業利益相關者開發了自己的醫學影像演算法AI,專門用於醫學影像分析。目前,許多創新者聲稱他們的技術可以訓練電腦解讀和分析醫學影像,並識別時間和空間模式。此外,值得注意的是,許多人工智慧診斷行業的專家認為,醫學影像中的人工智慧可以顯著加速放射學資料的處理和解讀。事實上,一些研究報告顯示,診斷速度提高了約20%,輸出假陽性率也降低了約10%。
全球醫學影像人工智慧市場:關鍵洞察
本報告深入探討了全球醫學影像人工智慧市場的現狀,並識別了產業內的潛在成長機會。報告的主要調查結果包括:
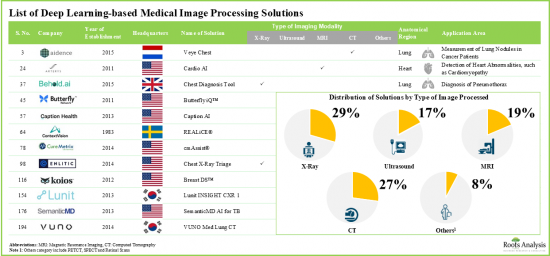
- 目前,多家公司開發/開發近200種基於醫學影像的人工智慧解決方案,以支援放射科醫師做出高效且準確的診斷決策。
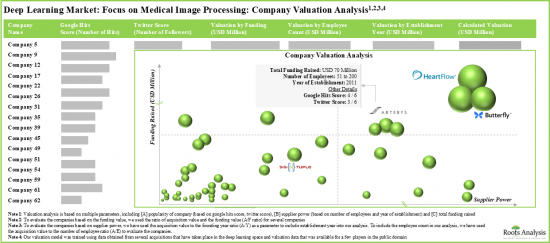
- 各利益相關者透過實施各自的策略,在該行業確立了強勢地位。估值/淨資產較高的公司最有可能為整體創收潛力做出貢獻。
- 憑藉更佳的影像視覺化和解剖區域精細分割等功能,這些解決方案已展現出顯著提高放射科醫生效率和節省醫療成本的潛力。
- 多家公私投資者預見了良好的未來,已在150個案例中投資超過20億美元。
- 合作案例的增加也反映了人們對該領域日益成長的興趣,其中大多數已達成的交易都集中在將AI引進醫院和診所的醫學影像解決方案。
- 近期,老牌企業和新進者都建立了多項合作關係。這些交易目的是提升基於醫學影像的人工智慧解決方案的可近性。
- 該領域的合作活動正以良好的年複合成長率成長。事實上,過去三年的合作數量最多。
- 大多數合作(72%)是在非腫瘤領域達成的。這些交易大多與腦血管疾病、心血管疾病和肺部感染有關。
- 過去幾年,各組織已提交/授予了大量與醫學影像和醫學影像人工智慧相關的專利。
- 目前已有多項臨床研究註冊,用於評估基於醫學影像的人工智慧解決方案,各公司均對其演算法在處理各類醫學影像方面的表現給出了積極的評價。
- 市場成長機會可能源自於對新型解決方案日益成長的需求,這些解決方案目的是減輕放射科醫師現有的負擔。預計這一機會將涵蓋各個應用領域和圖像類型。
全球醫學影像AI市場:主要細分市場
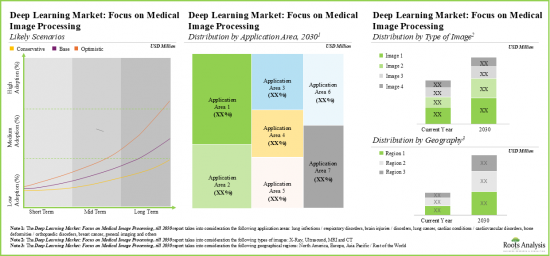
根據應用領域,市場細分為肺部感染/呼吸系統疾病、腦損傷/腦疾病、肺癌、心臟病/心血管疾病、骨骼畸形/骨科疾病、乳癌及其他。目前,腦損傷/腦疾病細分市場在全球醫學影像AI市場中佔有最大佔有率。預計未來幾年這一趨勢將保持不變。
根據主要地區,市場細分為北美、歐洲、亞太地區和世界其他地區。預計北美和歐洲的參與者將佔據大部分市場佔有率。
參與全球醫學影像人工智慧市場的公司範例
- Artelus
- Arterys
- Butterfly Network
- ContextVision
- Enlitic
- Echonous
- GE Healthcare
- InferVision
- VUNO
本報告調查了全球醫學影像人工智慧市場,並提供了市場概況,依應用領域、影像處理類型和地區劃分的趨勢以及參與市場的公司簡介。
目錄
第1章 前言
第2章 執行摘要
第3章 簡介
- 人類、機器與智能
- 學習的科學
- 人工智慧
- 巨量資料革命
- 人工智慧在醫療健康領域醫學影像中的應用
第4章 案例研究:IBM Watson 與 Google DeepMind
- 章節概述
- 國際商業機器公司(IBM)
- IBM 與Google:人工智慧相關收購
- IBM 與Google:醫療保健領域的合作夥伴關係與合作
- IBM 與Google:關鍵問題與未來展望
第5章 市場概覽
- 章節概覽
- 醫學影像中的人工智慧:市場格局
- 醫學影像中的人工智慧:主要特點
- 醫學影像中的人工智慧:公司列表
第6章 公司簡介
- 章節概覽
- Artelus
- Arterys
- Butterfly Network
- ContextVision
- Enlitic
- Echonous
- GE Healthcare
- InferVision
- VUNO
第7章 合作夥伴與合作
- 章節概覽
- 合作夥伴關係模型
- 醫學影像中的人工智慧:合作夥伴與合作清單
- 結論
第8章 資金與投資分析
- 章節概述
- 資金類型
- 醫學影像中的人工智慧:近期融資案例
第9章 公司估值分析
- 章節概述
- 研究方法
- 依參數分類
第10章 案例研究:美國註冊的基於醫學影像的臨床試驗中的人工智慧分析
- 章節概述
- 研究範圍與研究方法
- 臨床試驗分析
第11章 專利分析
- 第概述
- 研究範圍與研究方法
- 醫學影像中的人工智慧及醫學影像:專利分析
- 專利估值分析
第12章 成本節約分析
- 章節概述
- 關鍵假設與研究方法
- 到2035年,人工智慧在醫學影像解決方案中的整體成本節約潛力
- X光成像
- MRI成像
- CT影像
- 超音波成像
- 結論:成本節約方案
第13章 市場預測
- 章節概述
- 預測研究方法與關鍵假設
- 醫學影像市場中的人工智慧:依應用領域
- 醫學影像市場中的人工智慧:依影像處理類型
- 醫學影像市場中的人工智慧:依關鍵地區
- 結論
第14章 醫療健康領域醫學影像中的人工智慧:專家見解
- 章節概述
- 行業專家
- 大學和醫院專家
- 其他專家意見
第15章 訪談記錄
第16章 新冠疫情對醫學影像領域人工智慧市場動態的影響
- 章節概述
- 新冠疫情影響評估
- 因應策略:根源分析視角
第17章 結論
第18章 附錄1:表格資料
第19章 附錄2:公司與組織清單
AI IN MEDICAL IMAGING MARKET: OVERVIEW
As per Roots Analysis, the global AI in medical imaging market valued at USD 1.75 billion in the current year is expected to grow at a lucrative CAGR of 30% during the forecast period.
The market sizing and opportunity analysis has been segmented across the following parameters:
Application Area
- Lung Infections / Respiratory Disorders
- Brain Injuries / Disorders
- Lung Cancer
- Cardiac Conditions / Cardiovascular Disorders
- Bone Deformities / Orthopedic Disorders
- Breast Cancer
- Others Application Areas
Type of Image Processed
- X-ray
- MRI
- CT
- Ultrasound
Key Geographical Regions
- North America
- Europe
- Asia-Pacific and Rest of the World
GLOBAL AI IN MEDICAL IMAGING MARKET: GROWTH AND TRENDS
In recent years, large volumes of medical images have created the need for versatile, self-improving algorithms and advanced parallelization techniques. AI in medical imaging technology is a complex machine learning algorithm that uses a neural network of interconnected nodes / neurons in a multi-layered structure, thereby enabling the interpretation of large volumes of unstructured data to generate valuable insights. As a result, this technology is gradually being incorporated into a variety of applications across the healthcare sector, including diagnostic imaging and data processing. Moreover, experts believe that by leveraging the superior pattern recognition ability of AI in medical imaging-based image processing solutions, radiologists can make better informed decisions.
Over time, several industry stakeholders have developed proprietary AI in medical imaging algorithms specifically for medical image analysis. Currently, numerous innovators assert that their technologies can train computers to interpret and analyze medical images, identifying both temporal and spatial patterns. Further, it is worth highlighting that many experts in the artificial intelligence driven diagnostics industry believe that AI in medical imaging can significantly accelerate the processing and interpretation of radiological data. In fact, some studies report approximately a 20% improvement in diagnostic speed and a reduction of false positive rates by about 10% in the resulting outputs.
GLOBAL AI IN MEDICAL IMAGING MARKET: KEY INSIGHTS
The report delves into the current state of global AI in medical imaging market and identifies potential growth opportunities within the industry. Some key findings from the report include:
- Presently, close to 200 AI in medical imaging-based solutions have been / are being developed by several companies in order to support radiologists in making accurate diagnosis decisions in a time efficient manner.
- Stakeholders have established strong positions in the industry by implementing unique strategies; companies with high valuation / net worth are likely to contribute the most to the overall revenue generation potential.
- Owing to features, such as better image visualization and detailed segmentation of anatomical regions, these solutions can significantly enhance a radiologists' efficiency, demonstrating the potential to save healthcare cost.
- Foreseeing a lucrative future, several public and private investors have made investments worth over USD 2 billion, across 150 instances.
- The growing interest in this field is reflected in the increasing number of partnership instances; majority of the deals inked were focused on the deployment of AI in medical imaging solutions at hospitals and clinics.
- Both established players and new entrants have forged several partnerships in the recent past; these deals have been inked with an aim to increase accessibility of the AI in medical imaging-based solutions.
- The partnership activity in this domain has increased at a lucrative CAGR. In fact, the maximum partnerships were reported in the last three years.
- Majority (72%) of the partnerships were inked for non-oncology segment; most of these deals were related to cerebrovascular disorders, cardiovascular disorders and lung infections.
- Over the years, significant number of patents related to AI in medical imaging and medical image processing have been filed / granted to various organizations.
- Multiple clinical studies were registered for the evaluation of AI in medical imaging-based solutions; companies have revealed positive results related to performance of algorithms in processing various types of medical images.
- The market growth is likely to be driven by the rising need for novel solutions to overcome the existing burden on radiologists; we expect the opportunity to be distributed across various application areas and types of images.
GLOBAL AI IN MEDICAL IMAGING MARKET: KEY SEGMENTS
Brain Injuries / Disorders Segment Occupy the Largest Share of the Global AI in Medical Imaging Market
Based on the application area, the market is segmented into lung infections / respiratory disorders, brain injuries / disorders, lung cancer, cardiac conditions / cardiovascular disorders, bone deformities / orthopedic disorders, breast cancer and other application areas. At present, brain injuries / disorders segment hold the maximum share of the global AI in medical imaging market. This trend is likely to remain the same in the forthcoming years.
North America Accounts for the Largest Share of the Market
Based on key geographical regions, the market is segmented into North America, Europe, and Asia-Pacific and Rest of the World. The majority share is expected to be captured by players based in North America and Europe.
Example Players in the Global AI in Medical Imaging Market
- Artelus
- Arterys
- Butterfly Network
- ContextVision
- Enlitic
- Echonous
- GE Healthcare
- InferVision
- VUNO
PRIMARY RESEARCH OVERVIEW
The opinions and insights presented in this study were influenced by discussions conducted with multiple stakeholders. The research report features detailed transcripts of interviews conducted with the following industry stakeholders:
- Chief Executive Officer, Company A
- Head of Strategy and Marketing, and Senior Director of Product, Company B
- Chief Technical Officer and Chief Operating Officer, Company C
- Founder and Chief Executive Officer, Company D
- Research Scientist, Company E
GLOBAL AI IN MEDICAL IMAGING MARKET: RESEARCH COVERAGE
- Market Sizing and Opportunity Analysis: The report features an in-depth analysis of the global AI in medical imaging market, focusing on key market segments, including [A] application area, [B] type of image processed and [C] key geographical regions.
- Market Landscape: A comprehensive evaluation of AI based medical imaging solutions for medical image processing, considering various parameters, such as [A] status of development, [B] regulatory approvals, [C] type of offering, [D] type of image processed, [E] application area. Additionally, a comprehensive evaluation of companies developing such solutions, based on parameters, such as [A] year of establishment, [B] company size, [C] location of headquarters and [D] focus area.
- Company Profiles: In-depth profiles of companies engaged in the development of AI in medical imaging-based solutions intended for processing of medical images, focusing on [A] company overviews, [B] solutions portfolio and [C] recent developments and an informed future outlook.
- Partnerships and Collaborations: An insightful analysis of the deals inked by stakeholders in the global AI in medical imaging market, based on several parameters, such as [A] year of partnership, [B] type of partnership, [C] type of partner, [D] therapeutic area, [E] most active players (in terms of the number of partnerships signed) and [F] geographical distribution of partnership activity.
- Funding and Investments: An in-depth analysis of the fundings received by players in AI in the medical imaging market, based on relevant parameters, such as [A] number of funding instances, [B] amount invested, [C] type of funding, [D] most active players, [E] most active investors and [F] geography.
- Company Valuation Analysis: A comprehensive valuation analysis of companies that are engaged in applying AI in medical imaging in solutions intended for processing of medical images.
- Clinical Trial Analysis: An insightful analysis of clinical trials related to AI in medical imaging, based on several parameters, such as [A] trial registration year, [B] trial recruitment status, [C] trial design, [D] target therapeutic area, [E] leading industry and non-industry players, and [F] geographical locations of trials.
- Patent Analysis: An in-depth analysis of patents filed / granted till date in the AI in medical imaging domain, based on various relevant parameters, such as [A] type of patent, [B] publication year, [C] application year, [D] regional applicability, [E] CPC symbols, [F] emerging focus areas, [G] leading patent assignees, and [H] patent benchmarking and valuation.
- Cost Saving Analysis: A comprehensive analysis of cost saving potential associated with the use of AI in medical imaging solutions intended for processing of medical images, examining factors, such as [A] total number of radiologists, [B] annual salary of radiologists, [C] number of scans performed, and [D] increase in efficiency by adoption of AI in medical imaging solutions.
KEY QUESTIONS ANSWERED IN THIS REPORT
- How many companies are currently engaged in this market?
- Which are the leading companies in this market?
- What factors are likely to influence the evolution of this market?
- What is the current and future market size?
- What is the CAGR of this market?
- How is the current and future market opportunity likely to be distributed across key market segments?
REASONS TO BUY THIS REPORT
- The report provides a comprehensive market analysis, offering detailed revenue projections of the overall market and its specific sub-segments. This information is valuable to both established market leaders and emerging entrants.
- Stakeholders can leverage the report to gain a deeper understanding of the competitive dynamics within the market. By analyzing the competitive landscape, businesses can make informed decisions to optimize their market positioning and develop effective go-to-market strategies.
- The report offers stakeholders a comprehensive overview of the market, including key drivers, barriers, opportunities, and challenges. This information empowers stakeholders to stay abreast of market trends and make data-driven decisions to capitalize on growth prospects.
ADDITIONAL BENEFITS
- Complimentary PPT Insights Packs
- Complimentary Excel Data Packs for all Analytical Modules in the Report
- 15% Free Content Customization
- Detailed Report Walkthrough Session with Research Team
- Free Updated report if the report is 6-12 months old or older
TABLE OF CONTENTS
1. PREFACE
- 1.1. Scope of the Report
- 1.2. Research Methodology
- 1.2.1. Research Assumptions
- 1.2.2. Project Methodology
- 1.2.3. Forecast Methodology
- 1.2.4. Robust Quality Control
- 1.2.5. Key Considerations
- 1.2.5.1. Demographics
- 1.2.5.2. Economic Factors
- 1.2.5.3. Government Regulations
- 1.2.5.4. Supply Chain
- 1.2.5.5. COVID Impact / Related Factors
- 1.2.5.6. Market Access
- 1.2.5.7. Healthcare Policies
- 1.2.5.8. Industry Consolidation
- 1.3 Key Questions Answered
- 1.4. Chapter Outlines
2. EXECUTIVE SUMMARY
3. INTRODUCTION
- 3.1. Humans, Machines and Intelligence
- 3.2. The Science of Learning
- 3.2.1. Teaching Machines
- 3.2.1.1. Machines for Computing
- 3.2.1.2. Artificial Intelligence for Understanding the Human Brain
- 3.2.1. Teaching Machines
- 3.3. Artificial Intelligence
- 3.4. The Big Data Revolution
- 3.4.1. Overview of Big Data
- 3.4.2. Role of Internet of Things (IoT)
- 3.4.3. Growing Adoption of Big Data
- 3.4.4. Key Application Areas
- 3.4.4.1. Big Data Analytics in Healthcare
- 3.4.4.2. Machine Learning
- 3.4.4.3. AI in medical imaging: The Amalgamation of Machine Learning and Big Data
- 3.5. Applications for AI in medical imaging in Healthcare
- 3.5.1. Personalized Medicine
- 3.5.2. Personal Fitness and Lifestyle Management
- 3.5.3. Drug Discovery
- 3.5.4. Clinical Trial Management
- 3.5.5. Medical Image Processing
4. CASE STUDY: IBM WATSON VERSUS GOOGLE DEEPMIND
- 4.1. Chapter Overview
- 4.2. International Business Machines (IBM)
- 4.2.1. Company Overview
- 4.2.2. Financial Information
- 4.2.3. IBM Watson
- 4.3. Google
- 4.3.1. Company Overview
- 4.3.2. Financial Information
- 4.3.3. Google DeepMind
- 4.4. IBM versus Google: Artificial Intelligence-related Acquisitions
- 4.5. IBM versus Google: Healthcare Focused Partnerships and Collaborations
- 4.6. IBM versus Google: Primary Concerns and Future Outlook
5. MARKET OVERVIEW
- 5.1. Chapter Overview
- 5.2. AI in medical imaging in Medical Image Processing: Overall Market Landscape
- 5.2.1. Analysis by Status of Development
- 5.2.1.1. Analysis by Regulatory Approvals Received
- 5.2.2. Analysis by Type of Offering
- 5.2.3. Analysis by Type of Image Processed
- 5.2.4. Analysis by Anatomical Region
- 5.2.5. Analysis by Application Area
- 5.2.6. Grid Representation: Analysis by Type of Offering, Type of Image Processed and Application Area
- 5.2.1. Analysis by Status of Development
- 5.3. AI in medical imaging in Medical Image Processing: Information on Key Characteristics
- 5.4. AI in medical imaging in Medical Image Processing: List of Companies
- 5.4.1. Analysis by Year of Establishment
- 5.4.2. Analysis by Company Size
- 5.4.3. Analysis by Location of Headquarters
- 5.4.3.1. World Map Representation: Regional Activity
- 5.4.4. Analysis by Type of Deployment Model
- 5.4.5. Leading Companies: Analysis by Number of Solutions
6. COMPANY PROFILES
- 6.1. Chapter Overview
- 6.2. Artelus
- 6.2.1. Company Overview
- 6.2.2. Product / Technology Portfolio
- 6.2.3. Recent Developments and Future Outlook
- 6.3. Arterys
- 6.3.1. Company Overview
- 6.3.2. Product / Technology Portfolio
- 6.3.3. Recent Developments and Future Outlook
- 6.4. Butterfly Network
- 6.4.1. Company Overview
- 6.4.2. Product / Technology Portfolio
- 6.4.3. Recent Developments and Future Outlook
- 6.5. ContextVision
- 6.5.1. Company Overview
- 6.5.2. Product / Technology Portfolio
- 6.5.3. Recent Developments and Future Outlook
- 6.6. Enlitic
- 6.6.1. Company Overview
- 6.6.2. Product / Technology Portfolio
- 6.6.3. Recent Developments and Future Outlook
- 6.7. Echonous
- 6.7.1. Company Overview
- 6.7.2. Product / Technology Portfolio
- 6.7.3. Recent Developments and Future Outlook
- 6.8. GE Healthcare
- 6.8.1. Company Overview
- 6.8.2. Product / Technology Portfolio
- 6.8.3. Recent Developments and Future Outlook
- 6.9. InferVision
- 6.9.1. Company Overview
- 6.9.2. Product / Technology Portfolio
- 6.9.3. Recent Developments and Future Outlook
- 6.10. VUNO
- 6.10.1. Company Overview
- 6.10.2. Product / Technology Portfolio
- 6.10.3. Recent Developments and Future Outlook
7. PARTNERSHIPS AND COLLABORATIONS
- 7.1. Chapter Overview
- 7.2. Partnership Models
- 7.3. AI in medical imaging in Medical Image Processing: List of Partnerships and Collaborations
- 7.3.1. Analysis by Year of Partnership
- 7.3.2. Analysis by Type of Partnership
- 7.3.3. Analysis by Year and Type of Partnership
- 7.3.4. Analysis by Type of Partner
- 7.3.5. Analysis by Therapeutic Area
- 7.3.6. Most Active Players: Analysis by Number of Partnerships
- 7.3.7. Regional Analysis
- 7.3.8. Intercontinental and Intracontinental Agreements
- 7.4. Concluding Remarks
8. FUNDING AND INVESTMENT ANALYSIS
- 8.1. Chapter Overview
- 8.2. Types of Funding
- 8.3. AI in medical imaging in Medical Image Processing: Recent Funding Instances
- 8.3.1. Analysis by Number of Funding Instances
- 8.3.2. Analysis by Amount Invested
- 8.3.3. Analysis by Type of Funding
- 8.3.4. Most Active Players: Analysis by Number of Funding Instances and Amount Invested
- 8.3.5. Most Active Investors: Analysis by Number of Funding Instances
- 8.3.6. Geographical Analysis by Amount Invested
9. COMPANY VALUATION ANALYSIS
- 9.1. Chapter Overview
- 9.2. Methodology
- 9.3. Categorization by Parameters
- 9.3.1. Twitter Followers Score
- 9.3.2. Google Hits Score
- 9.3.3. Partnerships Score
- 9.3.4. Weighted Average Score
- 9.3.5. Company Valuation: Roots Analysis Proprietary Scores
10. CASE STUDY: ANALYSIS OF AI IN MEDICAL IMAGING-BASED CLINICAL TRIALS REGISTERED IN THE US
- 10.1. Chapter Overview
- 10.2. Scope and Methodology
- 10.3. Clinical Trial Analysis
- 10.3.1. Analysis by Trial Registration Year
- 10.3.2. Analysis by Trial Registration Year and Recruitment Status
- 10.3.3. Analysis by Trial Registration Year and Patient Enrollment
- 10.3.4. Analysis by Trial Design
- 10.3.5. Analysis by Patient Segment
- 10.3.6. Analysis by Therapeutic Area
- 10.3.7. Analysis by Trial Objective
- 10.3.8. Analysis by Focus Areas
- 10.3.9. Analysis by Type of Image Processed
- 10.3.10. Most Active Players: Analysis by Number of Clinical Trials
- 10.3.11. Analysis by Number of Clinical Trials and Geography
- 10.3.12. Analysis by Enrolled Patient Population and Geography
11. PATENT ANALYSIS
- 11.1. Chapter Overview
- 11.2. Scope and Methodology
- 11.3. AI in medical imaging and Medical Image Processing: Patent Analysis
- 11.3.1. Analysis by Application Year and Publication Year
- 11.3.2. Analysis by Issuing Authority / Patent Offices Involved
- 11.3.3. Analysis by IPCR Symbols
- 11.3.4. Emerging Focus Areas
- 11.3.5. Leading Assignees: Analysis by Number of Patents
- 11.3.6. Patent Benchmarking Analysis
- 11.3.6.1. Analysis by Patent Characteristics
- 11.4. Patent Valuation Analysis
12. COST SAVING ANALYSIS
- 12.1. Chapter Overview
- 12.2. Key Assumptions and Methodology
- 12.3. Overall Cost Saving Potential of AI in medical imaging in Medical Image Processing Solutions, Till 2035
- 12.4. X-Ray Images
- 12.4.1. Cost Saving Potential of AI in medical imaging in Medical Image Processing Solutions (X-Ray Images): Analysis by Geography
- 12.4.1.1. Cost Saving Potential of AI in medical imaging in Medical Image Processing Solutions (X-Ray Images) in North America, Till 2035
- 12.4.1.2. Cost Saving Potential of AI in medical imaging in Medical Image Processing Solutions (X-Ray Images) in Europe, Till 2035
- 12.4.1.3. Cost Saving Potential of AI in medical imaging in Medical Image Processing Solutions (X-Ray Images) in Asia-Pacific and RoW, Till 2035
- 12.4.2. Cost Saving Potential of AI in medical imaging in Medical Image Processing Solutions: Analysis by Economic Strength
- 12.4.2.1. Cost Saving Potential of AI in medical imaging in Medical Image Processing Solutions (X-Ray Images) in High Income Countries, Till 2035
- 12.4.2.2. Cost Saving Potential of AI in medical imaging in Medical Image Processing Solutions (X-Ray Images) in Middle Income Countries, Till 2035
- 12.4.1. Cost Saving Potential of AI in medical imaging in Medical Image Processing Solutions (X-Ray Images): Analysis by Geography
- 12.5. MRI Images
- 12.5.1. Cost Saving Potential of AI in medical imaging in Medical Image Processing Solutions (MRI Images): Analysis by Geography
- 12.5.1.1. Cost Saving Potential of AI in medical imaging in Medical Image Processing Solutions (MRI Images) in North America, Till 2035
- 12.5.1.2. Cost Saving Potential of AI in medical imaging in Medical Image Processing Solutions (MRI Images) in Europe, Till 2035
- 12.5.1.3. Cost Saving Potential of AI in medical imaging in Medical Image Processing Solutions (MRI Images) in Asia-Pacific and RoW, Till 2035
- 12.5.2. Cost Saving Potential of AI in medical imaging in Medical Image Processing Solutions (MRI Images): Analysis by Economic Strength
- 12.5.2.1. Cost Saving Potential of AI in medical imaging in Medical Image Processing Solutions (MRI Images) in High Income Countries, Till 2035
- 12.5.2.2. Cost Saving Potential of AI in medical imaging in Medical Image Processing Solutions (MRI Images) in Middle Income Countries, Till 2035
- 12.5.1. Cost Saving Potential of AI in medical imaging in Medical Image Processing Solutions (MRI Images): Analysis by Geography
- 12.6. CT Images
- 12.6.1. Cost Saving Potential of AI in medical imaging in Medical Image Processing Solutions (CT Images): Analysis by Geography
- 12.6.1.1. Cost Saving Potential of AI in medical imaging in Medical Image Processing Solutions (CT Images) in North America, Till 2035
- 12.6.1.2. Cost Saving Potential of AI in medical imaging in Medical Image Processing Solutions (CT Images) in Europe, Till 2035
- 12.6.1.3. Cost Saving Potential of AI in medical imaging in Medical Image Processing Solutions (CT Images) in Asia-Pacific and RoW, Till 2035
- 12.6.2. Cost Saving Potential of AI in medical imaging in Medical Image Processing Solutions (CT Images): Analysis by Economic Strength
- 12.6.2.1. Cost Saving Potential of AI in medical imaging in Medical Image Processing Solutions (CT Images) in High Income Countries, Till 2035
- 12.6.2.2. Cost Saving Potential of AI in medical imaging in Medical Image Processing Solutions (CT Images) in Middle Income Countries, Till 2035
- 12.6.1. Cost Saving Potential of AI in medical imaging in Medical Image Processing Solutions (CT Images): Analysis by Geography
- 12.7. Ultrasound Images
- 12.7.1. Cost Saving Potential of AI in medical imaging in Medical Image Processing Solutions (Ultrasound Images): Analysis by Geography
- 12.7.1.1. Cost Saving Potential of AI in medical imaging in Medical Image Processing Solutions (Ultrasound Images) in North America, Till 2035
- 12.7.1.2. Cost Saving Potential of AI in medical imaging in Medical Image Processing Solutions (Ultrasound Images) in Europe, Till 2035
- 12.7.1.3. Cost Saving Potential of AI in medical imaging in Medical Image Processing Solutions (Ultrasound Images) in Asia-Pacific and RoW, Till 2035
- 12.7.2. Cost Saving Potential of AI in medical imaging in Medical Image Processing Solutions (Ultrasound Images): Analysis by Economic Strength
- 12.7.2.1. Cost Saving Potential of AI in medical imaging in Medical Image Processing Solutions (Ultrasound Images) in High Income Countries, Till 2035
- 12.7.2.2. Cost Saving Potential of AI in medical imaging in Medical Image Processing Solutions (Ultrasound Images) in Middle Income Countries, Till 2035
- 12.7.1. Cost Saving Potential of AI in medical imaging in Medical Image Processing Solutions (Ultrasound Images): Analysis by Geography
- 12.8. Concluding Remarks: Cost Saving Scenarios
13. MARKET FORECAST
- 13.1. Chapter Overview
- 13.2. Forecast Methodology and Key Assumptions
- 13.3. Overall AI in medical imaging in Medical Image Processing Market
- 13.3.1. AI in medical imaging in Medical Image Processing Market: Distribution by Application Area
- 13.3.1.1. AI in medical imaging in Medical Image Processing Market for Brain Abnormalities / Neurological Disorders
- 13.3.1.2. AI in medical imaging in Medical Image Processing Market for Cardiac Abnormalities / Cardiovascular Disorders
- 13.3.1.3. AI in medical imaging in Medical Image Processing Market for Breast Cancer
- 13.3.1.4. AI in medical imaging in Medical Image Processing Market for Bone Deformities / Orthopedic Disorders
- 13.3.1.5. AI in medical imaging in Medical Image Processing Market for Lung Infections / Lung Disorders
- 13.3.1.6. AI in medical imaging in Medical Image Processing Market for Other Disorders
- 13.3.1. AI in medical imaging in Medical Image Processing Market: Distribution by Application Area
- 13.4 AI in medical imaging in Medical Image Processing Market: Distribution by Type of Image Processed
- 13.4.1. AI in medical imaging in Medical Image Processing Market for X-Rays
- 13.4.2. AI in medical imaging in Medical Image Processing Market for MRI
- 13.4.3. AI in medical imaging in Medical Image Processing Market for CT
- 13.4.4. AI in medical imaging in Medical Image Processing Market for Ultrasound
- 13.5 AI in medical imaging in Medical Image Processing Market: Distribution by Key Geographical Regions
- 13.5.1. AI in medical imaging in Medical Image Processing Market in North America
- 13.5.2. AI in medical imaging in Medical Image Processing Market in Europe
- 13.5.3. AI in medical imaging in Medical Image Processing Market in Asia Pacific / RoW
- 13.6 Concluding Remarks
14. AI IN MEDICAL IMAGING IN HEALTHCARE: EXPERT INSIGHTS
- 14.1. Chapter Overview
- 14.2. Industry Experts
- 14.2.1. Chief Operating Officer (The Mount Sinai Hospital) and Robbie Freeman, Vice President of Clinical Innovation (Company A)
- 14.2.2. Vice President of Radiology Informatics (Philips) and Jonathan Laserson, Lead AI Strategist (Company B)
- 14.2.3. Chief Executive Officer (Company C)
- 14.2.4. Chief Scientist and Senior Vice President (Company D)
- 14.2.5. Founder and Researcher (Company E)
- 14.2.6. Serial Entrepreneur and Data Engineer (Company F)
- 14.3. University and Hospital Experts
- 14.3.1. Chairman of Medical Oncology (University A)
- 14.3.2. Professor (University B) and Senior AI Fellowship (University C)
- 14.3.3. Yoshua Bengio, Professor (University D) and Scientific Director (University E)
- 14.4. Other Expert Opinions
15. INTERVIEW TRANSCRIPTS
- 15.1. Chapter Overview
- 15.2. Company A
- 15.2.1. Company Snapshot
- 15.2.2. Interview Transcript: CEO
- 15.3. Company B
- 15.3.1. Company Snapshot
- 15.3.2. Interview Transcript: Head of Strategy and Marketing
- 15.3.3. Interview Transcript: Senior Director of Product
- 15.4. Company C
- 15.4.1. Company Snapshot
- 15.4.2. Interview Transcript: CTO and COO
- 15.5. Company D
- 15.5.1. Company Snapshot
- 15.5.2. Interview Transcript: Founder / CEO
- 15.6. Company E
- 15.6.1. Company Snapshot
- 15.6.2. Interview Transcript: Research Scientist
16. IMPACT OF COVID-19 OUTBREAK ON AI IN MEDICAL IMAGING MARKET DYNAMICS
- 16.1. Chapter Overview
- 16.2. Evaluation of Impact of COVID-19 Pandemic
- 16.2.1. Current Initiatives and Recuperative Strategies of Key Players
- 16.2.2. Impact on Opportunity for AI in medical imaging in Medical Image Processing Market
- 16.3. Response Strategies: A Roots Analysis Perspective
- 16.3.1. Propositions for Immediate Implementation
- 16.3.2. Propositions for Short / Long Term Implementation
17. CONCLUSION
18. APPENDIX 1: TABULATED DATA
19. APPENDIX 2: LIST OF COMPANIES AND ORGANIZATIONS
List of Tables
- Table 3.1 Machine Learning: A Brief History
- Table 4.1 IBM: Artificial Intelligence Focused Acquisitions
- Table 4.2 Google: Artificial Intelligence Focused Acquisitions
- Table 4.3 IBM Watson: Partnerships and Collaborations in Healthcare
- Table 4.4 Google DeepMind: Partnerships and Collaborations in Healthcare
- Table 5.1 AI in medical imaging in Medical Image Processing Solutions: Information on Status of Development and Regulatory Approvals
- Table 5.2 AI in medical imaging in Medical Image Processing Solutions: Information on Type of Offering and Type of Image Processed
- Table 5.3 AI in medical imaging in Medical Image Processing Solutions: Information on Anatomical Region and Application Area
- Table 5.4 AI in medical imaging in Medical Image Processing Solutions: Information on Key Characteristics of Solutions and Affiliated Technologies
- Table 5.5 AI in medical imaging in Medical Image Processing (List of Companies): Information on Year of Establishment, Company Size, Location of Headquarters, Type of Deployment Model, Number of Solutions
- Table 6.1 List of Companies Profiled
- Table 6.2 Artelus: Company Overview
- Table 6.3 Artelus: Information on Medical Image Processing Solutions
- Table 6.4 Artelus: Recent Developments and Future Outlook
- Table 6.5 Arterys: Company Overview
- Table 6.6 Arterys: Information on Medical Image Processing Solutions
- Table 6.7 Arterys: Recent Developments and Future Outlook
- Table 6.8 Butterfly Network: Company Overview
- Table 6.9 Butterfly Network: Information on Medical Image Processing Solutions
- Table 6.10 Butterfly Network: Recent Developments and Future Outlook
- Table 6.11 ContextVision: Company Overview
- Table 6.12 ContextVision: Information on Medical Image Processing Solutions
- Table 6.13 ContextVision: Recent Developments and Future Outlook
- Table 6.14 Enlitic: Company Overview
- Table 6.15 Enlitic: Information on Medical Image Processing Solutions
- Table 6.16 Enlitic: Recent Developments and Future Outlook
- Table 6.17 Echonous: Company Overview
- Table 6.18 Echonous: Information on Medical Image Processing Solutions
- Table 6.19 Echonous: Recent Developments and Future Outlook
- Table 6.20 GE Healthcare: Company Overview
- Table 6.21 GE Healthcare: Information on Medical Image Processing Solutions
- Table 6.22 GE Healthcare: Recent Developments and Future Outlook
- Table 6.23 InferVision: Company Overview
- Table 6.24 InferVision: Information on Medical Image Processing Solutions
- Table 6.25 InferVision: Recent Developments and Future Outlook
- Table 6.26 VUNO: Company Overview
- Table 6.27 VUNO: Information on Medical Image Processing Solutions
- Table 6.28 VUNO: Recent Developments and Future Outlook
- Table 7.1 AI in medical imaging in Medical Image Processing: List of Partnerships and Collaborations
- Table 8.1 AI in medical imaging in Medical Image Processing: List of Funding and Investments
- Table 9.1 Company Valuation Analysis: Sample Dataset
- Table 9.2 Company Valuation Analysis: Weighted Average Valuation
- Table 9.3 Company Valuation Analysis: Estimated Valuation
- Table 9.4 Company Valuation Analysis: Distribution by Specialization
- Table 11.1 AI in medical imaging in Medical Image Processing, Patent Portfolio: IPCR Classification Symbol Definitions
- Table 11.2 AI in medical imaging in Medical Image Processing, Patent Portfolio: Most Popular IPCR Classification Symbols
- Table 11.3 AI in medical imaging in Medical Image Processing, Patent Portfolio: List of Top IPCR Classification Symbols
- Table 11.4 AI in medical imaging in Medical Image Processing, Patent Portfolio: Summary of Benchmarking Analysis
- Table 11.5 AI in medical imaging in Medical Image Processing, Patent Portfolio: Categorizations based on Weighted Valuation Scores
- Table 11.6 AI in medical imaging in Medical Image Processing, Patent Portfolio: List of Leading Patents (by Highest Relative Valuation)
- Table 12.1 Cost Saving Analysis: Information on Number of Radiologists in Various Countries
- Table 12.2 Cost Saving Analysis: Information on Yearly Count of X-Ray Scans across Different Geographical Regions (Million Scans)
- Table 12.3 Cost Saving Analysis: Information on Yearly Count of Ultrasound Scans across Different Geographical Regions (Million Scans)
- Table 12.4 Cost Saving Analysis: Information on Yearly Count of MRI Scans across Different Geographical Regions (Million Scans)
- Table 12.5 Cost Saving Analysis: Information on Yearly Count of CT scans across Different Geographical Regions (Million Scans)
- Table 13.1 AI in medical imaging in Medical Image Processing Solutions: Information on Adoption by Radiologists Across Different Geographical Regions
- Table 15.1 Advenio Technosys: Company Snapshot
- Table 15.2 Arterys: Company Snapshot
- Table 15.3 Arya.ai: Company Snapshot
- Table 15.4 AlgoSurg: Company Snapshot
- Table 15.5 Context Vision: Company Snapshot
- Table 18.1 IBM: Annual Revenues (USD Billion)
- Table 18.2 Alphabet: Annual Revenues (USD Billion)
- Table 18.3 AI in medical imaging in Medical Image Processing: Distribution by Status of Development
- Table 18.4 AI in medical imaging in Medical Image Processing: Distribution by Regulatory Approvals Received
- Table 18.5 AI in medical imaging in Medical Image Processing: Distribution by Type of Offering
- Table 18.6 AI in medical imaging in Medical Image Processing: Distribution by Type of Image Processed
- Table 18.7 AI in medical imaging in Medical Image Processing: Distribution by Anatomical Region
- Table 18.8 AI in medical imaging in Medical Image Processing: Distribution by Application Area
- Table 18.9 AI in medical imaging in Medical Image Processing Solution Developers: Distribution by Year of Establishment
- Table 18.10 AI in medical imaging in Medical Image Processing Solution Developers: Distribution by Company Size
- Table 18.11 AI in medical imaging in Medical Image Processing Solution Developers: Distribution by Location of Headquarters
- Table 18.12 AI in medical imaging in Medical Image Processing Solution Developers: Distribution by Type of Deployment Model
- Table 18.13 Leading AI in medical imaging in Medical Image Processing Solution Developers: Distribution by Number of Solutions
- Table 18.14 Partnerships and Collaborations: Distribution by Year of Partnership
- Table 18.15 Partnerships and Collaborations: Distribution by Type of Partnership
- Table 18.16 Partnerships and Collaborations: Distribution by Year and Type of Partnership
- Table 18.17 Partnerships and Collaborations: Distribution by Type of Partner
- Table 18.18 Partnerships and Collaborations: Distribution by Therapeutic Area
- Table 18.19 Most Active Players: Distribution by Number of Partnerships
- Table 18.20 Partnerships and Collaborations: Intercontinental and Intracontinental Agreements
- Table 18.21 Funding and Investments: Distribution of Instances by Year of Establishment of Companies and Type of Funding
- Table 18.22 Funding and Investments: Cumulative Year-wise Trend
- Table 18.23 Funding and Investments: Distribution by Number of Funding Instances and Amount Invested
- Table 18.24 Funding and Investments: Distribution by Type of Funding
- Table 18.25 Funding and Investments: Distribution by Type of Funding and Total Amount Invested (USD Million)
- Table 18.26 Most Active Players: Distribution by Number of Funding Instances and Amount of Funding (USD Million)
- Table 18.27 Most Active Companies: Summary of Funding Raised by Type of Funding and Amount of Funding (USD Million)
- Table 18.28 Most Active Investors: Distribution by Number of Funding Instances
- Table 18.29 Clinical Trial Analysis: Distribution by Trial Recruitment Status
- Table 18.30 Clinical Trial Analysis: Cumulative Distribution by Trial Registration Year
- Table 18.31 Clinical Trial Analysis: Distribution by Trial Recruitment Status and Trial Registration Year
- Table 18.32 Clinical Trial Analysis: Distribution by Trial Registration Year and Patient Enrollment
- Table 18.33 Clinical Trial Analysis: Distribution by Study Design
- Table 18.34 Clinical Trial Analysis: Distribution by Patient Segment
- Table 18.35 Clinical Trial Analysis: Distribution by Therapeutic Area
- Table 18.36 Clinical Trial Analysis: Distribution by Trial Objective
- Table 18.37 Clinical Trial Analysis: Distribution by Type of Image Processed
- Table 18.39 Clinical Trial Analysis: Distribution by Type of Sponsors / Collaborators
- Table 18.40 Leading Sponsors / Collaborators: Analysis by Number of Trials
- Table 18.41 AI in medical imaging in Medical Image Processing, Patent Portfolio: Distribution by Type of Patent
- Table 18.42 AI in medical imaging in Medical Image Processing, Patent Portfolio: Distribution by Application Year and Publication Year
- Table 18.43 AI in medical imaging in Medical Image Processing, Patent Portfolio: Distribution by Issuing Authority / Patent Offices Involved
- Table 18.44 AI in medical imaging in Medical Image Processing, Patent Portfolio: North America
- Table 18.45 AI in medical imaging in Medical Image Processing, Patent Portfolio: Europe
- Table 18.46 AI in medical imaging in Medical Image Processing, Patent Portfolio: Asia Pacific and RoW
- Table 18.47 AI in medical imaging in Medical Image Processing, Patent Portfolio: Leading Assignees (Industry Players)
- Table 18.48 AI in medical imaging in Medical Image Processing, Patent Portfolio: Leading Assignees (Non-Industry Players)
- Table 18.49 AI in medical imaging in Medical Image Processing, Patent Portfolio: Distribution by Patent Age
- Table 18.50 AI in medical imaging in Medical Image Processing, Patent Portfolio: Valuation Analysis
- Table 18.51 AI in medical imaging in Medical Image Processing: Efficiency Profile of Radiologists
- Table 18.52 Overall Cost Saving Potential of AI in medical imaging in Medical Image Processing Solutions: Growth Scenarios
- Table 18.53 Overall Cost Saving Potential of AI in medical imaging in Medical Image Processing Solutions (X-Ray Images), Till 2035 (USD Billion)
- Table 18.54 Cost Saving Potential of AI in medical imaging in Medical Image Processing Solutions (X-Ray Images) in North America, Till 2035 (USD Billion)
- Table 18.55 Cost Saving Potential of AI in medical imaging in Medical Image Processing Solutions (X-Ray Images) in Europe, Till 2035 (USD Billion)
- Table 18.56 Cost Saving Potential of AI in medical imaging in Medical Image Processing Solutions (X-Ray Images) in Asia Pacific and RoW, Till 2035 (USD Billion)
- Table 18.57 Cost Saving Potential of AI in medical imaging-based Medical Image Processing Solutions (X-Ray Images) in High Income Countries, Till 2035 (USD Billion)
- Table 18.58 Cost Saving Potential of AI in medical imaging-based Medical Image Processing Solutions (X-Ray Images) in Middle Income Countries, Till 2035 (USD Billion)
- Table 18.59 Overall Cost Saving Potential of AI in medical imaging in Medical Image Processing Solutions (MRI Images), Till 2035 (USD Billion)
- Table 18.60 Cost Saving Potential of AI in medical imaging in Medical Image Processing Solutions (MRI Images) in North America, Till 2035 (USD Billion)
- Table 18.61 Cost Saving Potential of AI in medical imaging in Medical Image Processing Solutions (MRI Images) in Europe, Till 2035 (USD Billion)
- Table 18.62 Cost Saving Potential of AI in medical imaging in Medical Image Processing Solutions (MRI Images) in Asia Pacific and RoW, Till 2035 (USD Billion)
- Table 18.63 Cost Saving Potential of AI in medical imaging-based Medical Image Processing Solutions (MRI Images) in High Income Countries, Till 2035 (USD Billion)
- Table 18.64 Cost Saving Potential of AI in medical imaging-based Medical Image Processing Solutions (MRI Images) in Middle Income Countries, Till 2035 (USD Billion)
- Table 18.65 Overall Cost Saving Potential of AI in medical imaging in Medical Image Processing Solutions (CT Images), Till 2035 (USD Billion)
- Table 18.66 Cost Saving Potential of AI in medical imaging in Medical Image Processing Solutions (CT Images) in North America, Till 2035 (USD Billion)
- Table 18.67 Cost Saving Potential of AI in medical imaging in Medical Image Processing Solutions (CT Images) in Europe, Till 2035 (USD Billion)
- Table 18.68 Cost Saving Potential of AI in medical imaging in Medical Image Processing Solutions (CT Images) in Asia Pacific and RoW, Till 2035 (USD Billion)
- Table 18.69 Cost Saving Potential of AI in medical imaging-based Medical Image Processing Solutions (CT Images) in High Income Countries, Till 2035 (USD Billion)
- Table 18.70 Cost Saving Potential of AI in medical imaging-based Medical Image Processing Solutions (CT Images) in Middle Income Countries, Till 2035 (USD Billion)
- Table 18.71 Overall Cost Saving Potential of AI in medical imaging in Medical Image Processing Solutions (Ultrasound Images), Till 2035 (USD Billion)
- Table 18.72 Cost Saving Potential of AI in medical imaging in Medical Image Processing Solutions (Ultrasound Images) in North America, Till 2035 (USD Billion)
- Table 18.73 Cost Saving Potential of AI in medical imaging in Medical Image Processing Solutions (Ultrasound Images) in Europe, Till 2035 (USD Billion)
- Table 18.74 Cost Saving Potential of AI in medical imaging in Medical Image Processing Solutions (Ultrasound Images) in Asia Pacific and RoW, Till 2035 (USD Billion)
- Table 18.75 Cost Saving Potential of AI in medical imaging-based Medical Image Processing Solutions (Ultrasound Images) in High Income Countries, Till 2035 (USD Billion)
- Table 18.76 Cost Saving Potential of AI in medical imaging-based Medical Image Processing Solutions (Ultrasound Images) in Middle Income Countries, Till 2035 (USD Billion)
- Table 18.77 Overall AI in medical imaging in Medical Image Processing Market, Conservative, Base and Optimistic Scenarios, Till 2035 (USD Million)
- Table 18.78 AI in medical imaging in Medical Image Processing Market: Distribution by Application Area, Conservative, Base and Optimistic Scenarios, Till 2035 (USD Million)
- Table 18.79 AI in medical imaging in Medical Image Processing Market for Brain Abnormalities / Neurological Disorders, Conservative, Base and Optimistic Scenarios, Till 2035 (USD Million)
- Table 18.80 AI in medical imaging in Medical Image Processing Market for Cardiac Abnormalities / Cardiovascular Disorders, Conservative, Base and Optimistic Scenarios, Till 2035 (USD Million)
- Table 18.81 AI in medical imaging in Medical Image Processing Market for Breast Cancer, Conservative, Base and Optimistic Scenarios, Till 2035 (USD Million)
- Table 18.82 AI in medical imaging in Medical Image Processing Market for Bone Deformities / Orthopedic Disorders, Conservative, Base and Optimistic Scenarios, Till 2035 (USD Million)
- Table 18.83 AI in medical imaging in Medical Image Processing Market for Lung Infections / Lung Disorders, Conservative, Base and Optimistic Scenarios, Till 2035 (USD Million)
- Table 18.84 AI in medical imaging in Medical Image Processing Market for Other Disorders, Conservative, Base and Optimistic Scenarios, Till 2035 (USD Million)
- Table 18.85 AI in medical imaging in Medical Image Processing Market: Distribution by Type of Image Processed, Conservative, Base and Optimistic Scenarios, Conservative, Base and Optimistic Scenarios, Till 2035 (USD Million)
- Table 18.86 AI in medical imaging in Medical Image Processing Market for X-Rays, Conservative, Base and Optimistic Scenarios, Conservative, Base and Optimistic Scenarios, Till 2035 (USD Million)
- Table 18.87 AI in medical imaging in Medical Image Processing Market for MRI, Conservative, Base and Optimistic Scenarios, Till 2035 (USD Million)
- Table 18.88 AI in medical imaging in Medical Image Processing Market for CT, Conservative, Base and Optimistic Scenarios, Till 2035 (USD Million)
- Table 18.89 AI in medical imaging in Medical Image Processing Market for Ultrasound, Conservative, Base and Optimistic Scenarios, Till 2035 (USD Million)
- Table 18.90 AI in medical imaging in Medical Image Processing Market: Distribution by Key Geographical Regions, Conservative, Base and Optimistic Scenarios, Till 2035 (USD Million)
- Table 18.91 AI in medical imaging in Medical Image Processing Market in North America, Conservative, Base and Optimistic Scenarios, Till 2035 (USD Million)
- Table 18.92 AI in medical imaging in Medical Image Processing Market in Europe, Conservative, Base and Optimistic Scenarios, Till 2035 (USD Million)
- Table 18.93 AI in medical imaging in Medical Image Processing Market in Asia Pacific / RoW, Conservative, Base and Optimistic Scenarios, Till 2035 (USD Million)
- Table 18.94 Opportunity for AI in medical imaging in Medical Image Processing Market, Till 2035 (COVID Impact Scenario)
List of Figures
- Figure 3.1 Key Stages of Observational Learning
- Figure 3.2 Understanding Neurons and the Human Brain: Key Scientific Contributions
- Figure 3.3 Big Data: The Three V's
- Figure 3.4 Internet of Things: Framework
- Figure 3.5 Internet of Things: Applications in Healthcare
- Figure 3.6 Big Data: Google Trends
- Figure 3.7 Big Data: Application Areas
- Figure 3.8 Big Data: Opportunities in Healthcare
- Figure 3.9 Machine Learning Algorithm: Workflow
- Figure 3.10 Machine Learning Algorithms: Timeline
- Figure 3.11 Neural Networks: Architecture
- Figure 3.12 AI in medical imaging: Image Recognition
- Figure 3.13 Google Trends: Artificial Intelligence versus Machine Learning versus AI in medical imaging versus Cognitive Computing
- Figure 3.14 Google Trends: Popular Keywords (AI in medical imaging)
- Figure 3.15 AI in medical imaging Frameworks: Relative Performance
- Figure 3.16 Personalized Medicine: Applications in Healthcare
- Figure 4.17 IBM: Annual Revenues (USD Billion)
- Figure 4.18 Alphabet: Annual Revenues (USD Billion)
- Figure 5.1 AI in medical imaging in Medical Image Processing: Distribution by Status of Development
- Figure 5.2 AI in medical imaging in Medical Image Processing: Distribution by Regulatory Approvals Received
- Figure 5.3 AI in medical imaging in Medical Image Processing: Distribution by Type of Offering
- Figure 5.4 AI in medical imaging in Medical Image Processing: Distribution by Type of Image Processed
- Figure 5.5 AI in medical imaging in Medical Image Processing: Distribution by Anatomical Region
- Figure 5.6 AI in medical imaging in Medical Image Processing: Distribution by Application Area
- Figure 5.6 Grid Representation: Distribution by Type of Offering, Type of Image Processed and Application Area
- Figure 5.7 AI in medical imaging in Medical Image Processing Solution Developers: Distribution by Year of Establishment
- Figure 5.8 AI in medical imaging in Medical Image Processing Solution Developers: Distribution by Company Size
- Figure 5.9 AI in medical imaging in Medical Image Processing Solution Developers: Distribution by Location of Headquarters
- Figure 5.10 World Map Representation: Regional Activity of AI in medical imaging in Medical Image Processing Solution Developers
- Figure 5.11 AI in medical imaging in Medical Image Processing Solution Developers: Distribution by Type of Deployment Model
- Figure 5.12 Leading AI in medical imaging in Medical Image Processing Solution Developers: Distribution by Number of Solutions
- Figure 7.1 Partnerships and Collaborations: Distribution by Year of Partnership
- Figure 7.2 Partnerships and Collaborations: Distribution by Type of Partnership
- Figure 7.3 Partnerships and Collaborations: Distribution by Year and Type of Partnership
- Figure 7.4 Partnerships and Collaborations: Distribution by Type of Partner
- Figure 7.5 Partnerships and Collaborations: Distribution by Therapeutic Area
- Figure 7.6 Most Active Players: Distribution by Number of Partnerships
- Figure 7.7 Partnerships and Collaborations: Regional Distribution
- Figure 7.8 Partnerships and Collaborations: Intercontinental and Intracontinental Agreements
- Figure 7.9 Partnerships and Collaborations: Summary of Partnership Activity
- Figure 8.1 Funding and Investments: Distribution of Instances by Year of Establishment of Companies and Type of Funding
- Figure 8.2 Funding and Investments: Cumulative Year-wise Trend
- Figure 8.3 Funding and Investments: Distribution by Number of Funding Instances and Amount Invested
- Figure 8.4 Funding and Investments: Distribution by Type of Funding
- Figure 8.5 Funding and Investments: Distribution by Type of Funding and Total Amount Invested (USD Million)
- Figure 8.6 Most Active Players: Distribution by Number of Funding Instances and Amount of Funding (USD Million)
- Figure 8.7 Most Active Companies: Summary of Funding Raised by Type of Funding and Amount of Funding (USD Million)
- Figure 8.8 Most Active Investors: Distribution by Number of Funding Instances
- Figure 8.9 Funding and Investments: Geographical Distribution by Amount Invested (USD Million)
- Figure 9.1 Company Valuation Analysis: A/F Ratio, Input Dataset
- Figure 9.2 Company Valuation Analysis: A/Y Ratio, Input Dataset
- Figure 9.3 Company Valuation Analysis: A/E Ratio, Input Dataset
- Figure 9.4 Company Valuation Analysis: Categorization by Twitter Followers Score
- Figure 9.5 Company Valuation Analysis: Categorization by Google Hits Score
- Figure 9.6 Company Valuation Analysis: Categorization by Partnerships Score
- Figure 9.7 Company Valuation Analysis: Categorization by Weighted Average Score
- Figure 9.8 Company Valuation Analysis: Unicorns in AI in medical imaging in Medical Image Processing Sector
- Figure 10.1 Clinical Trial Analysis: Distribution by Trial Recruitment Status
- Figure 10.2 Clinical Trial Analysis: Cumulative Distribution by Trial Registration Year
- Figure 10.3 Clinical Trial Analysis: Distribution by Trial Recruitment Status and Trial Registration Year
- Figure 10.4 Clinical Trial Analysis: Distribution by Trial Registration Year and Patient Enrollment
- Figure 10.5 Clinical Trial Analysis: Distribution by Study Design
- Figure 10.6 Clinical Trial Analysis: Distribution by Patient Segment
- Figure 10.7 Clinical Trial Analysis: Distribution by Therapeutic Area
- Figure 10.8 Clinical Trial Analysis: Distribution by Trial Objective
- Figure 10.9 Clinical Trial Analysis: Focus Areas
- Figure 10.10 Clinical Trial Analysis: Distribution by Type of Image Processed
- Figure 10.11 Clinical Trial Analysis: Distribution by Type of Sponsors / Collaborators
- Figure 10.12 Leading Sponsors / Collaborators: Analysis by Number of Trials
- Figure 10.13 Clinical Trial Analysis: Geographical Distribution of Trials
- Figure 10.14 Clinical Trial Analysis: Geographical Distribution of Trials and Patient Population
- Figure 11.1 AI in medical imaging in Medical Image Processing, Patent Portfolio: Distribution by Type of Patent
- Figure 11.2 AI in medical imaging in Medical Image Processing, Patent Portfolio: Distribution by Application Year and Publication Year
- Figure 11.3 AI in medical imaging in Medical Image Processing, Patent Portfolio: Distribution by Issuing Authority / Patent Offices Involved
- Figure 11.4 AI in medical imaging in Medical Image Processing, Patent Portfolio: North America
- Figure 11.5 AI in medical imaging in Medical Image Processing, Patent Portfolio: Europe
- Figure 11.6 AI in medical imaging in Medical Image Processing, Patent Portfolio: Asia Pacific and RoW
- Figure 11.7 AI in medical imaging in Medical Image Processing, Patent Portfolio: Distribution by IPCR Symbols
- Figure 11.8 AI in medical imaging in Medical Image Processing, Patent Portfolio: Focus Areas
- Figure 11.9 AI in medical imaging in Medical Image Processing, Patent Portfolio: Leading Assignees (Industry Players)
- Figure 11.10 AI in medical imaging in Medical Image Processing, Patent Portfolio: Leading Assignees (Non-Industry Players)
- Figure 11.11 AI in medical imaging in Medical Image Processing, Patent Portfolio: Leading Industry Players (Benchmarking by Patent Characteristics)
- Figure 11.12 AI in medical imaging in Medical Image Processing, Patent Portfolio: Distribution by Patent Age
- Figure 11.13 AI in medical imaging in Medical Image Processing, Patent Portfolio: Valuation Analysis
- Figure 12.1 AI in medical imaging in Medical Image Processing: Efficiency Profile of Radiologists
- Figure 12.2 Overall Cost Saving Potential of AI in medical imaging in Medical Image Processing Solutions: Growth Scenarios
- Figure 12.3 Overall Cost Saving Potential of AI in medical imaging in Medical Image Processing Solutions (X-Ray Images), Till 2035 (USD Billion)
- Figure 12.4 Cost Saving Potential of AI in medical imaging in Medical Image Processing Solutions (X-Ray Images) in North America, Till 2035 (USD Billion)
- Figure 12.5 Cost Saving Potential of AI in medical imaging in Medical Image Processing Solutions (X-Ray Images) in Europe, Till 2035 (USD Billion)
- Figure 12.6 Cost Saving Potential of AI in medical imaging in Medical Image Processing Solutions (X-Ray Images) in Asia Pacific and RoW, Till 2035 (USD Billion)
- Figure 12.7 Cost Saving Potential of AI in medical imaging-based Medical Image Processing Solutions (X-Ray Images) in High Income Countries, Till 2035 (USD Billion)
- Figure 12.8 Cost Saving Potential of AI in medical imaging-based Medical Image Processing Solutions (X-Ray Images) in Middle Income Countries, Till 2035 (USD Billion)
- Figure 12.9 Overall Cost Saving Potential of AI in medical imaging in Medical Image Processing Solutions (MRI Images), Till 2035 (USD Billion)
- Figure 12.10 Cost Saving Potential of AI in medical imaging in Medical Image Processing Solutions (MRI Images) in North America, Till 2035 (USD Billion)
- Figure 12.11 Cost Saving Potential of AI in medical imaging in Medical Image Processing Solutions (MRI Images) in Europe, Till 2035 (USD Billion)
- Figure 12.12 Cost Saving Potential of AI in medical imaging in Medical Image Processing Solutions (MRI Images) in Asia Pacific and RoW, Till 2035 (USD Billion)
- Figure 12.13 Cost Saving Potential of AI in medical imaging-based Medical Image Processing Solutions (MRI Images) in High Income Countries, Till 2035 (USD Billion)
- Figure 12.14 Cost Saving Potential of AI in medical imaging-based Medical Image Processing Solutions (MRI Images) in Middle Income Countries, Till 2035 (USD Billion)
- Figure 12.15 Overall Cost Saving Potential of AI in medical imaging in Medical Image Processing Solutions (CT Images), Till 2035 (USD Billion)
- Figure 12.16 Cost Saving Potential of AI in medical imaging in Medical Image Processing Solutions (CT Images) in North America, Till 2035 (USD Billion)
- Figure 12.17 Cost Saving Potential of AI in medical imaging in Medical Image Processing Solutions (CT Images) in Europe, Till 2035 (USD Billion)
- Figure 12.18 Cost Saving Potential of AI in medical imaging in Medical Image Processing Solutions (CT Images) in Asia Pacific and RoW, Till 2035 (USD Billion)
- Figure 12.19 Cost Saving Potential of AI in medical imaging-based Medical Image Processing Solutions (CT Images) in High Income Countries, Till 2035 (USD Billion)
- Figure 12.20 Cost Saving Potential of AI in medical imaging-based Medical Image Processing Solutions (CT Images) in Middle Income Countries, Till 2035 (USD Billion)
- Figure 12.21 Overall Cost Saving Potential of AI in medical imaging in Medical Image Processing Solutions (Ultrasound Images), Till 2035 (USD Billion)
- Figure 12.22 Cost Saving Potential of AI in medical imaging in Medical Image Processing Solutions (Ultrasound Images) in North America, Till 2035 (USD Billion)
- Figure 12.23 Cost Saving Potential of AI in medical imaging in Medical Image Processing Solutions (Ultrasound Images) in Europe, Till 2035 (USD Billion)
- Figure 12.24 Cost Saving Potential of AI in medical imaging in Medical Image Processing Solutions (Ultrasound Images) in Asia Pacific and RoW, Till 2035 (USD Billion)
- Figure 12.25 Cost Saving Potential of AI in medical imaging-based Medical Image Processing Solutions (Ultrasound Images) in High Income Countries, Till 2035 (USD Billion)
- Figure 12.26 Cost Saving Potential of AI in medical imaging-based Medical Image Processing Solutions (Ultrasound Images) in Middle Income Countries, Till 2035 (USD Billion)
- Figure 13.1 Overall AI in medical imaging in Medical Image Processing Market, Till 2035 (USD Million)
- Figure 13.2 AI in medical imaging in Medical Image Processing Market: Distribution by Application Area, Till 2035 (USD Million)
- Figure 13.3 AI in medical imaging in Medical Image Processing Market for Brain Abnormalities / Neurological Disorders, Till 2035 (USD Million)
- Figure 13.4 AI in medical imaging in Medical Image Processing Market for Cardiac Abnormalities / Cardiovascular Disorders, Till 2035 (USD Million)
- Figure 13.5 AI in medical imaging in Medical Image Processing Market for Breast Cancer, Till 2035 (USD Million)
- Figure 13.6 AI in medical imaging in Medical Image Processing Market for Bone Deformities / Orthopedic Disorders, Till 2035 (USD Million)
- Figure 13.7 AI in medical imaging in Medical Image Processing Market for Lung Infections / Lung Disorders, Till 2035 (USD Million)
- Figure 13.8 AI in medical imaging in Medical Image Processing Market for Other Disorders, Till 2035 (USD Million)
- Figure 13.9 AI in medical imaging in Medical Image Processing Market: Distribution by Type of Image Processed, Till 2035 (USD Million)
- Figure 13.10 AI in medical imaging in Medical Image Processing Market for X-Rays, Till 2035 (USD Million)
- Figure 13.11 AI in medical imaging in Medical Image Processing Market for MRI, Till 2035 (USD Million)
- Figure 13.12 AI in medical imaging in Medical Image Processing Market for CT, Till 2035 (USD Million)
- Figure 13.13 AI in medical imaging in Medical Image Processing Market for Ultrasound, Till 2035 (USD Million)
- Figure 13.14 AI in medical imaging in Medical Image Processing Market: Distribution by Key Geographical Regions, Till 2035 (USD Million)
- Figure 13.15 AI in medical imaging in Medical Image Processing Market in North America, Till 2035 (USD Million)
- Figure 13.16 AI in medical imaging in Medical Image Processing Market in Europe, Till 2035 (USD Million)
- Figure 13.17 AI in medical imaging in Medical Image Processing Market in Asia Pacific / RoW, Till 2035 (USD Million)
- Figure 13.18 Concluding Remarks
- Figure 14.1 AI in medical imaging in Healthcare: Other Expert Insights
- Figure 16.1 Opportunity for AI in medical imaging in Medical Image Processing Market, Till 2035 (COVID Impact Scenario)
- Figure 17.1 Concluding Remarks: Current Market Landscape
- Figure 17.2 Concluding Remarks: Partnerships and Collaborations
- Figure 17.3 Concluding Remarks: Funding and Investments
- Figure 17.4 Concluding Remarks: Company Valuation
- Figure 17.5 Concluding Remarks: Clinical Trials
- Figure 17.6 Concluding Remarks: Patents
- Figure 17.7 Concluding Remarks: Cost Saving Potential
- Figure 17.8 Concluding Remarks: Market Forecast and Opportunity
 全球內視鏡人工智慧(AI)市場全球分類系統市場
 南美的AI支援醫療影像市場
 歐洲的AI支援醫療影像市場:2025年
 醫療圖像AI的全球市場(2025年):第1卷 - 市場分析與預測,第2卷 - 企業概要
 2025-2029年全球醫療圖像人工智慧市場
 醫療診斷市場中的人工智慧,按產品類型、按模式、按應用、按最終用戶、按國家和地區分類 - 2025 年至 2032 年全球行業分析、市場規模、市場佔有率和預測
 2025年整形外科人工智慧(AI)全球市場報告
 2032 年醫療診斷影像市場人工智慧 (AI) 預測:按顯像模式、AI 類型、臨床領域、部署模型、組件、應用、最終用戶和地區進行全球分析電腦輔助複合材料規劃中的人工智慧(AI)全球市場