


 |
市場調查報告書
商品編碼
1771293
KRAS市場:產業趨勢和全球預測 - 各適應症,各分子類型,治療類別,各給藥途徑,主要各地區KRAS Market: Industry Trends and Global Forecasts - Distribution by Type of Indication, Type of Molecule, Type of Therapy, Route of Administration and Key Geographical Regions |
||||||
全球 KRAS 市場:概覽
今年全球 KRAS 市場規模達 7,300 萬美元。預計預測期內,該市場的複合年增長率將達到 53.6%。
市場區隔與機會分析依下列參數細分:
適應症類型
- 急性骨髓性白血病
- 大腸癌症
- 頭頸椎癌症
- 肺癌症
- 卵巢癌症
- 胰臟癌症
- Phelan-McDermid 症候群
- 皮膚癌症
分子類型
- 生物製藥
- 低分子
治療類型
- 單劑療法
- 聯合治療
給藥途徑
- 靜脈注射
- 肌肉內給藥
- 皮內
- 眼內
- 腹腔內
- 口服
- 皮下
主要地區
- 北美
- 歐洲
- 亞太地區
- 中東·北非
- 南美
全球KRA市場:成長與趨勢
癌症是心血管疾病後的第二大死因,佔全球已通報死亡人數的六分之一。根據國際癌症研究機構 (IARC) 的數據,預計到 2040 年,全球新增癌症病例將增加至 2,750 萬人。癌症高死亡率的主要原因是診斷往往延誤,從而導致治療延誤,大大降低了患者的生存機會。
由於傳統療法在治療RAS突變癌症方面未能顯示出顯著療效,專門針對RAS基因的新型藥物已成為有希望的選擇。事實上,該領域的藥物開發者越來越專注於開發針對特定癌症基因突變的療法,這些突變是疾病發生和進展的主要原因。值得注意的是,RAS曾被認為是無法治癒的靶點,但它與30%的人類癌症有關。多年來,許多專門針對RAS突變基因的候選藥物已被研究。此外,在令人鼓舞的臨床試驗結果、大量資金投入以及對標靶治療日益增長的需求的推動下,RAS靶向治療市場預計將在未來十年穩步增長。
全球 KRAS 市場:關鍵洞察
本報告分析了全球 KRAS 市場的現狀,並探討了潛在的成長機會。報告的主要發現包括:
- 目前,多家公司聲稱正在開髮用於治療 RAS 突變引起的各種癌症的新型候選藥物。
- 大多數新型候選藥物在開發早期階段進行評估,並以單一藥物或與其他產品合併使用,並透過各種給藥途徑給藥。
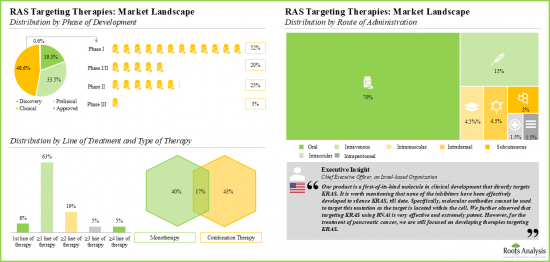
- 超過 70% 的治療藥物在臨床前和臨床階段以單一藥物或與其他產品合併使用的方式進行評估。大多數針對 RAS 的治療藥物 (79%) 設計為口服給藥。
- 為了獲得競爭優勢,各地區的公司都在積極投入資源和資金,用於研發自主研發的產品。
- 近年來,各地區與此類新型療法相關的臨床試驗數量顯著增加。
- 據報道,就註冊試驗數量而言,臨床研究活動在過去三年中以 5% 的複合年增長率增長。在全部試驗中,近 25% 已經完成,而 60% 仍在進行中並仍在招募患者。
- 近年來,許多公司已經結成策略聯盟,以開發新型小分子候選藥物。
- 大部分是產品授權協議,佔總數的30%以上。
- 過去五年,許多公私投資者希望獲得豐厚回報,在多輪融資中投資了該公司。
- 其中近6億美元來自創投,約佔總額的40%。同時,據報導有超過五家公司進行了IPO/上市,這些公司共籌集超過7.75億美元。
- 過去和正在進行的研究重點是癌症治療。
- 去年,隸屬於認可大學的作者(80%)大多發表了以KRAS為重點的論文。
- 過去幾年,以RAS標靶治療為重點的論文(包括研究論文)數量急劇增加。
- 從已發表的論文/文章可以看出,目前的研究活動主要集中在針對RAS亞型,主要是突變的KRAS基因。
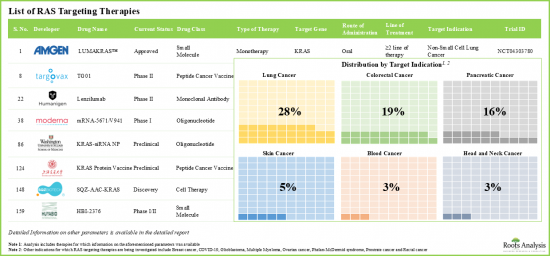
- 大多數出版品關注的是針對大腸直腸癌、肺癌和胰臟癌的RAS標靶治療。
- 為了充分實現其獨特產品的商業化,藥物開發商正在產品上市週期的各個階段積極探索各種商業化策略。
- 受日益加重的癌症負擔和對標靶藥物治療需求的推動,RAS標靶治療市場預計將在未來十年呈現可觀的成長率。
- 預計整體市場機會將涵蓋各種類型的治療藥物和給藥途徑。
KRAS市場參與企業案例
- Amgen
- GlobeImmune
- Jacobio Pharmaceuticals
- Mirati Therapeutics
- Novartis
- Onconova Therapeutics
- Targovax
- Verastem Oncology.
全球KRAS市場
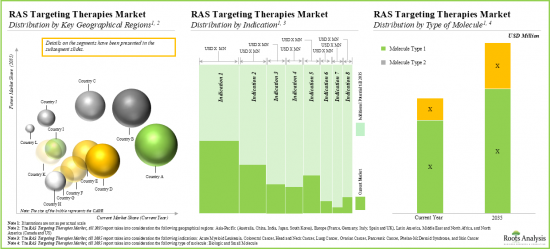
- 市場規模與機會分析:本報告對全球 KRAS 市場進行了詳細分析,重點關注以下關鍵細分市場:[A] 適應症類型、[B] 分子類型、[C] 療法類型、[D] 給藥途徑和 [E] 重點區域。
- 市場模式:對 RAS 標靶療法進行全面評估,考慮了 A] 開發現狀、[B] 開發階段、[C] 分子類型、[D] 療法類型、[E] 目標治療領域、[F] 目標基因、[G] 治療線、[H] 給藥途徑等多項參數。此外,本報告還基於 [A] 成立年份、[B] 員工人數、[C] 地理位置等多項相關參數,對從事 RAS 標靶療法開發的公司進行了全面評估。
- 臨床試驗分析:基於多個相關參數,對各種 RAS 標靶療法的臨床試驗進行詳細分析,這些參數包括 A] 臨床試驗註冊年份、[B] 臨床試驗階段、[C] 臨床試驗招募狀態、[D] 入組患者人群、[E] 試驗設計、[F] 主要行業申辦者/合作者、[G] 臨床適應症、H臨床試驗的區域分佈等。
- 產品競爭分析:透過考慮 A] 公司規模、[B] 先導分子開發階段等因素,對參與 KRAS 市場的主要公司進行深入的競爭分析(基於其各自開發產品組合的實力)。
- 公司簡介:提供 RAS 標靶療法的公司的詳細簡介,重點關注 A] 公司概況、[B] 產品組合、[C] 最新發展和明智的未來展望。
- 出版物分析:基於 A] 出版年份、[B] 重點領域、[C] 分子類型、[D] 熱門關鍵字和 [E] 領先期刊,對約 1,600 篇與 RAS 標靶治療研究相關的同行評審科學論文進行全面分析。
- 合作關係與協作:基於 A] 合作年份、[B] 合作類型、[C] 分子類型、[D] 最活躍的參與者(已達成的合作夥伴關係數量)、[E] 合作活動的區域分佈等多個參數,對該領域利益相關者達成的交易進行深入分析。
- 資金與投資:對各種投資進行詳細分析,例如 A] 創投、[B] 債務融資、[C] 撥款/獎勵、[D] 首次公開發行 (IPO) 融資、[E] 服務於 KRAS 市場的參與者隨後進行的公開發行 (IPO)。
- 關鍵商業化策略:詳細介紹 KRAS 市場藥物開發商在市場發展的各個階段(包括上市前、上市/上市中以及上市後)所採用的各種商業化策略。
- RAS 標靶治療概述
- 針對突變 RAS 基因的方法
- 值得注意的歷史發展
- RAS 突變癌症中值得注意的基因驅動相關突變
- RAS 突變癌症治療的課題與未來前景
- RAS標靶治療:開發平台評估
- RAS標靶治療:開發形勢
- RAS標靶治療:臨床試驗一覽
- 產品競爭力:北美
- 產品競爭力:歐洲
- 產品競爭力:亞太地區
- Amgen
- GlobeImmune
- Jacobio Pharmaceuticals
- Mirati Therapeutics
- Novartis
- Onconova Therapeutics
- Targovax
- Verastem Oncology
- RAS標靶治療:最近的出版物
- RAS標靶治療:夥伴關係和合作的清單
- RAS標靶治療:資金籌措與投資
- 預測研究方法與關鍵假設
- 2035年全球RAS標靶治療市場
- 2035年全球RAS標靶治療市場(依適應症劃分)
- 2035年全球RAS標靶治療市場(依分子類型劃分)
- 2035年全球RAS標靶治療市場(依治療類型劃分)
- 2035年全球RAS標靶治療市場(依給藥途徑劃分)
- 2035年全球RAS標靶治療市場(按地區劃分)
- RAS標靶治療:單一產品銷售預測
- LUMAKRASTM(安進):銷售額預測
- Adagrasib(Mirati Therapeutics):銷售額預測
- AMO-01(AMO Pharma):銷售額預測
- Antroquinonol (Golden Biotech): 銷售預測
- Binimetinib (Array Biopharma): 銷售預測
- CH7126766/VS6766 (Verastem Oncology): 銷售預測
- LXH274 (Novartis): 銷售預測
- Rigosertib (Onconova Therapeutics): 銷售預測
- RMC-4630 (Revolution Medicine): 銷售預測
- TG01 (Targovax): 銷售預測
- Tipifarnib (Kura Oncology): 銷售預測
- siG12D (Silenseed): 銷售預測
全球 KRAS 市場
本報告概述了全球 KRAS 市場,關鍵細分領域包括適應症、分子類型、治療類型、給藥途徑、區域趨勢和公司概況。
目錄
第1章 序文
第2章 摘要整理
第3章 簡介
第4章 目前的市場情勢
第5章 與臨床試驗端點分析
第6章 產品競爭力分析
第7章 企業簡介
第8章 出版物的分析
第9章 夥伴關係和合作
第10章 與資金籌措投資分析
第11章 主要商業化策略
第12章 市場規模的評估與機會分析
第13章 結論
第14章 附錄1:表格形式資料
第15章 附錄2:企業·團體一覽
GLOBAL KRAS MARKET: OVERVIEW
As per Roots Analysis, the global KRAS market valued at USD 73 million in the current year is expected to grow at a CAGR of 53.6% during the forecast period.
The market sizing and opportunity analysis has been segmented across the following parameters:
Type of Indication
- Acute Myeloid Leukemia
- Colorectal Cancer
- Head and Neck Cancer
- Lung Cancer
- Ovarian Cancer
- Pancreatic Cancer
- Phelan-McDermid Syndrome
- Skin Cancer
Type of Molecule
- Biologic
- Small Molecule
Type of Therapy
- Monotherapy
- Combination Therapy
Route of Administration
- Intravenous
- Intramuscular
- Intradermal
- Intraocular
- Intraperitoneal
- Oral
- Subcutaneous
Key Geographical Regions
- North America
- Europe
- Asia-Pacific
- Middle East and North Africa
- Latin America
GLOBAL KRAS MARKET: GROWTH AND TRENDS
Cancer is considered to be the second leading cause of mortality, after cardiovascular diseases, accounting for every sixth reported death in the world. The International Agency for Research on Cancer (IARC) states that the number of new cancer cases is expected to grow to 27.5 million across the globe, by 2040. A major factor contributing to the high mortality rate associated with this condition is the tendency for late diagnosis, which in turn delays treatment and significantly reduces the patient's chances of survival.
Given that conventional therapies have been unable to exhibit significant efficacy in the treatment of RAS mutated cancers, novel drugs, specifically targeting the RAS gene, have emerged as a promising alternative. In fact, drug developers in this field are increasingly focusing on creating therapies that target specific oncogenic mutations primarily responsible for the onset and progression of the disease. Notably, RAS which was once considered to be an undruggable target, has been linked to 30% of human cancer. Over the years, numerous drug candidates have been investigated to specifically target RAS-mutated genes. Additionally, driven by encouraging clinical trial results, substantial financial assistance, and growing demand for targeted therapeutic modalities, the RAS targeting therapies market is anticipated to witness steady growth over the next decade
GLOBAL KRAS MARKET: KEY INSIGHTS
The report delves into the current state of global KRAS market and identifies potential growth opportunities within industry. Some key findings from the report include:
- Presently, several companies claim to be engaged in the development of novel drug candidates for the treatment of various cancers originating due to RAS mutations.
- Most of the drug candidates are being evaluated in early stages of development, either as monotherapies or in combination with other products, for delivery via different administration routes.
- Over 70% of the therapies are being evaluated across preclinical and clinical stages, either as monotherapies or in combination with other products. Majority of the RAS targeting therapies (79%) are designed for administration via the oral route.
- In pursuit of gaining a competitive edge, firms located in different regions are actively investing, in terms of both resources and capital, to conduct R&D of their proprietary products.
- Over the years, there has been significant increase in number of clinical trials related to this novel class of therapies, across different geographies.
- Clinical research activity, in terms of the number of trials registered, is reported to have increased at a CAGR of 5%, in the past three years. Of the total number of trials, close to 25% of the studies have already been completed, while 60% are active and still recruiting patients.
- In recent years, a large number of companies have recently entered into strategic collaborations for the development of novel small molecule candidates.
- Majority of the deals were reported to be product licensing agreements, representing over 30% of the total number of instances.
- Foreseeing lucrative returns, many public and private investors have made investments across several funding rounds, in the last five years.
- Of the total, close to USD 600 million was raised through venture capital financing, representing around 40% of the overall share. On the other hand, over 5 instances of IPOs / secondary offerings were reported, wherein players collectively raised more than USD 775 million in financing.
- Both industry players and academic institutes have made significant contributions towards expanding the pool of published scientific literature; past and ongoing studies were focused on treatment of cancer indications.
- Majority of the authors affiliated with deemed universities have published articles focused on KRAS (80%), in the last year.
- In the past years, there has been an exponential increase in the number of publications, including research articles focused on RAS targeting therapies.
- Published articles / papers indicate that the current research activity is focused on targeting RAS isoforms, primarily mutated KRAS gene.
- Majority of the publications are focused on RAS targeting therapies intended for colorectal cancer, lung cancer and pancreatic cancer.
- In order to adequately monetize their proprietary offerings, drug developers are actively exploring diverse commercialization strategies across various stages of a product's launch cycle.
- Driven by the growing cancer burden and rising need for targeted drug therapies, the RAS targeted therapies market is projected to grow at a lucrative rate over the coming decade.
- The overall market opportunity is likely to be distributed across different types of therapies and routes of administration.
Example Players in the KRAS Market
- Amgen
- GlobeImmune
- Jacobio Pharmaceuticals
- Mirati Therapeutics
- Novartis
- Onconova Therapeutics
- Targovax
- Verastem Oncology.
GLOBAL KRAS MARKET
- Market Sizing and Opportunity Analysis: The report features an in-depth analysis of the global KRAS market, focusing on key market segments, including [A] type of indication, [B] type of molecule, [C] type of therapy, [D] route of administration and [E] key geographical regions.
- Market Landscape: A comprehensive evaluation of RAS targeting therapies, considering various parameters, such as [A] current status of development, [B] phase of development, [C] type of molecule, [D] type of therapy, [E] target therapeutic area, [F] target gene, [G] line of treatment and [H] route of administration. Additionally, the section includes a comprehensive evaluation of companies engaged in the development of RAS targeting therapies, based on several relevant parameters, such as [A] year of establishment, [B] employee count and [C] geographical presence.
- Clinical Trial Analysis: An in-depth analysis of clinical trials of various RAS targeting therapies, based on several relevant parameters, such as [A] trial registration year, [B] trial phase, [C] trial recruitment status, [D] enrolled patient population, [E] study design, [F] leading industry sponsors / collaborators, [G] trial focus, [H] target indication, [I] most popular indications and [J] regional distribution of trials.
- Product Competitiveness Analysis: An insightful competitive analysis of key players engaged in KRAS market (on the basis of the strength of their respective development portfolios), examining factors, such as [A] company size and [B] stage of development of lead molecules.
- Company Profiles: In-depth profiles of companies engaged in offering RAS targeting therapies, focusing on [A] company overview, [B] product portfolio and [C] recent developments and an informed future outlook.
- Publication Analysis: A comprehensive analysis of close to 1,600 peer-reviewed scientific articles related to research on RAS targeting therapies, based on [A] year of publication, [B] focus areas, [C] type of molecule, [D] popular keywords and [E] key journals.
- Partnerships and Collaborations: An insightful analysis of the deals inked by stakeholders in this domain, based on several parameters, such as [A] year of partnership, [B] type of partnership, [C] type of molecule, [D] most active players (in terms of the number of partnerships signed) and [E] geographical distribution of partnership activity.
- Funding and Investments: An in-depth analysis of various investments, such as [A] venture capital financing, [B] debt financing, [C] grants / awards, [D] capital raised from IPOs and [E] subsequent offerings that were undertaken by players engaged in KRAS market.
- Key Commercialization Strategies: A detailed discussion on the various commercialization strategies that have been adopted by drug developers engaged in KRAS market across different stages of therapy development, including pre-drug launch, at / during drug launch and post-marketing stage.
KEY QUESTIONS ANSWERED IN THIS REPORT
- How many companies are currently engaged in this market?
- Which are the leading companies in this market?
- What factors are likely to influence the evolution of this market?
- What is the current and future market size?
- What is the CAGR of this market?
- How is the current and future market opportunity likely to be distributed across key market segments?
REASONS TO BUY THIS REPORT
- The report provides a comprehensive market analysis, offering detailed revenue projections of the overall market and its specific sub-segments. This information is valuable to both established market leaders and emerging entrants.
- Stakeholders can leverage the report to gain a deeper understanding of the competitive dynamics within the market. By analyzing the competitive landscape, businesses can make informed decisions to optimize their market positioning and develop effective go-to-market strategies.
- The report offers stakeholders a comprehensive overview of the market, including key drivers, barriers, opportunities, and challenges. This information empowers stakeholders to stay abreast of market trends and make data-driven decisions to capitalize on growth prospects.
ADDITIONAL BENEFITS
- Complimentary PPT Insights Packs
- Complimentary Excel Data Packs for all Analytical Modules in the Report
- 15% Free Content Customization
- Detailed Report Walkthrough Session with Research Team
- Free Updated report if the report is 6-12 months old or older
TABLE OF CONTENTS
1. PREFACE
- 1.1. Scope of the Report
- 1.2. Research Methodology
- 1.2.1. Research Assumptions
- 1.2.2. Project Methodology
- 1.2.3. Forecast Methodology
- 1.2.4. Robust Quality Control
- 1.2.5. Key Considerations
- 1.2.5.1. Demographics
- 1.2.5.2. Economic Factors
- 1.2.5.3. Government Regulations
- 1.2.5.4. Supply Chain
- 1.2.5.5. COVID Impact / Related Factors
- 1.2.5.6. Market Access
- 1.2.5.7. Healthcare Policies
- 1.2.5.8. Industry Consolidation
- 1.3 Key Questions Answered
- 1.4. Chapter Outlines
2. EXECUTIVE SUMMARY
3. INTRODUCTION
- 3.1. Overview of RAS Targeting Therapies
- 3.2. Approaches Used to Target Mutated RAS Gene
- 3.3. Historical Notable Developments
- 3.4. Prominent Gene Driver Related Mutations in RAS Mutated Cancers
- 3.5. Challenges and Future Perspectives Associated with Treatment of RAS Mutated Cancers
4. CURRENT MARKET LANDSCAPE
- 4.1. RAS Targeting Therapies: Pipeline Review
- 4.1.1. Analysis by Phase of Development
- 4.1.2. Analysis by Route of Administration
- 4.1.3. Analysis by Line of Treatment
- 4.1.4. Analysis by Type of Therapy
- 4.1.5. Analysis by Type of Molecule
- 4.1.6. Analysis by Target Gene
- 4.1.7. Analysis by Target Therapeutic Area
- 4.1.8. Analysis by Phase of Development and Leading Players
- 4.2. RAS Targeting Therapies: Developer Landscape
- 4.2.1. Analysis by Year of Establishment
- 4.2.2. Analysis by Company Size
- 4.2.3. Analysis by Location of Headquarters
- 4.2.4. Analysis by Geography
5. CLINICAL TRIALS AND ENDPOINT ANALYSIS
- 5.1. RAS Targeting Therapies: List of Clinical Trials
- 5.1.1. Analysis by Trial Status
- 5.1.2. Analysis by Trial Registration Year
- 5.1.3. Analysis by Type of Masking
- 5.1.4. Analysis by Type of Intervention Model
- 5.1.5. Analysis by Study Design
- 5.1.6. Analysis by Type of Sponsor
- 5.1.7. Most Active Players: Analysis by Number of Trials Registered
- 5.1.8. Analysis by Trial Registration Year and Geography
- 5.1.9. Analysis by Type of Target Indication
- 5.1.10. Analysis by Enrolled Patient Population
- 5.1.11. Analysis of Enrolled Patient Population by Geography
- 5.1.12. Analysis of Number of Clinical Trials by Geography
6. PRODUCT COMPETITIVENESS ANALYSIS
- 6.1. Product Competitiveness: North America
- 6.2. Product Competitiveness: Europe
- 6.3. Product Competitiveness: Asia-Pacific
7. COMPANY PROFILES
- 7.1. Amgen
- 7.1.1. Company Overview
- 7.1.2. Financial Information
- 7.1.3. Portfolio of RAS Targeting Therapies
- 7.1.4. Recent Developments and Future Outlook
- 7.2. GlobeImmune
- 7.2.1. Company Overview
- 7.2.2. Financial Information
- 7.2.3. Portfolio of RAS Targeting Therapies
- 7.2.4. Recent Developments and Future Outlook
- 7.3. Jacobio Pharmaceuticals
- 7.3.1. Company Overview
- 7.3.2. Financial Information
- 7.3.3. Portfolio of RAS Targeting Therapies
- 7.3.4. Recent Developments and Future Outlook
- 7.4. Mirati Therapeutics
- 7.4.1. Company Overview
- 7.4.2. Financial Information
- 7.4.3. Portfolio of RAS Targeting Therapies
- 7.4.4. Recent Developments and Future Outlook
- 7.5. Novartis
- 7.5.1. Company Overview
- 7.5.2. Financial Information
- 7.5.3. Portfolio of RAS Targeting Therapies
- 7.5.4. Recent Developments and Future Outlook
- 7.6. Onconova Therapeutics
- 7.6.1. Company Overview
- 7.6.2. Financial Information
- 7.6.3. Portfolio of RAS Targeting Therapies
- 7.6.4. Recent Developments and Future Outlook
- 7.7. Targovax
- 7.7.1. Company Overview
- 7.7.2. Financial Information
- 7.7.3. Portfolio of RAS Targeting Therapies
- 7.7.4. Recent Developments and Future Outlook
- 7.8. Verastem Oncology
- 7.8.1. Company Overview
- 7.8.2. Financial Information
- 7.8.3. Portfolio of RAS Targeting Therapies
- 7.8.4. Recent Developments and Future Outlook
8. PUBLICATION ANALYSIS
- 8.1. RAS Targeting Therapies: Recent Publications
- 8.1.1. Analysis by Year of Publication
- 8.1.2. Analysis by Type of Publication
- 8.1.3. Analysis by Study Objective
- 8.1.4. Analysis by Emerging Focus Areas
- 8.1.5. Analysis by Target Therapeutic Area
- 8.1.6. Analysis by Target Gene
- 8.1.7. Analysis by Target Indication
- 8.1.8. Analysis by Affiliation of First Author
- 8.1.9. Leading Players: Analysis by Number of Publications
- 8.1.10. Key Journals: Analysis by Number of Publications
9. PARTNERHSIPS AND COLLABORATIONS
- 9.1. RAS Targeting Therapies: List of Partnerships and Collaborations
- 9.1.1. Analysis by Year of Partnership
- 9.1.2. Analysis by Type of Partnership
- 9.1.3. Analysis by Type of Partner
- 9.1.4. Analysis by Type of Molecule
- 9.1.5. Most Active Players: Analysis by Number of Partnerships
- 9.1.6. Most Active Partners: Analysis by Number of Partnerships
- 9.1.7. Regional Analysis
- 9.1.8. Intercontinental and Intracontinental Agreements
10. FUNDING AND INVESTMENT ANALYSIS
- 10.1. RAS Targeting Therapies: Funding and Investments
- 10.1.1. Analysis by Number of Funding Instances
- 10.1.2. Analysis by Amount Invested
- 10.1.3. Analysis by Type of Funding
- 10.1.4. Most Active Players: Analysis by Amount Raised
- 10.1.5. Most Active Investors: Analysis by Number of Instances
- 10.1.6. Analysis by Geography
11. KEY COMMERCIALIZATION STRATEGIES
- 11.1. Successful Drug Launch Strategy: ROOTS Framework
- 11.2. Successful Drug Launch Strategy: Product Differentiation
- 11.3. Commonly Adopted Commercialization Strategies based on the Development Stage of the Product
- 11.4. Key Commercialization Strategies Adopted by Companies Focused on RAS Targeting Therapies
- 11.4.1. Strategies Adopted Before Therapy Approval
- 11.5. Strategies Adopted During / Post Therapy Approval
- 11.6. Analysis by Ease of Implementation, Value Addition and Current Adoption (Harvey Ball Framework)
12. MARKET SIZING AND OPPORTUNITY ANALYSIS
- 12.1. Forecast Methodology and Key Assumptions
- 12.2. Global RAS Targeting Therapies Market, Till 2035
- 12.3. Global RAS Targeting Therapies Market, Till 2035: Distribution by Target Indication
- 12.4. Global RAS Targeting Therapies Market, Till 2035: Distribution by Type of Molecule
- 12.5. Global RAS Targeting Therapies Market, Till 2035: Distribution by Type of Therapy
- 12.6. Global RAS Targeting Therapies Market, Till 2035: Distribution by Route of Administration
- 12.7. Global RAS Targeting Therapies Market, Till 2035: Distribution by Geography
- 12.8. RAS Targeting Therapies: Individual Product Sales Forecasts
- 12.8.1. LUMAKRASTM (Amgen): Sales Forecast
- 12.8.2. Adagrasib (Mirati Therapeutics): Sales Forecast
- 12.8.3. AMO-01 (AMO Pharma): Sales Forecast
- 12.8.4. Antroquinonol (Golden Biotech): Sales Forecast
- 12.8.5. Binimetinib (Array Biopharma): Sales Forecast
- 12.8.6. CH7126766/VS6766 (Verastem Oncology): Sales Forecast
- 12.8.7. LXH274 (Novartis): Sales Forecast
- 12.8.8. Rigosertib (Onconova Therapeutics): Sales Forecast
- 12.8.9. RMC-4630 (Revolution Medicine): Sales Forecast
- 12.8.10. TG01 (Targovax): Sales Forecast
- 12.8.11. Tipifarnib (Kura Oncology): Sales Forecast
- 12.8.12. siG12D (Silenseed): Sales Forecast
13. CONCLUSION
14. APPENDIX 1: TABULATED DATA
15. APPENDIX 2: LIST OF COMPANIES AND ORGANIZATIONS
List of Tables
- Table 4.1 RAS Targeting Therapies: List of Industry and Non-Industry Players
- Table 5.1 RAS Targeting Therapies: List of Clinical Trials
- Table 8.1 RAS Targeting Therapies: List of Recent Publications
- Table 9.1 RAS Targeting Therapies: List of Partnerships and Collaborations
- Table 10.1 RAS Targeting Therapies: List of Funding and Investments
- Table 14.1 RAS Targeting Therapies: Distribution by Phase of Development
- Table 14.2 RAS Targeting Therapies: Distribution by Route of Administration
- Table 14.3 RAS Targeting Therapies: Distribution by Line of Treatment and Type of Therapy
- Table 14.4 RAS Targeting Therapies: Distribution by Type of Molecule
- Table 14.5 RAS Targeting Therapies: Distribution by Phase of Development and Type of Molecule
- Table 14.6 RAS Targeting Therapies: Distribution by Type of Molecule and Route of Administration
- Table 14.7 RAS Targeting Therapies: Distribution by Target Gene and Target Indication
- Table 14.8 Most Active Players: Distribution by Number of Trials Registered
- Table 14.9 RAS Targeting Therapy Developers: Distribution by Year of Establishment
- Table 14.10 RAS Targeting Therapy Developers: Distribution by Company Size
- Table 14.11 RAS Targeting Therapy Developers: Distribution by Location of Headquarters
- Table 14.12 RAS Targeting Therapy Developers: Distribution by Geography
- Table 14.13 Clinical Trial Analysis: Cumulative Distribution of Trials by Trial Registration Year
- Table 14.14 Clinical Trial Analysis: Distribution by Type of Masking and Intervention Model Adopted
- Table 14.15 Clinical Trial Analysis: Distribution by Study Design and Trial Status
- Table 14.16 Clinical Trial Analysis: Distribution by Type of Sponsor
- Table 14.17 Most Active Players: Distribution by Number of Clinical Trials
- Table 14.18 Clinical Trial Analysis: Distribution by Trial Registration Year and Geography
- Table 14.19 Clinical Trial Analysis: Distribution by Target Indication
- Table 14.20 Clinical Trial Analysis: Distribution of Number of Trials by Geography
- Table 14.21 Clinical Trial Analysis: Distribution by Trial Registration Year and Enrolled Patients Population
- Table 14.22 Clinical Trial Analysis: Distribution by Geography, Patients Enrolled and Trial Status
- Table 14.23 Clinical Trial Analysis: Distribution by Patients Enrolled and Phase of Development
- Table 14.24 Product Competitiveness Analysis: North America Scenario
- Table 14.25 Product Competitiveness Analysis: Europe Scenario
- Table 14.26 Product Competitiveness Analysis: Asia-Pacific Scenario
- Table 14.27 Amgen: Financial Information
- Table 14.28 GlobeImmune: Financial Information
- Table 14.29 Jacobio Pharmaceuticals: Financial Information
- Table 14.30 Mirati Therapeutics: Financial Information
- Table 14.31 Novartis: Financial Information
- Table 14.32 Onconova Therapeutics: Financial Information
- Table 14.33 Targovax: Financial Information
- Table 14.34 Verastem Oncology: Financial Information
- Table 14.35 Publication Analysis: Distribution by Year of Publication
- Table 14.36 Publication Analysis: Distribution by Type of Publication
- Table 14.37 Publication Analysis: Distribution by Study Objective
- Table 14.38 Publication Analysis: Distribution by Emerging Focus Area
- Table 14.39 Publication Analysis: Distribution by Target Gene
- Table 14.40 Publication Analysis: Distribution by Target Therapeutic Area
- Table 14.41 Publication Analysis: Distribution by Target Indication
- Table 14.42 Publication Analysis: Distribution by Affiliation of First Author
- Table 14.43 Most Active Players: Distribution by Number of Publications
- Table 14.44 Key Journals: Distribution by Number of Publications
- Table 14.45 Partnerships and Collaborations: Distribution by Year of Partnership
- Table 14.46 Partnerships and Collaborations: Distribution by Type of Partnership
- Table 14.47 Partnerships and Collaborations: Distribution by Type of Partner
- Table 14.48 Partnerships and Collaborations: Distribution by Type of Molecule
- Table 14.49 Most Active Players: Distribution by Number of Partnerships
- Table 14.50 Most Active Partners: Distribution by Number of Partnerships
- Table 14.51 Partnerships and Collaborations: Intercontinental and Intracontinental Agreements
- Table 14.52 Funding and Investment Analysis: Cumulative Year-wise Distribution by Amount Invested, Since 2016
- Table 14.53 Funding and Investment Analysis: Distribution by Type of Funding
- Table 14.54 Funding and Investment Analysis: Distribution by Year and Type of Funding
- Table 14.55 Funding and Investment Analysis: Distribution by Year, Amount Invested and Type of Funding, Since 2016 (USD Million)
- Table 14.56 Funding and Investment Analysis: Distribution of Total Amount Invested by Type of Funding (USD Million)
- Table 14.57 Key Investors: Distribution by Number of Funding Instances
- Table 14.58 Funding and Investment Analysis: Distribution of Amount Invested by Geography (USD Million)
- Table 14.59 Key Commercialization Strategies: Harvey Ball Analysis
- Table 14.60 Successful Drug Launch Strategy: ROOTS Framework
- Table 14.61 Historical Strategies Adopted by the Developer of LUMAKRAS(TM)
- Table 14.62 Successful Drug Launch Strategy: Product Differentiation
- Table 14.63 Commonly Adopted Commercialization Strategies based on Development Stage of the Product
- Table 14.64 Harvey Ball Analysis: Commercialization Strategies Adopted by RAS Targeting Therapy Developers
- Table 14.65 RAS Targeting Therapies Market, Till 2035 (USD Million)
- Table 14.66 RAS Targeting Therapies Market: Distribution by Type of Molecule / Drug Class (USD Million)
- Table 14.67 RAS Targeting Therapies Market: Distribution by Type of Therapy (USD Million)
- Table 14.68 RAS Targeting Therapies Market: Distribution by Route of Administration (USD Million)
- Table 14.69 RAS Targeting Therapies Market: Distribution by Location of Headquarters (USD Million)
- Table 14.70 LUMAKRAS(TM) (Amgen): Estimated Sales, Till 2035 (USD Million)
- Table 14.71 Adagrasib (Mirati Therapeutics): Estimated Sales, Till 2035 (USD Million)
- Table 14.72 AMO-01 (AMO Pharma): Estimated Sales, Till 2035 (USD Million)
- Table 14.73 Antroquinonol (Golden Biotech): Estimated Sales, Till 2035 (USD Million)
- Table 14.74 Binimetinib (Array Biopharma): Estimated Sales, Till 2035 (USD Million)
- Table 14.75 CH7146766/VS6766 (Verastem Oncology): Estimated Sales, Till 2035 (USD Million)
- Table 14.76 LXH274 (Novartis): Estimated Sales, Till 2035 (USD Million)
- Table 14.77 Rigosertib (Onconova Therapeutics): Estimated Sales, Till 2035 (USD Million)
- Table 14.78 RMC-4630 (Revolution Medicine): Estimated Sales, Till 2035 (USD Million)
- Table 14.79 TG01 (Targovax): Estimated Sales, Till 2035 (USD Million)
- Table 14.80 Tipifarnib (Kura Oncology): Estimated Sales, Till 2035 (USD Million)
- Table 14.81 siG14D (Silenseed): Estimated Sales, Till 2035 (USD Million)
- Table 14.82 RAS Targeting Therapies: Distribution by Target Therapeutic Area
- Table 14.83 RAS Targeting Therapies: Distribution by Type of Molecule and Company Size
- Table 14.84 RAS Targeting Therapies: Distribution by Company Size and Region
- Table 14.85 Most Active Players: Distribution by Number of Products
- Table 14.86 Clinical Trial Analysis: Distribution by Trial Registration Year and Trial Status
- Table 14.87 Clinical Trial Analysis: Distribution by Phase of Development, Year and Number of Patients
- Table 14.88 Clinical Trial Analysis: Distribution by Number of Trials, Trial Status and Region
- Table 14.89 Clinical Trial Analysis: Distribution by Primary Purpose
- Table 14.90 Funding and Investment Analysis: Cumulative Number of Funding Instances by Year, Since 2016
- Table 14.91 Funding and Investment Analysis: Cumulative Amount Invested, Since 2016 (USD Million)
- Table 14.92 Funding and Investment Analysis: Distribution by Amount Invested and Type of Funding, Since 2016
- Table 14.93 Funding and Investment Analysis: Distribution of Funding Instances by Geography
- Table 14.94 Funding and Investment Analysis: Distribution by Amount Invested and Type of Funding, Since 2016
- Table 14.95 Most Active Players: Distribution by Number of Funding Instances, Since 2016
- Table 14.96 Funding and Investment Analysis: Distribution of Recipient Companies by Year of Establishment and Type of Funding, Since 2016
List of Figures
- Figure 3.1 Approaches for Targeting Mutated RAS Gene
- Figure 3.2 Notable Developments within the RAS Targeting Therapies Domain
- Figure 3.3 Prominent Gene Driver related Mutations in RAS Mutated Cancers
- Figure 3.4 Key Challenges Associated with Targeting and Treatment of RAS Mutated Cancers
- Figure 3.5 Future Perspectives of RAS Targeting Therapies
- Figure 4.1 RAS Targeting Therapies: Distribution by Phase of Development
- Figure 4.2 RAS Targeting Therapies: Distribution by Route of Administration
- Figure 4.3 RAS Targeting Therapies: Distribution by Line of Treatment and Type of Therapy
- Figure 4.4 RAS Targeting Therapies: Distribution by Type of Molecule
- Figure 4.5 RAS Targeting Therapies: Distribution by Phase of Development and Type of Molecule
- Figure 4.6 RAS Targeting Therapies: Distribution by Type of Molecule and Route of Administration
- Figure 4.7 RAS Targeting Therapies: Distribution by Target Gene and Target Indication
- Figure 4.8 Most Active Players: Distribution by Number of Trials Registered
- Figure 4.9 RAS Targeting Therapy Developers: Distribution by Year of Establishment
- Figure 4.10 RAS Targeting Therapy Developers: Distribution by Company Size
- Figure 4.11 RAS Targeting Therapy Developers: Distribution by Location of Headquarters
- Figure 4.12 RAS Targeting Therapy Developers: Distribution by Geography
- Figure 5.1 Clinical Trial Analysis: Cumulative Distribution of Trials by Trial Registration Year
- Figure 5.2 Clinical Trial Analysis: Distribution by Type of Masking and Intervention Model Adopted
- Figure 5.3 Clinical Trial Analysis: Distribution by Study Design and Trial Status
- Figure 5.4 Clinical Trial Analysis: Distribution by Type of Sponsor
- Figure 5.5 Most Active Players: Distribution by Number of Clinical Trials
- Figure 5.6 Clinical Trial Analysis: Distribution by Trial Registration Year and Geography
- Figure 5.7 Clinical Trial Analysis: Distribution by Target Indication
- Figure 5.8 Clinical Trial Analysis: Distribution of Number of Trials by Geography
- Figure 5.9 Clinical Trial Analysis: Distribution by Trial Registration Year and Enrolled Patients Population
- Figure 5.10 Clinical Trial Analysis: Distribution by Geography, Patients Enrolled and Trial Status
- Figure 5.11 Clinical Trial Analysis: Distribution by Patients Enrolled and Phase of Development
- Figure 6.1 Product Competitiveness Analysis: North America Scenario
- Figure 6.2 Product Competitiveness Analysis: Europe Scenario
- Figure 6.3 Product Competitiveness Analysis: Asia-Pacific Scenario
- Figure 7.1 Amgen: Financial Information
- Figure 7.2 GlobeImmune: Financial Information
- Figure 7.3 Jacobio Pharmaceuticals: Financial Information
- Figure 7.4 Mirati Therapeutics: Financial Information
- Figure 7.5 Novartis: Financial Information
- Figure 7.6 Onconova Therapeutics: Financial Information
- Figure 7.7 Targovax: Financial Information
- Figure 7.8 Verastem Oncology: Financial Information
- Figure 8.1 Publication Analysis: Distribution by Year of Publication
- Figure 8.2 Publication Analysis: Distribution by Type of Publication
- Figure 8.3 Publication Analysis: Distribution by Study Objective
- Figure 8.4 Publication Analysis: Distribution by Emerging Focus Area
- Figure 8.5 Publication Analysis: Distribution by Target Gene
- Figure 8.6 Publication Analysis: Distribution by Target Therapeutic Area
- Figure 8.7 Publication Analysis: Distribution by Target Indication
- Figure 8.8 Publication Analysis: Distribution by Affiliation of First Author
- Figure 8.9 Most Active Players: Distribution by Number of Publications
- Figure 8.10 Key Journals: Distribution by Number of Publications
- Figure 9.1 Partnerships and Collaborations: Distribution by Year of Partnership
- Figure 9.2 Partnerships and Collaborations: Distribution by Type of Partnership
- Figure 9.3 Partnerships and Collaborations: Distribution by Type of Partner
- Figure 9.4 Partnerships and Collaborations: Distribution by Type of Molecule
- Figure 9.5 Most Active Players: Distribution by Number of Partnerships
- Figure 9.6 Most Active Partners: Distribution by Number of Partnerships
- Figure 9.7 Partnerships and Collaborations: Intercontinental and Intracontinental Agreements
- Figure 10.1 Funding and Investment Analysis: Cumulative Year-wise Distribution by Amount Invested, Since 2016
- Figure 10.2 Funding and Investment Analysis: Distribution by Type of Funding
- Figure 10.3 Funding and Investment Analysis: Distribution by Year and Type of Funding
- Figure 10.4 Funding and Investment Analysis: Distribution by Year, Amount Invested and Type of Funding, Since 2016 (USD Million)
- Figure 10.5 Funding and Investment Analysis: Distribution of Total Amount Invested by Type of Funding (USD Million)
- Figure 10.6 Key Investors: Distribution by Number of Funding Instances
- Figure 10.7 Funding and Investment Analysis: Distribution of Amount Invested by Geography (USD Million)
- Figure 11.1 Key Commercialization Strategies: Harvey Ball Analysis
- Figure 11.2 Successful Drug Launch Strategy: ROOTS Framework
- Figure 11.3 Historical Strategies Adopted by the Developer of LUMAKRAS(TM)
- Figure 11.4 Successful Drug Launch Strategy: Product Differentiation
- Figure 11.5 Commonly Adopted Commercialization Strategies based on Development Stage of the Product
- Figure 11.6 Harvey Ball Analysis: Commercialization Strategies Adopted by RAS Targeting Therapy Developers
- Figure 12.1 RAS Targeting Therapies Market, Till 2035 (USD Million)
- Figure 12.2 RAS Targeting Therapies Market: Distribution by Type of Molecule / Drug Class (USD Million)
- Figure 12.3 RAS Targeting Therapies Market: Distribution by Type of Therapy (USD Million)
- Figure 12.4 RAS Targeting Therapies Market: Distribution by Route of Administration (USD Million)
- Figure 12.5 RAS Targeting Therapies Market: Distribution by Location of Headquarters (USD Million)
- Figure 12.6 LUMAKRAS(TM) (Amgen): Estimated Sales, Till 2035 (USD Million)
- Figure 12.7 Adagrasib (Mirati Therapeutics): Estimated Sales, Till 2035 (USD Million)
- Figure 12.8 AMO-01 (AMO Pharma): Estimated Sales, Till 2035 (USD Million)
- Figure 12.9 Antroquinonol (Golden Biotech): Estimated Sales, Till 2035 (USD Million)
- Figure 12.10 Binimetinib (Array Biopharma): Estimated Sales, Till 2035 (USD Million)
- Figure 12.11 CH7126766/VS6766 (Verastem Oncology): Estimated Sales, Till 2035 (USD Million)
- Figure 12.12 LXH274 (Novartis): Estimated Sales, Till 2035 (USD Million)
- Figure 12.13 Rigosertib (Onconova Therapeutics): Estimated Sales, Till 2035 (USD Million)
- Figure 12.14 RMC-4630 (Revolution Medicine): Estimated Sales, Till 2035 (USD Million)
- Figure 12.15 TG01 (Targovax): Estimated Sales, Till 2035 (USD Million)
- Figure 12.16 Tipifarnib (Kura Oncology): Estimated Sales, Till 2035 (USD Million)
- Figure 12.17 siG12D (Silenseed): Estimated Sales, Till 2035 (USD Million)
- Figure 13.1 RAS Targeting Therapies: Distribution by Target Therapeutic Area
- Figure 13.2 RAS Targeting Therapies: Distribution by Type of Molecule and Company Size
- Figure 13.3 RAS Targeting Therapies: Distribution by Company Size and Region
- Figure 13.4 Most Active Players: Distribution by Number of Products
- Figure 13.5 Clinical Trial Analysis: Distribution by Trial Registration Year and Trial Status
- Figure 13.6 Clinical Trial Analysis: Distribution by Phase of Development, Year and Number of Patients
- Figure 13.7 Clinical Trial Analysis: Distribution by Number of Trials, Trial Status and Region
- Figure 13.8 Clinical Trial Analysis: Distribution by Primary Purpose
- Figure 13.9 Funding and Investment Analysis: Cumulative Number of Funding Instances by Year, Since 2016
- Figure 13.10 Funding and Investment Analysis: Cumulative Amount Invested, Since 2016 (USD Million)
- Figure 13.11 Funding and Investment Analysis: Distribution by Amount Invested and Type of Funding, Since 2016
- Figure 13.12 Funding and Investment Analysis: Distribution of Funding Instances by Geography
- Figure 13.13 Funding and Investment Analysis: Distribution by Amount Invested and Type of Funding, Since 2016
- Figure 13.14 Most Active Players: Distribution by Number of Funding Instances, Since 2016
- Figure 13.15 Funding and Investment Analysis: Distribution of Recipient Companies by Year of Establishment and Type of Funding, Since 2016