


 |
市場調查報告書
商品編碼
1771292
Fc融合蛋白品質市場:產業趨勢和全球預測 - 各標的適應症,各融合分子類型,各給藥途徑,主要各地區Fc Fusion Protein Market: Industry Trends and Global Forecasts - Distribution by Target Indications, Type of Fusion Molecule, Route of Administration and Key Geographical Regions |
||||||
全球Fc融合蛋白市場:概覽
今年全球Fc融合蛋白市場規模達155億美元。預計預測期內,市場複合年增長率為 10%。
市場區隔與機會分析依下列參數細分。
標的適應症
- 嗜中性白血球低下症
- 移植物抗宿主病
- 乳癌
- 類風濕性關節炎
- 非小細胞肺癌
- 新生血管性(wet)老齡化黃斑部病變(AMD)
- A型血友病
- 視神經脊髓炎頻譜障礙
- 全身性紅斑
融合分子類型
- 抗體
- 細胞激素
- 成長因素
- 受體ECD
- 其他
給藥途徑
- 皮下
- 靜脈注射
- 玻璃體內
主要地區
- 北美
- 歐洲
- 亞太地區
- 其他地區
全球Fc融合蛋白市場:成長與趨勢
自1998年Enbrel®(CD4-Fc融合蛋白)核准用於治療類風濕性關節炎以來,Fc融合蛋白療法已成為一種重要的治療藥物。目前,已有13種基於Fc融合蛋白的藥物上市,另有約50種分子正在開發中,用於治療各種疾病。這些治療藥物結合了生物活性配體的良好藥理特性和免疫球蛋白G (IgG) 可結晶片段 (Fc) 結構域的獨特特性。此外,由於這些疾病修飾療法能夠延長生物活性蛋白的血清半衰期,因此已應用於各種治療領域,包括腫瘤學、神經病學、呼吸系統疾病、罕見遺傳疾病等等。
目前,許多藥物開發商正積極致力於開發療效較佳的新型Fc融合療法。事實上,該領域開發商研究工作的核心是提高藥理活性成分的穩定性和溶解度,最終旨在增強其治療潛力。因此,預計Fc融合療法市場在預測期內將呈現健康的成長動能。
全球Fc融合蛋白市場:關鍵洞察
本報告分析了全球Fc融合蛋白市場的現狀,並揭示了該行業的潛在成長機會。報告的主要發現包括:
- 目前,全球約有40家公司正在評估Fc融合療法在治療多種適應症的潛在益處。
- 目前,超過115種藥物療法正在評估其作為單藥或與其他療法聯合使用的療效,這些療法處於不同的研發階段,其中大多數用於腸外給藥。
- 大多數已核准的療法和後期候選藥物旨在治療各種腫瘤、遺傳、血液和免疫疾病。
- 鑑於Fc融合療法的治療益處,這些幹預措施主要作為單藥療法進行評估。作為單藥療法進行研究的後期藥物包括ACE-011和RC18。
- 約50%的Fc融合療法用於皮下給藥,患者可使用各種給藥系統自行給藥。
- 已有超過200萬名患者參與了針對近120種Fc融合候選療法的臨床試驗,這些試驗遍佈全球。
- 一些組織已提供資金支持該領域的研究工作。目前,資金撥付主要著重於支持SBIR/STTR以外的藥物研究。
- 過去幾年,授予該領域的利害關係人資助數量有所增加,其中超過60%的資助總額用於研究計畫。
- 美國國立衛生研究院(NIH)的各管理機構都參與了該領域,其中NCI、NIAID和NHLBI是相對突出的參與者。
- 隨著時間的推移,與Fc融合療法相關的智慧財產權以令人矚目的速度成長,產業和非產業參與者都提交了專利。
- 在此期間,該領域提交/授予的專利數量以17%的複合年增長率增長,其中大部分是在過去兩年提交/授予的。
- 除了產業參與者之外,史丹佛大學和INSERM等學術機構也提交了與Fc融合療法相關的專利。
- 高價值專利專注於透過各種融合分子(包括受體ECD、酵素和勝肽)修飾Fc區。
- 已發表的科學文獻顯示了該領域研究的進展速度。過去和正在進行的研究似乎都集中在抗癌療法的開發上。
- 過去幾年,與Fc融合療法相關的論文數量穩步增長。這些論文中也包括關注與抗體Fc區融合的生物部分類型的論文。
- 大多數已發表的論文(約70%)都是關於評估Fc融合蛋白在各種癌症和血液疾病中的治療潛力的研究。
- 與Fc融合療法相關的論文已發表在幾本高影響力期刊上,其中PLoS One和MAbs成為領先的期刊,發表了30多篇論文。
- 這些幹預措施中,有幾款候選藥物處於開發的中後期階段,主要針對腫瘤疾病,其中大多數是利用Fc蛋白進行基因工程改造的抗體。
- 許多已上市藥物,例如 Fasenra、Gazyva、Margenza 和 Skyrizi,目前也正在接受其他腫瘤適應症的療效評估。
- 大多數後期候選藥物(約 60%)針對的是腫瘤適應症,包括實體腫瘤、非何杰金氏淋巴瘤和非小細胞肺癌。
- 隨著後期藥物研發管線數量的不斷增加,預計未來收入將以每年近 10% 的速度成長。
- 預計市場機會將涵蓋不同的治療類型、標靶適應症、融合分子類型、給藥途徑和主要地區,且具有良好的多元化。
藥物研發平台市場參與企業案例
- Abzena
- Creative Biolabs
- Distributed Bio(Subsidiary of Charles River)
- ImmunoPrecise Antibodies
- IONTAS
- LakePharma
- Leading Biology
- Sino Biological
- XOMA
全球 Fc 融合蛋白市場
- 市場規模與機會分析:本研究報告對全球 Fc 融合蛋白市場進行了深入分析,重點關注 [A] 目標適應症、[B] 融合分子類型、[C] 給藥途徑和 [D] 重點地區等關鍵細分市場。
- 市場格局:對Fc融合療法進行全面評估,考慮各種參數,例如:A] 先導候選藥物的開發階段,[B] 融合分子類型,[C] 目標基因,[D] 治療領域,[E] 目標疾病適應症,[F] 治療類型,[G] 給藥途徑,[H] 劑量。此外,也根據[A] 成立年份,[B] 公司規模,[C] 總部所在地,對藥物開發公司進行詳細評估。
- 公司簡介:對參與Fc融合療法開發的公司的詳細簡介,重點關注:A] 公司概況,[B] 財務資訊(如有),[C] 產品組合,[D] 最新進展及未來展望。
- 臨床試驗分析:基於若干相關參數對各種 Fc 融合療法的臨床試驗進行詳細分析,例如:A] 研究註冊年份,[B] 研究階段,[C] 研究設計,[D] 掩蔽類型,[E] 幹預模式類型,[F] 新興重點領域,[G] 主要行業贊助商/合作者,[Hi] 適應症,[Hi] 熱門區域的熱門措施,[Hi]。
- 資助分析:根據各種相關參數(例如A]資助年份、[B]資助金額、[C]管理機構中心、[D]支持期限、[E]資助申請類型、[F]資助目標、[G]活動代碼、[H]新興重點領域等),對授予開展Fc融合療法相關項目的研究機構的資助進行詳細分析。
- 出版品分析:根據A]出版年份、[B]新興重點領域、[C]目標治療領域、[D]主要作者、[E]主要期刊,對近1,135篇與Fc融合療法相關的同行評審科學論文進行全面分析。
- 專利分析:基於各種相關參數,對與Fc融合療法相關的已申請/已授權專利進行詳細分析,例如A]出版年份、[B]地區、[C] CPC符號、[D]新興重點領域、[E]申請人類型、[F]主要行業參與者、[G]專利估值分析等。
- 合作關係與協作:基於多個參數,對該領域利害關係人達成的交易進行深入分析,例如:A)合作年份、B)合作類型、C)重點領域、D)合作夥伴類型、E)最活躍的參與者(已達成的合作夥伴關係數量)、F)合作活動的區域分佈。
- 案例研究:基於多個相關參數,對已上市和正在開發的Fc工程抗體進行詳細分析,例如:A)開發階段、B)目標疾病、C)治療領域、D) Fc工程類型、E) Fc工程的影響、F)給藥途徑、G)治療類型。
本報告研究了全球Fc融合蛋白市場,並概述了市場趨勢,涵蓋目標適應症、融合分子類型、給藥途徑、區域趨勢以及市場參與者概況。
目錄
第1章 序文
第2章 摘要整理
第3章 簡介
- Fc融合治療藥概要
- Fc融合治療藥的成分
- 作用機制
- Fc融合治療藥的種類
- Fc融合治療藥的應用
- Fc融合治療藥對其他的生物學的分子有的優點
- 未來展望
第4章 開發平台評估:成藥和臨床藥
- 分析調查手法和主要參數
- Fc融合治療藥:醫藥品開發平台(管線)
- Fc融合治療藥:開發平台分析
- Fc融合治療藥:醫藥品開發企業一覽
第5章 企業簡介
- 章概要
- Alphamab Oncology
- Amgen
- Acceleron Pharmaceuticals
- Bristol Myers Squibb
- Sanofi
第6章 臨床試驗的分析
- 分析調查手法和主要參數
- Fc融合治療藥:臨床試驗清單
第7章 學術資助分析
- 分析調查手法和主要參數
- Fc融合治療藥:學術資助的分析
第8章 出版物的分析
第9章 專利分析
- 分析調查手法和主要參數
- Fc融合治療藥:專利分析
第10章 夥伴關係和合作
- 分析調查手法和主要參數
- 夥伴關係模式
- Fc融合治療藥:夥伴關係和合作的清單
第11章 市場規模的評估與機會分析
- 預測調查手法主要的前提條件
- 全球FC融合治療藥市場(到2035年)
- 到2035年前的全球FC融合治療藥市場:各標的適應症
- 到2035年前的全球FC融合治療藥市場:各融合分子類型
- 到2035年前的全球FC融合治療藥市場:治療類別
- 到2035年前的全球FC融合治療藥市場:各給藥途徑
- 到2035年前的全球FC融合治療藥市場:各地區
- Fc融合治療藥:個別產品的銷售額預測
- ABP 938(安進)
- Alprolix®(賽諾菲)
- 朝日製藥®(海正製藥)
- Arcalyst®(Kiniska)藥品)
- BIVV001(賽諾菲)
- CD24Fc(默克)
- Electate®(百健)
- Eylea™(再生元製藥)
- FRSW107(鄭州Gensciences)
- KN035(康寧傑瑞腫瘤)
- KN046(康寧傑瑞腫瘤)
- Lumitin®(成都康弘生物科技)
- Rebrozil®(百時美施貴寶)
- Ryzneuta™(Evive Biotech)
- Strensiq®(阿斯特捷利康)
- 泰利西普 (RemeGen)
第12章 案例研究:FC蛋白質工程及糖鎖鏈工程抗體
- Fc蛋白質改變抗體及糖鎖鏈改變抗體:醫藥品開發平台(管線)
- Fc蛋白質改變抗體及糖鎖鏈改變抗體:開發商一覽
第13章 結論
第14章 附錄1:表格形式資料
第15章 附錄2:企業·團體一覽
GLOBAL FC FUSION PROTEIN MARKET: OVERVIEW
As per Roots Analysis, the global Fc fusion protein market valued at USD 15.5 billion in the current year is anticipated to grow at a CAGR of 10% during the forecast period.
The market sizing and opportunity analysis has been segmented across the following parameters:
Target Indications
- Neutropenia
- Graft Versus Host Disease
- Breast Cancer
- Rheumatoid Arthritis
- Non-Small Cell Lung Cancer
- Neovascular (Wet) Age-related Macular Degeneration (AMD)
- Hemophilia A
- Neuromyelitis Optica Spectrum Disorders
- Systemic Lupus Erythematosus
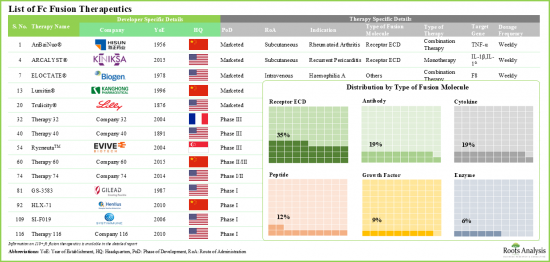
Type of Fusion Molecule
- Antibody
- Cytokine
- Growth Factor
- Receptor ECD
- Others
Route of Administration
- Subcutaneous
- Intravenous
- Intravitreal
Key Geographical Regions
- North America
- Europe
- Asia-Pacific
- Rest of the World
GLOBAL FC FUSION PROTEIN MARKET: GROWTH AND TRENDS
Since the approval of Enbrel(R) (a CD4-Fc fusion protein for the treatment of rheumatoid arthritis) in 1998, Fc fusion protein therapies have become a prominent class of therapeutics. At present, 13 Fc fusion protein-based drugs are commercially available, and approximately 50 additional molecules are in development for a range of disease indications. These therapies combine the advantageous pharmacological properties of biologically active ligands with the unique characteristics of the crystallizable fragment (Fc) domain of immunoglobulin G (IgG). Moreover, due to their ability to prolong the serum half-life of biologically active proteins, these disease-modifying therapies are utilized in a variety of therapeutic areas. Some of these include oncological, neurological, respiratory, and rare genetic disorders.
Currently, numerous drug developers are actively involved in the development of novel Fc fusion therapies with improved efficacy. In fact, the research efforts by developers in this area are centered on enhancing the stability and solubility of the pharmacologically active component, ultimately aiming to boost its therapeutic potential. Consequently, the Fc fusion therapies market is expected to witness healthy market growth during the forecast period.
GLOBAL FC FUSION PROTEIN MARKET: KEY INSIGHTS
The report delves into the current state of global Fc fusion protein market and identifies potential growth opportunities within industry. Some key findings from the report include:
- Presently, around 40 players from across the world, are engaged in evaluating the potential benefits of Fc fusion therapeutics for the treatment of a wide range of disease indications.
- The pipeline features 115+ drug therapies being evaluated either as monotherapies or in combination with other interventions across different stages of development; most of these are designed for parenteral administration.
- Majority of the approved therapies and late-stage candidates are intended for the treatment of various oncological disorders, genetic disorders, hematological disorders and immunological disorders.
- Given the therapeutic benefits of fc fusion, these interventions are primarily evaluated as monotherapies; examples of late-stage drugs being investigated as monotherapy include ACE-011 and RC18.
- Around 50% of the fc fusion therapeutics are meant for subcutaneous administration; these can be self-administered by the patients using different drug delivery systems.
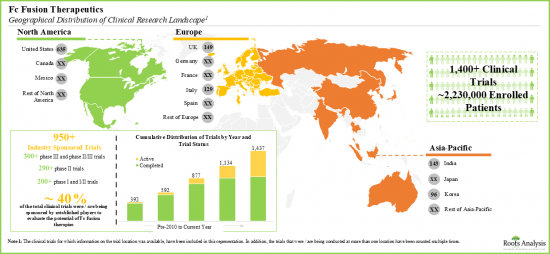
- Over two million patients have been enrolled in the clinical studies being conducted for the evaluation of close to 120 fc fusion-based therapy candidates, across various geographies.
- Several organizations have extended financial support to aid research efforts in this domain; currently, the focus, in terms of funds disbursed, is primarily in support of investigations of drugs for non-SBIR / STTR purposes.
- The number of grants awarded to stakeholders in this domain have increased in the past few years; more than 60% of the total amount was awarded for research projects.
- The field has witnessed the involvement of various administering institutes of the NIH; of all the institutes, participation of the NCI, NIAID, and NHLBI has been relatively more prominent.
- Over time, the intellectual property related to Fc fusion therapeutics has grown at a commendable pace, with patents being filed by both industry and non-industry players.
- Number of patents filed / granted in this domain have increased at a CAGR of 17% during the given time period, with majority of the patents filed / granted in the past two years.
- In addition to industry players, several academic organizations, such as Stanford University and INSERM have also filed patents related to fc fusion therapeutics.
- The high value patents focus on the modification of Fc region with different fusion molecules, such as receptor ECD, enzyme and peptide.
- Published scientific literature is indicative of the ongoing pace of research in this field; the focus of past and ongoing studies seems to be fixated on the development of anti-cancer therapeutics.
- The past few years have seen a steady rise in the number of publications related to fc fusion therapeutics; these include articles highlighting the type of biological moieties fused with the Fc region of the antibodies.
- Majority (~70%) of the published articles are related to the research studies focused on evaluating the therapeutic potential of Fc fusion proteins across various oncological and blood disorders.
- Articles related to Fc fusion therapeutics have been published in several high impact journals; however, PLoS One and MAbs have emerged as the key journals with over 30 articles.
- With multiple pipeline candidates in the mid to late stages of development, these interventions are primarily targeting oncological disorders; majority of these are Fc protein engineered antibodies.
- A number of marketed drugs, such as Fasenra, Gazyva, Margenza and Skyrizi, are now being evaluated for their efficacy across other oncological indications as well.
- Majority (~60%) of the late-stage candidates are targeting oncological indications, including solid tumors, non-Hodgkin lymphoma, and non-small cell lung cancer.
- Driven by an increasing number of late-stage therapies in the pipeline, the future opportunity, in terms of revenues, is anticipated to grow at an annualized rate of nearly 10%.
- The estimated market opportunity is expected to be well-distributed across different types of therapies, target indications, type of fusion molecules, routes of administration and key geographic regions.
Example Players in the Drug Discovery Platforms Market
- Abzena
- Creative Biolabs
- Distributed Bio (Subsidiary of Charles River)
- ImmunoPrecise Antibodies
- IONTAS
- LakePharma
- Leading Biology
- Sino Biological
- XOMA
GLOBAL FC FUSION PROTEIN MARKET
- Market Sizing and Opportunity Analysis: The report features an in-depth analysis of the global Fc fusion protein market, focusing on key market segments, including [A] target indications, [B] type of fusion molecule, [C] route of administration and [D] key geographical regions.
- Market Landscape: A comprehensive evaluation of Fc fusion therapeutics, considering various parameters, such as [A] phase of development of lead candidates, [B] type of fusion molecule, [C] target gene, [D] therapeutic area(s), [E] target disease indication(s), [F] type of therapy, [G] route of administration and [H] dosing frequency. Additionally, a detailed evaluation of the drug developer(s), based on [A] year of establishment, [B] company size, and [C] location of headquarters.
- Company Profiles: In-depth profiles of companies engaged in the development of Fc fusion therapeutics, focusing on [A] company overview, [B financial information (if available), [C] product portfolio and [D] recent developments and an informed future outlook.
- Clinical Trial Analysis: A detailed analysis of clinical studies of various Fc fusion therapeutics, based on several relevant parameters, such as [A] trial registration year, [B] trial phase, [C] study design, [D] type of masking, [E] type of intervention model, [F] emerging focus area, [G] leading industry sponsors / collaborators, [H] popular indications, [I] popular interventions and [J] regional distribution of trials.
- Grant Analysis: An in-depth analysis of grants that have been awarded to research institutes engaged in conducting projects related to Fc fusion therapeutics, based on various relevant parameters, such as [A] year of grant award, [B] amount awarded, [C] administering institute center, [D] support period, [E] type of grant application, [F] purpose of grant award, [G] activity code and [H] emerging focus areas.
- Publication Analysis: A comprehensive analysis of close to 1,135 peer-reviewed scientific articles related to Fc fusion therapeutics, based on [A] year of publication, [B] emerging focus areas, [C] target therapeutic area, [D] leading authors and [E] key journals.
- Patent Analysis: An in-depth analysis of patents filed / granted related to Fc fusion therapeutics, based on various relevant parameters, such as [A] publication year, [B] geography, [C] CPC symbols, [D] emerging focus areas, [E] type of applicant, [F] leading industry players and [G] patent valuation analysis.
- Partnerships and Collaborations: An insightful analysis of the deals inked by stakeholders in this domain, based on several parameters, such as [A] year of partnership, [B] type of partnership, [C] focus area, [D] type of partner, [E] most active players (in terms of the number of partnerships signed) and [F] geographical distribution of partnership activity.
- Case Study: A detailed discussion on the Fc protein engineered and glycoengineered antibodies that are either marketed or being developed based on multiple of relevant parameters, such as [A] phase of development, [B] target disease indication, [C] therapeutic area, [D] type of Fc engineering, [E] impact of Fc engineering, [F] route of administration and [G] type of therapy.
KEY QUESTIONS ANSWERED IN THIS REPORT
- How many companies are currently engaged in this market?
- Which are the leading companies in this market?
- What factors are likely to influence the evolution of this market?
- What is the current and future market size?
- What is the CAGR of this market?
- How is the current and future market opportunity likely to be distributed across key market segments?
REASONS TO BUY THIS REPORT
- The report provides a comprehensive market analysis, offering detailed revenue projections of the overall market and its specific sub-segments. This information is valuable to both established market leaders and emerging entrants.
- Stakeholders can leverage the report to gain a deeper understanding of the competitive dynamics within the market. By analyzing the competitive landscape, businesses can make informed decisions to optimize their market positioning and develop effective go-to-market strategies.
- The report offers stakeholders a comprehensive overview of the market, including key drivers, barriers, opportunities, and challenges. This information empowers stakeholders to stay abreast of market trends and make data-driven decisions to capitalize on growth prospects.
ADDITIONAL BENEFITS
- Complimentary PPT Insights Packs
- Complimentary Excel Data Packs for all Analytical Modules in the Report
- 15% Free Content Customization
- Detailed Report Walkthrough Session with Research Team
- Free Updated report if the report is 6-12 months old or older
TABLE OF CONTENTS
1. PREFACE
- 1.1. Scope of the Report
- 1.2. Research Methodology
- 1.2.1. Research Assumptions
- 1.2.2. Project Methodology
- 1.2.3. Forecast Methodology
- 1.2.4. Robust Quality Control
- 1.2.5. Key Considerations
- 1.2.5.1. Demographics
- 1.2.5.2. Economic Factors
- 1.2.5.3. Government Regulations
- 1.2.5.4. Supply Chain
- 1.2.5.5. COVID Impact / Related Factors
- 1.2.5.6. Market Access
- 1.2.5.7. Healthcare Policies
- 1.2.5.8. Industry Consolidation
- 1.3 Key Questions Answered
- 1.4. Chapter Outlines
2. EXECUTIVE SUMMARY
3. INTRODUCTION
- 3.1. Overview of Fc Fusion Therapeutics
- 3.2. Components of Fc Fusion Therapeutics
- 3.3. Mechanism of Action
- 3.4. Types of Fc Fusion Therapeutics
- 3.4.1. Antibody-based Fc Fusion Therapeutics
- 3.4.2. Cytokine-based Fc Fusion Therapeutics
- 3.4.3. Enzyme-based Fc Fusion Therapeutics
- 3.4.4. Peptide-based Fc Fusion Therapeutics
- 3.4.5. Receptor ECD-based Fc Fusion Therapeutics
- 3.5. Applications of Fc Fusion Therapeutics
- 3.6. Advantages of Fc Fusion Therapeutics over Other Biological Moieties
- 3.7. Future Perspectives
4. PIPELINE REVIEW: MARKETED AND CLINICAL DRUGS
- 4.1. Analysis Methodology and Key Parameters
- 4.2. Fc Fusion Therapeutics: Drug Pipeline
- 4.3. Fc Fusion Therapeutics: Pipeline Analysis
- 4.3.1. Analysis by Phase of Development
- 4.3.2. Analysis by Type of Fusion Molecule
- 4.3.3. Analysis by Target Gene
- 4.3.4. Analysis by Therapeutic Area(s)
- 4.3.5. Analysis by Target Disease Indication(s)
- 4.3.6. Analysis by Type of Therapy
- 4.3.7. Analysis by Route of Administration
- 4.3.8. Analysis by Dosing Frequency
- 4.4. Fc Fusion Therapeutics: List of Drug Developers
- 4.4.1. Analysis by Year of Establishment
- 4.4.2. Analysis by Company Size
- 4.4.3. Analysis by Location of Headquarters
- 4.4.4. Leading Developers
- 4.4.5. Grid Analysis: Distribution by Phase of Development, Company Size and Location of Headquarters
5. COMPANY PROFILES
- 5.1. Chapter Overview
- 5.2. Alphamab Oncology
- 5.2.1. Company Overview
- 5.2.2. Financial Information
- 5.2.3. Product Portfolio
- 5.2.4. Recent Developments and Future Outlook
- 5.3. Amgen
- 5.3.1. Company Overview
- 5.3.2. Financial Information
- 5.3.3. Product Portfolio
- 5.3.4. Recent Developments and Future Outlook
- 5.4. Acceleron Pharmaceuticals
- 5.4.1. Company Overview
- 5.4.2. Financial Information
- 5.4.3. Product Portfolio
- 5.4.4. Recent Developments and Future Outlook
- 5.5. Bristol Myers Squibb
- 5.5.1. Company Overview
- 5.5.2. Financial Information
- 5.5.3. Product Portfolio
- 5.5.4. Recent Developments and Future Outlook
- 5.6. Sanofi
- 5.6.1. Company Overview
- 5.6.2. Financial Information
- 5.6.3. Product Portfolio
- 5.6.4. Recent Developments and Future Outlook
6. CLINICAL TRIAL ANALYSIS
- 6.1. Analysis Methodology and Key Parameters
- 6.2. Fc Fusion Therapeutics: List of Clinical Trials
- 6.2.1. Analysis by Trial Registration Year
- 6.2.2. Analysis by Trial Phase
- 6.2.3. Analysis by Study Design
- 6.2.4. Analysis by Type of Masking
- 6.2.5. Analysis by Type of Intervention Model
- 6.2.6. World Cloud: Emerging Focus Areas
- 6.2.7. Analysis by Trial Registration Year and Geography
- 6.2.8. Analysis by Type of Sponsor
- 6.2.9. Leading Industry Players: Analysis by Number of Trials Registered
- 6.2.10. Leading Non-Industry Players: Analysis by Number of Trials Registered
- 6.2.11. Popular Indications: Analysis by Number of Registered Trials
- 6.2.12. Popular Interventions: Analysis by Number of Registered Trials
- 6.2.13. Geographical Analysis by Number of Registered Trials
- 6.2.14. Geographical Analysis by Number of Patients Enrolled
7. ACADEMIC GRANT ANALYSIS
- 7.1. Analysis Methodology and Key Parameters
- 7.2. Fc Fusion Therapeutics: Analysis of Academic Grants
- 7.2.1. Analysis by Year of Grant Award
- 7.2.2. Analysis by Amount Awarded
- 7.2.3. Analysis by Administering Institute Center
- 7.2.4. Analysis by Support Period
- 7.2.5. Analysis by Type of Grant Application
- 7.2.6. Analysis by Purpose of Grant Award
- 7.2.7. Analysis by Activity Code
- 7.2.8. Word Cloud Analysis: Emerging Focus Areas
- 7.2.9. Popular NIH Departments: Analysis by Number of Grants
- 7.2.10. Prominent Program Officers: Analysis by Number of Grants
- 7.2.11. Popular Recipient Organizations: Analysis by Number of Grants
8. PUBLICATION ANALYSIS
- 8.1. Analysis Methodology and Key Parameters
- 8.2. Fc Fusion Therapeutics: Recent Publications
- 8.3. Analysis by Year of Publication
- 8.4. Word Cloud Analysis: Emerging Focus Areas
- 8.5. Analysis by Target Therapeutic Area
- 8.6. Leading Authors: Analysis by Number of Publications
- 8.7. Key Journals: Analysis by Number of Publications
9. PATENT ANALYSIS
- 9.1. Analysis Methodology and Key Parameters
- 9.2. Fc Fusion Therapeutics: Patent Analysis
- 9.2.1. Analysis by Publication Year
- 9.2.2. Analysis by Type of Patent
- 9.2.3. Analysis by Geographical Location
- 9.2.4. Analysis by Patent Age
- 9.2.5. Analysis by CPC Symbols
- 9.2.6. Word Cloud Analysis: Emerging Focus Areas
- 9.2.7. Leading Patent Assignees: Analysis by Number of Patents
- 9.2.8. Leading Industry Players: Analysis by Number of Patents
- 9.2.9. Leading Non-Industry Players: Analysis by Number of Patents
- 9.2.10. Fc Fusion Therapeutics: Patent Benchmarking Analysis
- 9.2.11. Fc Fusion Therapeutics: Patent Valuation Analysis
10. PARTNERSHIPS AND COLLABORATIONS
- 10.1. Analysis Methodology and Key Parameters
- 10.2. Partnership Models
- 10.3. Fc Fusion Therapeutics: List of Partnerships and Collaborations
- 10.3.1. Analysis by Year of Partnership
- 10.3.2. Analysis by Type of Partnership
- 10.3.3. Analysis by Type of Partnership and Type of Fusion molecule
- 10.3.4. Analysis by Year of Partnership and Type of Partner
- 10.3.5. Analysis by Type of Partnership and Type of Partner
- 10.3.6. Most Active Players: Analysis by Number of Partnerships
- 10.3.7. Regional Analysis
- 10.3.7.1. Intercontinental and Intracontinental Agreements
11. MARKET SIZING AND OPPORTUNITY ANALYSIS
- 11.1. Forecast Methodology and Key Assumptions
- 11.2. Global Fc Fusion Therapeutics Market, Till 2035
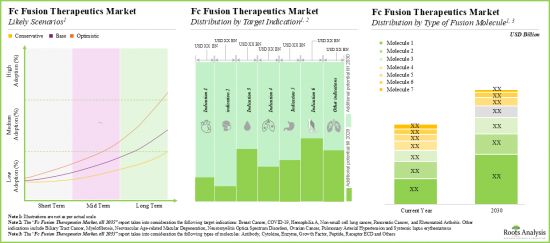
- 11.3. Global Fc Fusion Therapeutics Market, Till 2035: Distribution by Target Indication
- 11.4. Global Fc Fusion Therapeutics Market, Till 2035: Distribution by Type of Fusion Molecule
- 11.5. Global Fc Fusion Therapeutics Market, Till 2035: Distribution by Type of Therapy
- 11.6. Global Fc Fusion Therapeutics Market, Till 2035: Distribution by Route of Administration
- 11.7. Global Fc Fusion Therapeutics Market, Till 2035: Distribution by Geography
- 11.8. Fc Fusion Therapeutics: Individual Product Sales Forecasts
- 11.8.1. ABP 938 (Amgen)
- 11.8.2. Alprolix(R) (Sanofi)
- 11.8.3. AnBaiNuo(R) (Hisun Pharmaceuticals)
- 11.8.4. Arcalyst(R) (Kiniska Pharmaceuticals)
- 11.8.5. BIVV001 (Sanofi)
- 11.8.6. CD24Fc (Merck)
- 11.8.7. Eloctate(R) (Biogen)
- 11.8.8. Eylea(TM) (Regeneron Pharmaceuticals)
- 11.8.9. FRSW107 (Zhengzhou Gensciences)
- 11.8.10. KN035 (Alphamab Oncology)
- 11.8.11. KN046 (Alphamab Oncology)
- 11.8.12. Lumitin(R) (Chengdu Kanghong Biotech)
- 11.8.13. Reblozyl(R) (Bristol-Myers Squibb)
- 11.8.14. RyzneutaTM (Evive Biotech)
- 11.8.15. Strensiq(R) (AstraZeneca)
- 11.8.16. Telitacicept (RemeGen)
12. CASE STUDY: FC PROTEIN ENGINEERED AND GLYCOENGINEERED ANTIBODIES
- 12.1. Fc Protein Engineered and Glycoengineered Antibodies: Drug Pipeline
- 12.1.1. Analysis by Phase of Development
- 12.1.2. Analysis by Target Disease Indication
- 12.1.3. Analysis by Therapeutic Area
- 12.1.4. Analysis by Type of Fc Engineering
- 12.1.5. Analysis by Impact of Fc Engineering
- 12.1.6. Analysis by Route of Administration
- 12.1.7. Analysis by Type of Therapy
- 12.2. Fc Protein Engineered and Glycoengineered Antibodies: List of Developers
- 12.2.1. Analysis by Year of Establishment
- 12.2.2. Analysis by Company Size
- 12.2.3. Analysis by Location of Headquarters
13. CONCLUSION
14. APPENDIX 1: TABULATED DATA
15. APPENDIX 2: LIST OF COMPANIES AND ORGANIZATIONS
List of Tables
- Table 4.1 Fc Fusion Therapeutics: Drug Pipeline
- Table 4.2 Fc Fusion Therapeutics: List of Drug Developers
- Table 5.1 Fc Fusion Therapeutics: List of Companies Profiled
- Table 5.2 Drug Profile: KN015
- Table 5.3 Drug Profile: KN046
- Table 5.4 Drug Profile: KN035
- Table 5.5 Drug Profile: KN058
- Table 5.6 Drug Profile: KN055
- Table 5.7 Drug Profile: KN019
- Table 5.8 Alphamab Oncology: Recent Developments and Future Outlook
- Table 5.9 Drug Profile: AMG 386
- Table 5.10 Drug Profile: AMG 592
- Table 5.11 Drug Profile: ABP 938
- Table 5.12 Drug Profile: Enbrel(R)
- Table 5.13 Drug Profile: Nplate(R)
- Table 5.14 Amgen: Recent Developments and Future Outlook
- Table 5.15 Drug Profile: ACE-1334
- Table 5.16 Drug Profile: ACE-011
- Table 5.17 Acceleron Pharmaceuticals: Recent Developments and Future Outlook
- Table 5.18 Drug Profile: AVID200
- Table 5.19 Drug Profile: Orencia(R)
- Table 5.20 Drug Profile: Nulojix(R)
- Table 5.21 Drug Profile: REBLOZYL(R)
- Table 5.22 Bristol-Myers Squibb: Recent Developments and Future Outlook
- Table 5.23 Drug Profile: Alprolix(R)
- Table 5.24 Drug Profile: BIVV001
- Table 5.25 Drug Profile: Zaltrap(R)
- Table 5.26 Sanofi: Recent Developments and Future Outlook
- Table 6.1 Fc Fusion Therapeutics: List of Clinical Trials
- Table 10.1 Fc Fusion Therapeutics: List of Partnerships and Collaborations
- Table 12.1 Fc Protein Engineered and Glycoengineered Antibodies: Drug Pipeline
- Table 12.2 Fc Protein Engineered and Glycoengineered Antibodies: List of Drug Developers
- Table 14.1 Fc Fusion Therapeutics: Distribution by Phase of Development
- Table 14.2 Fc Fusion Therapeutics: Distribution by Type of Fusion Molecule
- Table 14.3 Fc Fusion Therapeutics: Distribution by Target Gene
- Table 14.4 Fc Fusion Therapeutics: Distribution by Therapeutic Area(s)
- Table 14.5 Fc Fusion Therapeutics: Distribution by Target Disease Indication(s)
- Table 14.6 Fc Fusion Therapeutics: Distribution by Type of Therapy
- Table 14.7 Fc Fusion Therapeutics: Distribution by Route of Administration
- Table 14.8 Fc Fusion Therapeutics: Distribution by Dosing Frequency
- Table 14.9 Fc Fusion Therapeutics: Distribution by Year of Establishment
- Table 14.10 Fc Fusion Therapeutics: Distribution by Company Size
- Table 14.11 Fc Fusion Therapeutics: Distribution by Location of Headquarters
- Table 14.12 Fc Fusion Therapeutics: Distribution by Leading Developers
- Table 14.13 Amgen: Annual Revenues, Since 2016 (USD Billion)
- Table 14.14 Acceleron Pharmaceuticals: Annual Revenues, Since 2016 (USD Billion)
- Table 14.15 Bristol Myers Squibb: Annual Revenues, Since 2016 (USD Billion)
- Table 14.16 Sanofi: Annual Revenues, Since 2016 (USD Billion)
- Table 14.17 Clinical Trial Analysis: Distribution by Trial Registration Year
- Table 14.18 Clinical Trial Analysis: Distribution by Trial Phase
- Table 14.19 Clinical Trial Analysis: Distribution by Study Design
- Table 14.20 Clinical Trial Analysis: Distribution by Type of Masking
- Table 14.21 Clinical Trial Analysis: Distribution by Type of Intervention Model
- Table 14.22 Clinical Trial Analysis: Distribution by Trial Registration Year and Geography
- Table 14.23 Clinical Trial Analysis: Distribution by Type of Sponsor
- Table 14.24 Leading Industry Players: Distribution by Number of Trials Registered
- Table 14.25 Leading Non-Industry Players: Distribution by Number of Trials Registered
- Table 14.26 Popular Indications: Analysis by Number of Registered Trials
- Table 14.27 Popular Interventions: Analysis by Number of Registered Trials
- Table 14.28 Popular Indications: Distribution by Number of Registered Trials
- Table 14.29 Popular Interventions: Distribution by Number of Registered Trials
- Table 14.30 Clinical Trial Analysis: Geographical Distribution by Number of Registered Trials
- Table 14.31 Clinical Trial Analysis: Geographical Distribution by Number of Patients Enrolled
- Table 14.32 Grant Analysis: Cumulative Trend by Year of Grant Award, Since 2010
- Table 14.33 Grant Analysis: Cumulative Distribution by Amount Awarded (USD Million), Since 2010
- Table 14.34 Grant Analysis: Distribution by Administering Institute Center
- Table 14.35 Grant Analysis: Distribution by Support Period
- Table 14.36 Grant Analysis: Distribution by Type of Grant Application
- Table 14.37 Grant Analysis: Distribution by Purpose of Grant Award
- Table 14.38 Grant Analysis: Distribution by Activity Code
- Table 14.39 Popular NIH Departments: Distribution by Number of Grants
- Table 14.40 Prominent Program Officers: Distribution by Number of Grants
- Table 14.41 Popular Recipient Organizations: Distribution by Number of Grants
- Table 14.42 Publication Analysis: Cumulative Year-wise Trend, Since 2010
- Table 14.43 Publication Analysis: Distribution by Target Therapeutic Area
- Table 14.44 Leading Authors: Distribution by Number of Publications
- Table 14.45 Key Journals: Distribution by Number of Publications
- Table 14.46 Patent Analysis: Distribution by Publication Year
- Table 14.47 Patent Analysis: Distribution by Type of Patent
- Table 14.48 Patent Analysis: Distribution by Geographical Location
- Table 14.49 Patent Analysis: Distribution by Patent Age
- Table 14.50 Patent Analysis: Distribution by CPC Symbols
- Table 14.51 Leading Patent Assignees: Distribution by Number of Patents
- Table 14.52 Leading Industry Players: Distribution by Number of Patents
- Table 14.53 Patent Analysis: Distribution by Patent Benchmarking
- Table 14.54 Patent Analysis: Distribution by Patent Valuation
- Table 14.55 Partnerships and Collaborations: Cumulative Year-wise Trend, Since 2015
- Table 14.56 Partnerships and Collaborations: Distribution by Type of Partnership
- Table 14.57 Partnerships and Collaborations: Distribution by Type of Partnership and Type of Fusion Molecule
- Table 14.58 Partnerships and Collaborations: Distribution by Year of Partnership and Type of Partner
- Table 14.59 Partnerships and Collaborations: Distribution by Type of Partnership and Type of Partner
- Table 14.60 Most Active Players: Distribution by Number of Partnerships
- Table 14.61 Partnerships and Collaborations: Regional Distribution
- Table 14.62 Global Fc Fusion Therapeutics Market, Till 2035 (USD Million)
- Table 14.63 Global Fc Fusion Therapeutics Market, Till 2035: Distribution by Target Indication (USD Million)
- Table 14.64 Global Fc Fusion Therapeutics Market, Till 2035: Distribution by Type of Therapy (USD Million)
- Table 14.65 Global Fc Fusion Therapeutics Market, Till 2035: Distribution by Route of Administration (USD Million
- Table 14.66 Global Fc Fusion Therapeutics Market, Till 2035: Distribution by Geography (USD Million)
- Table 14.67 ABP 938: Sales Forecast, Till 2035 (USD Million)
- Table 14.68 Alprolix(R): Sales Forecast, Till 2035 (USD Million)
- Table 14.69 AnBaiNuo(R): Sales Forecast, Till 2035 (USD Million)
- Table 14.70 Arcalyst(R): Sales Forecast, Till 2035 (USD Million)
- Table 14.71 BIVV001: Sales Forecast, Till 2035 (USD Million)
- Table 14.72 CD24Fc: Sales Forecast, Till 2035 (USD Million)
- Table 14.73 Eloctate(R): Sales Forecast, Till 2035 (USD Million)
- Table 14.74 Eylea(TM): Sales Forecast, Till 2035 (USD Million)
- Table 14.75 FRSW107: Sales Forecast, Till 2035 (USD Million)
- Table 14.76 KN035: Sales Forecast, Till 2035 (USD Million)
- Table 14.77 KN046: Sales Forecast, Till 2035 (USD Million)
- Table 14.78 Lumitin(R): Sales Forecast, Till 2035 (USD Million)
- Table 14.79 Reblozyl(R): Sales Forecast, Till 2035 (USD Million)
- Table 14.80 RyzneutaTM: Sales Forecast, Till 2035 (USD Million)
- Table 14.81 Strensiq(R): Sales Forecast, Till 2035 (USD Million)
- Table 14.82 Telitacicept: Sales Forecast, Till 2035 (USD Million)
- Table 14.83 Fc Protein Engineered and Glycoengineered Antibodies: Analysis by Phase of Development
- Table 14.84 Fc Protein Engineered and Glycoengineered Antibodies: Analysis by Target Disease Indication
- Table 14.85 Fc Protein Engineered and Glycoengineered Antibodies: Analysis by Therapeutic Area
- Table 14.86 Fc Protein Engineered and Glycoengineered Antibodies: Analysis by Type of Fc Engineering
- Table 14.87 Fc Protein Engineered and Glycoengineered Antibodies: Analysis by Impact of Fc Engineering
- Table 14.88 Fc Protein Engineered and Glycoengineered Antibodies: Analysis by Route of Administration
- Table 14.89 Fc Protein Engineered and Glycoengineered Antibodies: Analysis by Type of Therapy
- Table 14.90 Fc Protein Engineered and Glycoengineered Antibodies Developers: Analysis by Year of Establishment
- Table 14.91 Fc Protein Engineered and Glycoengineered Antibodies Developers Analysis by Company Size
- Table 14.92 Fc Protein Engineered and Glycoengineered Antibodies Developers Analysis by Location of Headquarters
List of Figures
- Figure 2.1 Executive Summary: Overall Market Landscape
- Figure 2.2 Executive Summary: Clinical Trial Analysis
- Figure 2.3 Executive Summary: Academic Grant Analysis
- Figure 2.4 Executive Summary: Publication Analysis
- Figure 2.5 Executive Summary: Patent Analysis
- Figure 2.6 Executive Summary: Partnerships and Collaborations
- Figure 2.7 Executive Summary: Market Forecast
- Figure 3.1 Components of Fc Fusion Therapeutics
- Figure 3.2 Mechanism of Action
- Figure 4.1 Fc Fusion Therapeutics: Distribution by Phase of Development
- Figure 4.2 Fc Fusion Therapeutics: Distribution by Type of Fusion Molecule
- Figure 4.3 Fc Fusion Therapeutics: Distribution by Target Gene
- Figure 4.4 Fc Fusion Therapeutics: Distribution by Therapeutic Area(s)
- Figure 4.5 Fc Fusion Therapeutics: Distribution by Target Disease Indication(s)
- Figure 4.6 Fc Fusion Therapeutics: Distribution by Type of Therapy
- Figure 4.7 Fc Fusion Therapeutics: Distribution by Route of Administration
- Figure 4.8 Fc Fusion Therapeutics: Distribution by Dosing Frequency
- Figure 4.9 Fc Fusion Therapeutics Developers: Distribution by Year of Establishment
- Figure 4.10 Fc Fusion Therapeutics Developers: Distribution by Company Size
- Figure 4.11 Fc Fusion Therapeutics Developers: Distribution by Location of Headquarters
- Figure 4.12 Leading Developers: Distribution by Number of Fc Fusion Therapeutics
- Figure 4.13 Grid Analysis: Distribution by Phase of Development, Company Size and Location of Headquarters
- Figure 5.1 Amgen: Annual Revenues, Since 2016 (USD Billion)
- Figure 5.2 Acceleron Pharmaceuticals: Annual Revenues, Since 2016 (USD Billion)
- Figure 5.3 Bristol Myers Squibb: Annual Revenues, Since 2016 (USD Billion)
- Figure 5.4 Sanofi: Annual Revenues, Since 2016 (USD Billion)
- Figure 6.1 Clinical Trial Analysis: Distribution by Trial Registration Year
- Figure 6.2 Clinical Trial Analysis: Distribution by Trial Phase
- Figure 6.3 Clinical Trial Analysis: Distribution by Study Design
- Figure 6.4 Clinical Trial Analysis: Distribution by Type of Masking
- Figure 6.5 Clinical Trial Analysis: Distribution by Type of Intervention Model
- Figure 6.6 World Cloud Analysis: Emerging Focus Areas
- Figure 6.7 Clinical Trial Analysis: Distribution by Trial Registration Year and Geography
- Figure 6.8 Clinical Trial Analysis: Distribution by Type of Sponsor
- Figure 6.9 Leading Industry Players: Distribution by Number of Trials Registered
- Figure 6.10 Leading Non-Industry Players: Distribution by Number of Trials Registered
- Figure 6.11 Popular Indications: Distribution by Number of Registered Trials
- Figure 6.12 Popular Interventions: Distribution by Number of Registered Trials
- Figure 6.13 Popular Indications: Distribution by Number of Registered Trials
- Figure 6.14 Popular Interventions: Distribution by Number of Registered Trials
- Figure 6.15 Clinical Trial Analysis: Geographical Distribution by Number of Registered Trials
- Figure 6.16 Clinical Trial Analysis: Geographical Distribution by Number of Patients Enrolled
- Figure 7.1 Grant Analysis: Cumulative Trend by Year of Grant Award, Since 2010
- Figure 7.2 Grant Analysis: Cumulative Distribution by Amount Awarded (USD Million), Since 2010
- Figure 7.3 Grant Analysis: Distribution by Administering Institute Center
- Figure 7.4 Grant Analysis: Distribution by Support Period
- Figure 7.5 Grant Analysis: Distribution by Type of Grant Application
- Figure 7.6 Grant Analysis: Distribution by Purpose of Grant Award
- Figure 7.7 Grant Analysis: Distribution by Activity Code
- Figure 7.8 Word Cloud Analysis: Emerging Focus Areas
- Figure 7.9 Popular NIH Departments: Distribution by Number of Grants
- Figure 7.10 Prominent Program Officers: Distribution by Number of Grants
- Figure 7.11 Popular Recipient Organizations: Distribution by Number of Grants
- Figure 8.1 Publication Analysis: Cumulative Year-wise Trend, Since 2010
- Figure 8.2 Word Cloud Analysis: Emerging Focus Areas
- Figure 8.3 Publication Analysis: Distribution by Target Therapeutic Area
- Figure 8.4 Leading Authors: Distribution by Number of Publications
- Figure 8.5 Key Journals: Distribution by Number of Publications
- Figure 9.1 Patent Analysis: Distribution by Publication Year
- Figure 9.2 Patent Analysis: Distribution by Type of Patent
- Figure 9.3 Patent Analysis: Distribution by Geographical Location
- Figure 9.4 Patent Analysis: Distribution by Patent Age
- Figure 9.5 Patent Analysis: Distribution by CPC Symbols
- Figure 9.6 Word Cloud Analysis: Emerging Focus Areas
- Figure 9.7 Leading Patent Assignees: Distribution by Number of Patents
- Figure 9.8 Leading Industry Players: Distribution by Number of Patents
- Figure 9.9 Leading Non-Industry Players: Distribution by Number of Patents
- Figure 9.10 Patent Analysis: Distribution by Patent Benchmarking
- Figure 9.11 Patent Analysis: Distribution by Patent Valuation
- Figure 10.1 Partnerships and Collaborations: Cumulative Year-wise Trend, Since 2015
- Figure 10.2 Partnerships and Collaborations: Distribution by Type of Partnership
- Figure 10.3 Partnerships and Collaborations: Distribution by Type of Partnership and Type of Fusion Molecule
- Figure 10.4 Partnerships and Collaborations: Distribution by Year of Partnership and Type of Partner
- Figure 10.5 Partnerships and Collaborations: Distribution by Type of Partnership and Type of Partner
- Figure 10.6 Most Active Players: Distribution by Number of Partnerships
- Figure 10.7 Partnerships and Collaborations: Regional Distribution
Figure 10.7.1 Partnerships and Collaborations: Intercontinental and Intracontinental Agreements
- Figure 11.1 Global Fc Fusion Therapeutics Market, Till 2035 (USD Million)
- Figure 11.2 Global Fc Fusion Therapeutics Market, Till 2035: Distribution by Target Indication (USD Million)
- Figure 11.3 Global Fc Fusion Therapeutics Market, Till 2035: Distribution by Type of Fusion Molecule (USD Million)
- Figure 11.4 Global Fc Fusion Therapeutics Market, Till 2035: Distribution by Type of Therapy (USD Million)
- Figure 11.5 Global Fc Fusion Therapeutics Market, Till 2035: Distribution by Route of Administration (USD Million
- Figure 11.6 Global Fc Fusion Therapeutics Market, Till 2035: Distribution by Geography (USD Million)
- Figure 11.7 ABP 938: Sales Forecast, Till 2035 (USD Million)
- Figure 11.8 Alprolix(R): Sales Forecast, Till 2035 (USD Million)
- Figure 11.9 AnBaiNuo(R): Sales Forecast, Till 2035 (USD Million)
- Figure 11.10 Arcalyst(R): Sales Forecast, Till 2035 (USD Million)
- Figure 11.11 BIVV001: Sales Forecast, Till 2035 (USD Million)
- Figure 11.12 CD24Fc: Sales Forecast, Till 2035 (USD Million)
- Figure 11.13 Eloctate(R): Sales Forecast, Till 2035 (USD Million)
- Figure 11.14 Eylea(TM): Sales Forecast, Till 2035 (USD Million)
- Figure 11.15 FRSW107: Sales Forecast, Till 2035 (USD Million)
- Figure 11.16 KN035: Sales Forecast, Till 2035 (USD Million)
- Figure 11.17 KN046: Sales Forecast, Till 2035 (USD Million)
- Figure 11.18 Lumitin(R): Sales Forecast, Till 2035 (USD Million)
- Figure 11.19 Reblozyl(R): Sales Forecast, Till 2035 (USD Million)
- Figure 11.20 RyzneutaTM: Sales Forecast, Till 2035 (USD Million)
- Figure 11.21 Strensiq(R): Sales Forecast, Till 2035 (USD Million)
- Figure 11.21 Telitacicept: Sales Forecast, Till 2035 (USD Million)
- Figure 12.1 Fc Protein Engineered and Glycoengineered Antibodies: Analysis by Phase of Development
- Figure 12.2 Fc Protein Engineered and Glycoengineered Antibodies: Analysis by Target Disease Indication
- Figure 12.3 Fc Protein Engineered and Glycoengineered Antibodies: Analysis by Therapeutic Area
- Figure 12.4 Fc Protein Engineered and Glycoengineered Antibodies: Analysis by Type of Fc Engineering
- Figure 12.5 Fc Protein Engineered and Glycoengineered Antibodies: Analysis by Impact of Fc Engineering
- Figure 12.6 Fc Protein Engineered and Glycoengineered Antibodies: Analysis by Route of Administration
- Figure 12.7 Fc Protein Engineered and Glycoengineered Antibodies: Analysis by Type of Therapy
- Figure 12.8 Fc Protein Engineered and Glycoengineered Antibodies Developers: Analysis by Year of Establishment
- Figure 12.9 Fc Protein Engineered and Glycoengineered Antibodies Developers Analysis by Company Size
- Figure 12.10 Fc Protein Engineered and Glycoengineered Antibodies Developers Analysis by Location of Headquarters
- Figure 13.1 Concluding Remarks: Overall market Landscape
- Figure 13.2 Concluding Remarks: Clinical Trial Analysis
- Figure 13.3 Concluding Remarks: Academic Grants Analysis
- Figure 13.4 Concluding Remarks: Publication Analysis
- Figure 13.5 Concluding Remarks: Patent Analysis
- Figure 13.6 Concluding Remarks: Partnerships and Collaborations
- Figure 13.7 Concluding Remarks: Market Forecast
 全球免疫球蛋白融合蛋白市場規模、佔有率、趨勢和成長分析報告(2026-2034年)
 融合蛋白市場:按類型、技術、形式、應用、最終用戶和分銷管道分類-2026-2032年全球預測
 2025年全球融合蛋白市場