


 |
市場調查報告書
商品編碼
1771288
生物性保存技術市場:產業趨勢和全球預測 - 保存狀態,血清類別,生物學的樣品類別,各應用領域,包裝形態類別,各終端用戶,各地區Biopreservation Market: Industry Trends and Global Forecasts - Distribution by Preservation Condition, Type of Serum, Type of Biological Sample, Area of Application, Type of Packaging Format, End Users, and Geographical Region : |
||||||
全球生物性保存技術市場:概要
預計2035年,生物保存市場規模將從目前的19億美元成長至155億美元,預測期內複合年增長率為23.6%。
市場區隔包括以下參數的市場規模和機會分析:
保存狀態
- 冷藏
- 冷凍/冷鏈
- 冷凍(超低溫冷凍)/深層冷凍
- 低溫/液態氮蒸氣儲存
血清類型
- 牛胎兒血清含有培養基
- 小牛胎兒血清含有培養基
- 人血清含有培養基
- 無血清培養基
生物學的樣品類型
- 生殖細胞/幹細胞
- 內臟器官
- 體細胞
- 組織
應用領域
- 診斷
- 研究開發
- 治療
包裝形態類型
- 袋
- 瓶
- 管瓶
- 其他
終端用戶
- 學術研究機關
- 生物銀行/基因庫
- 醫院
- 製藥·生物科技企業
- 其他
地區
- 北美
- 歐洲
- 亞洲
- 中東·北非
- 南美
- 其他地區
全球生物保存市場:成長與趨勢
近年來,受對有效治療方案日益增長的需求的推動,細胞類產品的開發顯著增長。然而,這些產品對溫度變化高度敏感,通常需要冷凍或低溫條件才能安全運輸和儲存。根據美國食品藥物管理局 (USFDA) 的一項調查,超過 80% 的間質細胞治療申請表明需要冷凍保存。這凸顯了對先進保存策略的迫切需求,這些策略既要最大限度地減少壓力誘導的遺傳選擇,又要保護基因組和蛋白質組的完整性(而目前大多數保存方法都存在不足)。
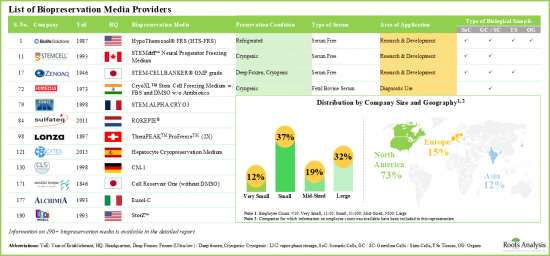
生物保存是唯一一種用於離體保存細胞、組織和器官以供保存、裝運和運輸的生物學方法。此外,生物保存透過將細胞和分子生物學的突破與工程理念相結合,為各種產品相關的課題提供了解決方案。因此,行業利益相關者越來越多地轉向預配製和市售的生物保存介質。生物保存介質是有效保存生物樣本最重要的因素之一。培養基類型的選擇取決於所需的保存時長、待保存的生物樣本類型以及生物保存的目的。目前,多家公司提供 190 種生物保存和生物樣本庫解決方案,用於保存和儲存各種類型的生物樣本。
全球生物保存市場:關鍵洞察
本報告深入探討了全球生物保存市場的現狀,並識別了該行業的潛在成長機會。報告的主要發現包括:
- 全球有 60 多家公司提供用於在不同保存條件下保存生物樣本的生物保存培養基。
- 生物保存培養基有多種包裝類型,適用於各種生物樣本。
- 近 45% 用於保存體細胞的生物保存培養基不含血清。
- 大多數生物保存培養基(約 90%)支持低溫儲存,代表性產品包括 C80EZ 2X、C80EZ 標準培養基、C80EZ-Neuron 和 C80EZ-TISSUE。
- 提供多種包裝類型培養基的知名公司包括 Akron Biotech、BioLife Solutions、Fuji Film、Protide Pharmaceuticals 和 ScienCell Research Laboratories。
- 為了獲得競爭優勢,各公司正致力於穩定提升其所提供培養基的性能。
- 合作活動的增加顯示了利害關係人的興趣。
- 近期,現有企業和新進業者已簽署多項合作協議。
- 但預計中長期內將與知名學術機構簽署協議。
- 成本是決定此類生物保存介質被接受和採用的關鍵因素。定價策略矩陣將有助於進入者評估其產品的市場競爭力。
- 受溫度敏感產品日益普及的推動,預計到2035年,生物保存介質供應商市場將以每年超過23.6%的速度成長。
- 預期的市場機會在各種最終用戶、生物樣本、包裝類型和主要地理區域內分佈均勻。
生物性保存技術市場參與企業案例
- BioLife Solutions
- Cell Applications
- HiMedia Laboratories
- Merck
- Thermo Fisher Scientific
- United States Biological
- ZenBio
本報告概述了全球生物保存市場,包括按保存狀態、血清類型、生物樣本類型、應用領域、包裝類型、最終用戶趨勢、區域趨勢和公司概況劃分的市場佔有率。
目錄
第1章 序文
第2章 摘要整理
第3章 簡介
- 章概要
- 生物性保存技術簡介
- 生物性保存技術的類型
- 生物性保存技術媒體的應用
- 生物性保存技術培養基的優點與限制
- 結論
第4章 市場形勢
- 章概要
- 生物性保存技術培養基供應商:服務供應商的形勢
- 生物性保存技術培養基:市場形勢
第5章 重要的洞察
第6章 企業的競爭力
- 章概要
- 前提主要的參數
- 調查手法
- 產品系列的強度的基準
- 夥伴關係活動的基準
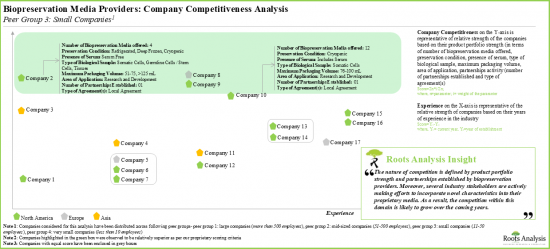
- 生物性保存技術培養基供應商:企業競爭力分析
第7章 企業簡介
- 章概要
- BioLife Solutions
- Cell Applications
- HiMedia Laboratories
- Merck
- Thermo Fischer Scientific
- United States Biological
- ZenBio
第8章 夥伴關係和合作
- 章概要
- 夥伴關係模式
- 生物性保存技術培養基供應商:夥伴關係和合作
第9章 Bowman Clock的價格策略
第10章 市場規模的評估與機會分析
- 章概要
- 預測調查手法主要的前提條件
- 生物性保存技術培養基供應商市場,2035年
- 生物性保存技術培養基供應商市場:保存狀態
- 生物性保存技術培養基供應商市場:血清類別
- 生物性保存技術媒體供應商市場:生物學的樣品類別
- 生物性保存技術培養基供應商市場:各應用領域
- 生物性保存技術培養基供應商市場:包裝形態類別
- 生物性保存技術培養基供應商市場:各終端用戶
- 生物性保存技術培養基供應商市場:各地區
- 結論
第11章 結論
第12章 執行洞察
第13章 附錄I:表格形式資料
第14章 附錄II:企業及組織一覽
GLOBAL BIOPRESERVATION MARKET: OVERVIEW
As per Roots Analysis, the biopreservation market is estimated to grow from USD 1.9 billion in the current year to USD 15.5 billion by 2035, at a CAGR of 23.6% during the forecast period, till 2035.
The market sizing and opportunity analysis has been segmented across the following parameters:
Preservation Condition
- Refrigerated
- Frozen / Cold Chain
- Frozen (Ultra-low) / DeeAp Frozen
- Cryogenic / LN2 Vapor Phase Storage
Type of Serum
- Fetal Bovine Serum Containing Media
- Fetal Calf Serum Containing Media
- Human Serum Containing Media
- Serum Free Media
Type of Biological Sample
- Germline Cells / Stem Cells
- Organs
- Somatic Cells
- Tissues
Area of Application
- Diagnostic Use
- Research and Development
- Therapeutic Use
Type of Packaging Format
- Bags
- Bottles
- Vials
- Others
End Users
- Academic and Research Institutes
- Biobanks / Genebanks
- Hospitals
- Pharmaceutical and Biotechnology Companies
- Other End Users
Geographical Region
- North America
- Europe
- Asia
- Middle East and North Africa
- Latin America
- Rest of the World
GLOBAL BIOPRESERVATION MARKET: GROWTH AND TRENDS
In recent years, there has been a noticeable increase in the development of cell-based products, driven by the rising demand for effective therapeutic solutions. However, these products are highly sensitive to temperature fluctuations and often require freezing or cryogenic conditions for safe transport and storage. According to a study by the USFDA, over 80% of submissions for mesenchymal cell-based therapies indicated a need for cryopreservation. This highlights the urgent need for advanced preservation strategies that can safeguard both genomic and proteomic integrity, while minimizing stress-induced genetic selection (an aspect where most current preservation methods fall short).
Biopreservation is the exclusive biological approach designated for the preservation of cells, tissues and organs ex-vivo for the purpose of storage, shipment and transportation. Further, biopreservation offers solutions to various product-related challenges by integrating engineering concepts with breakthroughs in cellular and molecular biology. Consequently, industry stakeholders are increasingly turning to pre-formulated, commercially available biopreservation media. Biopreservation media is one of the most crucial entities in conferring effectiveness in preservation of biological samples. The selection of the type of media depends upon the considerable time duration desired for the storage, type of biological material to be preserved and the purpose of biopreservation. Currently, various companies are engaged in providing 190 biopreservation and biobanking solutions designed for the storage and preservation of various types of biological samples.
GLOBAL BIOPRESERVATION MARKET: KEY INSIGHTS
The report delves into the current state of global biopreservation market and identifies potential growth opportunities within industry. Some key findings from the report include:
- Globally, over 60 companies provide biopreservation media, intended for the preservation of biological samples at different preservation conditions.
- Biopreservation media is available in different packaging formats that are compatible with a variety of biological samples.
- Amongst the biopreservation media intended for preservation of somatic cells, nearly 45% are serum free; of these, majority are being used for storage at cryogenic conditions.
- Largely, the biopreservation media support preservation at cryogenic conditions (~90%), prominent examples include C80EZ 2X, C80EZ Standard Medium, C80EZ-Neuron, and C80EZ-TISSUE.
- Prominent examples of companies offering media in multiple packaging formats include Akron Biotech, BioLife Solutions, Fujifilm, Protide Pharmaceuticals, and ScienCell Research Laboratories.
- In order to build a competitive advantage, companies are focused on steadily improving the characteristics of their media offerings.
- The growing interest of stakeholders is also evident from the rise in partnership activity; a relatively larger proportion of the deals were signed by companies based in the US.
- Both established players and new entrants have signed several partnerships in the recent past; most of the companies (~45%) are actively signing manufacturing and supply agreements.
- Industry players have emerged as preferred choice of partner for companies of variable employee strength; however, in mid-to-long term, we expect firms to ink agreements with renowned academic institutes as well.
- Cost is a key determinant of the acceptance and adoption of such biopreservation media; pricing strategy matrix is likely to assist players in evaluating the competitive market prices for their offerings.
- Driven by the rising approval of temperature sensitive products, the market for biopreservation media providers is poised to grow at an annualized rate of over 23.6%, till 2035.
- The projected market opportunity is likely to be well distributed across different end users, biological samples, packaging formats and key geographical regions.
Example Players in the Biopreservation Market
- BioLife Solutions
- Cell Applications
- HiMedia Laboratories
- Merck
- Thermo Fisher Scientific
- United States Biological
- ZenBio
GLOBAL BIOPRESERVATION MARKET: RESEARCH COVERAGE
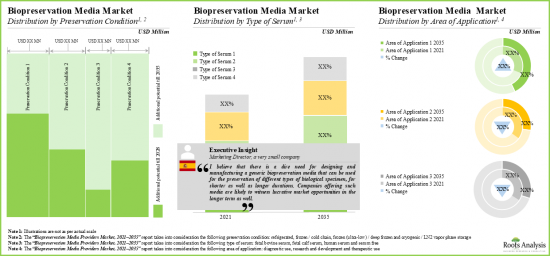
- Market Sizing and Opportunity Analysis: The report features an in-depth analysis of the global biopreservation market, focusing on key market segments, including [A] preservation condition, [B] type of serum, [C] type of biological sample, [D] area of application, [E] type of packaging format, [F] end users and [E] geographical regions.
- Market Landscape: A comprehensive evaluation of the current biopreservation media providers' landscape, considering various parameters, such as [A] year of establishment, [B] company size, [C] type of company and [D] location of headquarters. Additionally, a comprehensive evaluation of biopreservation media based on several relevant parameters, such as [A] preservation condition, [B] type of serum, [C] type of biological sample, [D] area of application, [E] type of packaging format, [F] packaging volume and [G] product price.
- Key Insights: In-depth analysis of market trends, focusing on location of headquarters and leading players engaged in offering biopreservation media based on the parameters, such as [A] year of establishment, [B] company size, [C] number of biopreservation media offered and [D] region. Further, an insightful representation of biopreservation media, distributed based on [A] preservation condition and [B] area of application, a grid representation illustrating the distribution of biopreservation media based on [A] company size, [B] region, preservation condition, [C] type of serum and type of biological sample, and a heat map representation of biopreservation media, distributed on the basis of [A] minimum packaging volume and [B] minimum price.
- Company Competitiveness Analysis: A comprehensive competitive analysis of biopreservation media providers, examining factors, such as [A] years of experience, [B] product portfolio strength and [C] partnership activity.
- Company Profiles: In-depth profiles of companies engaged in this domain, focusing on [A] company overview, and [B] recent developments and an informed future outlook.
- Partnerships and Collaborations: An insightful analysis of the deals inked by stakeholders in the biopreservation market, based on several parameters, such as [A] year of partnership, [B] type of partnership, [C] type of partner, [D] most active players (in terms of the number of partnerships signed) and [E] geography.
- Bowman Clock Pricing Strategy: In-depth analysis of a framework to understand the pricing strategy of the biopreservation media provided by the company along with its competitive position.
KEY QUESTIONS ANSWERED IN THIS REPORT
- How many companies are currently engaged in this market?
- Which are the leading companies in this market?
- What factors are likely to influence the evolution of this market?
- What is the current and future market size?
- What is the CAGR of this market?
- How is the current and future market opportunity likely to be distributed across key market segments?
REASONS TO BUY THIS REPORT
- The report provides a comprehensive market analysis, offering detailed revenue projections of the overall market and its specific sub-segments. This information is valuable to both established market leaders and emerging entrants.
- Stakeholders can leverage the report to gain a deeper understanding of the competitive dynamics within the market. By analyzing the competitive landscape, businesses can make informed decisions to optimize their market positioning and develop effective go-to-market strategies.
- The report offers stakeholders a comprehensive overview of the market, including key drivers, barriers, opportunities, and challenges. This information empowers stakeholders to stay abreast of market trends and make data-driven decisions to capitalize on growth prospects.
ADDITIONAL BENEFITS
- Complimentary PPT Insights Packs
- Complimentary Excel Data Packs for all Analytical Modules in the Report
- 15% Free Content Customization
- Detailed Report Walkthrough Session with Research Team
- Free Updated report if the report is 6-12 months old or older
TABLE OF CONTENTS
1. PREFACE
- 1.1. Scope of the Report
- 1.2. Research Methodology
- 1.2.1. Research Assumptions
- 1.2.2. Project Methodology
- 1.2.3. Forecast Methodology
- 1.2.4. Robust Quality Control
- 1.2.5. Key Considerations
- 1.2.5.1. Demographics
- 1.2.5.2. Economic Factors
- 1.2.5.3. Government Regulations
- 1.2.5.4. Supply Chain
- 1.2.5.5. COVID Impact / Related Factors
- 1.2.5.6. Market Access
- 1.2.5.7. Healthcare Policies
- 1.2.5.8. Industry Consolidation
- 1.3 Key Questions Answered
- 1.4. Chapter Outlines
2. EXECUTIVE SUMMARY
- 2.1. Chapter Overview
3. INTRODUCTION
- 3.1. Chapter Overview
- 3.2. Introduction to Biopreservation
- 3.3. Type of Biopreservation
- 3.3.1. Hypothermic Preservation
- 3.3.2. Cryopreservation
- 3.4. Applications of Biopreservation Media
- 3.5. Benefits and Limitations of Biopreservation Media
- 3.6. Concluding Remarks
4. MARKET LANDSCAPE
- 4.1. Chapter Overview
- 4.2. Biopreservation Media Providers: Service Providers Landscape
- 4.2.1. Analysis by Year of Establishment
- 4.2.2. Analysis by Company Size
- 4.2.3. Analysis by Type of Company
- 4.2.4. Analysis by Location of Headquarters
- 4.3. Biopreservation Media: Market Landscape
- 4.3.1. Analysis by Preservation Condition
- 4.3.2. Analysis by Type of Serum
- 4.3.3. Analysis by Type of Biological Sample
- 4.3.4. Analysis by Area of Application
- 4.3.5. Analysis by Type of Packaging Format
- 4.3.6. Analysis by Packaging Volume
- 4.3.7. Analysis by Product Price
5. KEY INSIGHTS
- 5.1. Chapter Overview
- 5.2. Analysis by Location of Headquarters (World Map Representation)
- 5.3. Analysis by Year of Establishment, Company Size, Number of Biopreservation Media Offered and Region (4D Bubble Chart)
- 5.4. Analysis by Preservation Condition and Area of Application (Treemap Representation)
- 5.5. Analysis by Company Size, Region, Preservation Condition, Type of Serum and Type of Biological Sample (Grid Representation)
- 5.6. Analysis by Minimum Packaging Volume and Minimum Price (Heat Map Representation)
6. COMPANY COMPETITIVENESS
- 6.1. Chapter Overview
- 6.2. Assumptions and Key Parameters
- 6.3. Methodology
- 6.4. Benchmarking of Product Portfolio Strength
- 6.5. Benchmarking of Partnership Activity
- 6.6. Biopreservation Media Providers: Company Competitiveness Analysis
- 6.6.1. Company Competitiveness Analysis: Very Small Companies
- 6.6.2. Company Competitiveness Analysis: Small Companies
- 6.6.3. Company Competitiveness Analysis: Mid-Sized Companies
- 6.6.4. Company Competitiveness Analysis: Large Companies
7. COMPANY PROFILES
- 7.1. Chapter Overview
- 7.2. BioLife Solutions
- 7.2.1. Company Overview
- 7.2.2. Recent Developments and Future Outlook
- 7.3. Cell Applications
- 7.3.1. Company Overview
- 7.3.2. Recent Developments and Future Outlook
- 7.4. HiMedia Laboratories
- 7.4.1. Company Overview
- 7.4.2. Recent Developments and Future Outlook
- 7.5. Merck
- 7.5.1. Company Overview
- 7.5.2. Recent Developments and Future Outlook
- 7.6. Thermo Fischer Scientific
- 7.6.1. Company Overview
- 7.6.2. Recent Developments and Future Outlook
- 7.7. United States Biological
- 7.7.1. Company Overview
- 7.7.2. Recent Developments and Future Outlook
- 7.8. ZenBio
- 7.8.1. Company Overview
- 7.8.2. Recent Developments and Future Outlook
8. PARTNERSHIPS AND COLLABORATIONS
- 8.1. Chapter Overview
- 8.2. Partnership Models
- 8.3. Biopreservation Media Providers: Partnerships and Collaborations
- 8.3.1. Analysis by Year of Partnership
- 8.3.2. Analysis by Type of Partnership
- 8.3.2.1. Analysis by Year and Type of Partnership
- 8.3.2.2. Analysis by Type of Partnership and Company Size
- 8.3.3. Analysis by Type of Partner
- 8.3.3.1. Analysis by Year of Partnership and Type of Partner
- 8.3.3.2. Analysis by Type of Partner and Type of Partnership
- 8.3.3.3. Analysis by Type of Partner and Company Size
- 8.3.4. Most Active Players: Analysis by Number of Partnerships
- 8.3.5. Regional Analysis
- 8.3.5.1. Local and International Deals
- 8.3.5.2. Intercontinental and Intracontinental Deals
- 8.3.5.3. Analysis by Location of Headquarters of Partner
- 8.3.5.4. Analysis by Location of Headquarters of Partner and Type of Partnership
9. BOWMAN CLOCK PRICING STRATEGY
- 9.1. Chapter Overview
- 9.2. Bowman Strategy Clock
- 9.2.1. Two Dimensions of Bowman Strategy Clock
- 9.2.2. Eight Positions on Bowman Strategy Clock
- 9.3. Roots Analysis Framework
- 9.3.1. Methodology
- 9.3.2. Theoretical Framework and Price Evaluation Hypothesis
- 9.3.3. Results and Interpretation
- 9.3.3.1. Product Price Evaluation Matrix: Information on Preservation Condition
- 9.3.3.2. Product Price Evaluation Matrix: Information on Type of Serum
- 9.3.3.3. Product Price Evaluation Matrix: Information on Type of Biological Sample
- 9.3.3.4. Product Price Evaluation Matrix: Information on Minimum Packaging Volume
- 9.3.3.5. Product Price Evaluation Matrix: Information on Maximum Packaging Volume
- 9.3.3.6. Product Price Evaluation Matrix: Information on Packaging Format
- 9.3.3.7. Product Price Evaluation Matrix: Information on Area of Application
- 9.3.4. Concluding Remarks
10. MARKET SIZING AND OPPORTUNITY ANALYSIS
- 10.1. Chapter Overview
- 10.2. Forecast Methodology and Key Assumptions
- 10.3. Biopreservation Media Providers Market, Till 2035
- 10.4. Biopreservation Media Providers Market: Distribution by Preservation Condition
- 10.4.1. Biopreservation Media Providers Market for Cryogenic / LN2 Vapor Phase, Till 2035
- 10.4.2. Biopreservation Media Providers Market for Frozen (Ultra-low) / Deep Frozen, Till 2035
- 10.4.3. Biopreservation Media Providers Market for Frozen / Cold Chain, Till 2035
- 10.4.4. Biopreservation Media Providers Market for Refrigerated, Till 2035
- 10.5. Biopreservation Media Providers Market: Distribution by Type of Serum
- 10.5.1. Biopreservation Media Providers Market for Fetal Bovine Serum Containing Media, Till 2035
- 10.5.2. Biopreservation Media Providers Market for Fetal Calf Serum Containing Media, Till 2035
- 10.5.3. Biopreservation Media Providers Market for Human Serum Containing Media, Till 2035
- 10.5.4. Biopreservation Media Providers Market for Serum Free Media, Till 2035
- 10.6. Biopreservation Media Providers Market: Distribution by Type of Biological Sample
- 10.6.1. Biopreservation Media Providers Market for Germline Cells / Stem Cells, Till 2035
- 10.6.2. Biopreservation Media Providers Market for Organs, Till 2035
- 10.6.3. Biopreservation Media Providers Market for Somatic Cells, Till 2035
- 10.6.4. Biopreservation Media Providers Market for Tissues, Till 2035
- 10.7. Biopreservation Media Providers Market: Distribution by Area of Application
- 10.7.1. Biopreservation Media Providers Market for Diagnostic Use, Till 2035
- 10.7.2. Biopreservation Media Providers Market for Research and Development, Till 2035
- 10.7.3. Biopreservation Media Providers Market for Therapeutic Use, Till 2035
- 10.8. Biopreservation Media Providers Market: Distribution by Type of Packaging Format
- 10.8.1. Biopreservation Media Providers Market for Bags, Till 2035
- 10.8.2. Biopreservation Media Providers Market for Bottles, Till 2035
- 10.8.3. Biopreservation Media Providers Market for Vials, Till 2035
- 10.8.4. Biopreservation Media Providers Market for Others, Till 2035
- 10.9. Biopreservation Media Providers Market: Distribution by End Users
- 10.9.1. Biopreservation Media Providers Market for Academic and Research Institutes, Till 2035
- 10.9.2. Biopreservation Media Providers Market for Biobanks / Genebanks, Till 2035
- 10.9.3. Biopreservation Media Providers Market for Hospitals, Till 2035
- 10.9.4. Biopreservation Media Providers Market for Pharmaceutical and Biotechnology Companies, Till 2035
- 10.9.5. Biopreservation Media Providers Market for Other End Users, Till 2035
- 10.10. Biopreservation Media Providers Market: Distribution by Region
- 10.10.1. Biopreservation Media Providers Market in North America, Till 2035
- 10.10.2. Biopreservation Media Providers Market in Europe, Till 2035
- 10.10.3. Biopreservation Media Providers Market in Asia, Till 2035
- 10.10.4. Biopreservation Media Providers Market in MENA, Till 2035
- 10.10.5. Biopreservation Media Providers Market in Latin America, Till 2035
- 10.10.6. Biopreservation Media Providers Market in Rest of the World, Till 2035
- 10.11. Concluding Remarks
11. CONCLUSION
- 11.1. Chapter Overview
12. EXECUTIVE INSIGHTS
- 12.1. Chapter Overview
- 12.2. Company A
- 12.2.1. Company Snapshot
- 12.2.2. Interview Transcript: Marketing Director
13. APPENDIX I: TABULATED DATA
14. APPENDIX II: LIST OF COMPANIES AND ORGANIZATION
List of Tables
- Table 4.1 Biopreservation Media Providers: Information on Year of Establishment, Company Size, Location of Headquarters (Country-wise and Region-wise) and Company Type
- Table 4.2 Biopreservation Media: Information on Preservation Condition
- Table 4.3 Biopreservation Media: Information on Type of Serum
- Table 4.4 Biopreservation Media: Information on Type of Biological Sample
- Table 4.5 Biopreservation Media: Information on Area of Application
- Table 4.6 Biopreservation Media: Information on Type of Packaging Format
- Table 4.7 Biopreservation Media: Information on Packaging Volume and Product Price
- Table 6.1 Company Competitiveness Analysis: Benchmarking of Product Portfolio Strength
- Table 6.2 Company Competitiveness Analysis: Benchmarking of Partnership Activity
- Table 6.3 Company Competitiveness Analysis: List of Very Small Players
- Table 6.4 Company Competitiveness Analysis: List of Small Players
- Table 6.5 Company Competitiveness Analysis: List of Mid-Sized Players
- Table 6.6 Company Competitiveness Analysis: List of Large Players
- Table 7.1 List of Companies Profiled
- Table 7.2 BioLife Solutions: Company Overview
- Table 7.3 BioLife Solutions: Recent Developments and Future Outlook
- Table 7.4 Cell Applications: Company Overview
- Table 7.5 HiMedia Laboratories: Company Overview
- Table 7.6 HiMedia Laboratories: Recent Developments and Future Outlook
- Table 7.7 Merck: Company Overview
- Table 7.8 Merck: Recent Developments and Future Outlook
- Table 7.9 Thermo Fischer Scientific: Company Overview
- Table 7.10 Thermo Fischer Scientific: Recent Developments and Future Outlook
- Table 7.11 United States Biological: Company Overview
- Table 7.12 ZenBio: Company Overview
- Table 7.13 ZenBio: Recent Developments and Future Outlook
- Table 8.1 Biopreservation Media: List of Collaborations, Since 2015
- Table 8.2 Biopreservation Media Providers: Partnerships and Collaborations, Information on Type of Agreement (Local and International Deals) and (Intercontinental and Intracontinental Deals), Since 2015
- Table 9.1 Product Price Evaluation Matrix: Information on Preservation Condition (USD)
- Table 9.2 Product Price Evaluation Matrix: Information on Type of Serum (USD)
- Table 9.3 Product Price Evaluation Matrix: Information on Type of Biological Sample (USD)
- Table 9.4 Product Price Evaluation Matrix: Information on Minimum Packaging Volume (USD)
- Table 9.5 Product Price Evaluation Matrix: Information on Maximum Packaging Volume (USD)
- Table 9.6 Product Price Evaluation Matrix: Information on Packaging Format (USD)
- Table 9.7 Product Price Evaluation Matrix: Information on Area of Application (USD)
- Table 12.1 Cytes Biotechnologies: Company Snapshot
- Table 13.1 Biopreservation Media Providers: Distribution by Year of Establishment
- Table 13.2 Biopreservation Media Providers: Distribution by Company Size
- Table 13.3 Biopreservation Media Providers: Distribution by Type of Company
- Table 13.4 Biopreservation Media Providers: Distribution by Location of Headquarters
- Table 13.5 Biopreservation Media: Distribution by Preservation Condition
- Table 13.6 Biopreservation Media: Distribution by Type of Serum
- Table 13.7 Biopreservation Media: Distribution by Type of Biological Sample
- Table 13.8 Biopreservation Media: Distribution by Area of Application
- Table 13.9 Biopreservation Media: Distribution by Type of Packaging Format
- Table 13.10 Biopreservation Media: Distribution by Minimum Packaging Volume (mL)
- Table 13.11 Biopreservation Media: Distribution by Maximum Packaging Volume (mL)
- Table 13.12 Biopreservation Media: Distribution by Minimum Price (USD)
- Table 13.13 Biopreservation Media: Distribution by Maximum Price (USD)
- Table 13.14 Partnerships and Collaborations: Cumulative Year-wise Trend, Since 2015
- Table 13.15 Partnerships and Collaborations: Distribution by Type of Partnership
- Table 13.16 Partnerships and Collaborations: Distribution by Year and Type of Partnership
- Table 13.17 Partnerships and Collaborations: Distribution by Type of Partnership and Company Size
- Table 13.18 Partnerships and Collaborations: Distribution by Type of Partner
- Table 13.19 Partnerships and Collaborations: Year-wise Distribution by Type of Partner
- Table 13.20 Partnerships and Collaborations: Distribution by Type of Partner and Type of Partnership
- Table 13.21 Partnerships and Collaborations: Distribution by Type of Partner and Company Size
- Table 13.22 Partnerships and Collaborations: Distribution by Number of Partnerships
- Table 13.23 Partnerships and Collaborations: Local and International Deals
- Table 13.24 Partnerships and Collaborations: Intercontinental and Intracontinental Deals
- Table 13.25 Partnerships and Collaborations: Distribution by Location of Headquarters of Partner
- Table 13.26 Partnerships and Collaborations: Distribution by Location of Headquarters of Partner and Type of Partnership
- Table 13.27 Biopreservation Media Providers Market, Till 2035, Conservative, Base and Optimistic Scenarios (USD Million)
- Table 13.28 Biopreservation Media Providers Market: Distribution by Preservation Condition
- Table 13.29 Biopreservation Media Providers Market for Cryogenic / LN2 Vapor Phase, Till 2035, Conservative, Base and Optimistic Scenarios (USD Million)
- Table 13.30 Biopreservation Media Providers Market for Frozen (Ultra-low) / Deep Frozen, Till 2035, Conservative, Base and Optimistic Scenarios (USD Million)
- Table 13.31 Biopreservation Media Providers Market for Frozen / Cold Chain, Till 2035, Conservative, Base and Optimistic Scenarios (USD Million)
- Table 13.32 Biopreservation Media Providers Market for Refrigerated, Till 2035, Conservative, Base and Optimistic Scenarios (USD Million)
- Table 13.33 Biopreservation Media Providers Market: Distribution by Type of Serum
- Table 13.34 Biopreservation Media Providers Market for Fetal Bovine Serum Containing Media, Till 2035, Conservative, Base and Optimistic Scenarios (USD Million)
- Table 13.35 Biopreservation Media Providers Market for Fetal Calf Serum Containing Media, Till 2035, Conservative, Base and Optimistic Scenarios (USD Million)
- Table 13.36 Biopreservation Media Providers Market for Human Serum Containing Media, Till 2035, Conservative, Base and Optimistic Scenarios (USD Million)
- Table 13.37 Biopreservation Media Providers Market for Serum Free Media, Till 2035, Conservative, Base and Optimistic Scenarios (USD Million)
- Table 13.38 Biopreservation Media Providers Market: Distribution by Type of Biological Sample
- Table 13.39 Biopreservation Media Providers Market for Germline Cells / Stem Cells, Till 2035, Conservative, Base and Optimistic Scenarios (USD Million)
- Table 13.40 Biopreservation Media Providers Market for Organs, Till 2035, Conservative, Base and Optimistic Scenarios (USD Million)
- Table 13.41 Biopreservation Media Providers Market for Somatic Cells, Till 2035, Conservative, Base and Optimistic Scenarios (USD Million)
- Table 13.42 Biopreservation Media Providers Market for Tissues, Till 2035, Conservative, Base and Optimistic Scenarios (USD Million)
- Table 13.43 Biopreservation Media Providers Market: Distribution by Area of Application
- Table 13.44 Biopreservation Media Providers Market for Diagnostic Use, Till 2035, Conservative, Base and Optimistic Scenarios (USD Million)
- Table 13.45 Biopreservation Media Providers Market for Research and Development, Till 2035, Conservative, Base and Optimistic Scenarios (USD Million)
- Table 13.46 Biopreservation Media Providers Market for Therapeutic Use, Till 2035, Conservative, Base and Optimistic Scenarios (USD Million)
- Table 13.47 Biopreservation Media Providers Market: Distribution by Type of Packaging Format
- Table 13.48 Biopreservation Media Providers Market for Bags, Till 2035, Conservative, Base and Optimistic Scenarios (USD Million)
- Table 13.49 Biopreservation Media Providers Market for Bottles, Till 2035, Conservative, Base and Optimistic Scenarios (USD Million)
- Table 13.50 Biopreservation Media Providers Market for Vials, Till 2035, Conservative, Base and Optimistic Scenarios (USD Million)
- Table 13.51 Biopreservation Media Providers Market for Others, Till 2035, Conservative, Base and Optimistic Scenarios (USD Million)
- Table 13.52 Biopreservation Media Providers Market: Distribution by End Users
- Table 13.53 Biopreservation Media Providers Market for Academic and Research Institutes, Till 2035, Conservative, Base and Optimistic Scenarios (USD Million)
- Table 13.54 Biopreservation Media Providers Market for Biobanks / Genebanks, Till 2035, Conservative, Base and Optimistic Scenarios (USD Million)
- Table 13.55 Biopreservation Media Providers Market for Hospitals, Till 2035, Conservative, Base and Optimistic Scenarios (USD Million)
- Table 13.56 Biopreservation Media Providers Market for Pharmaceutical and Biotechnology Companies, Till 2035, Conservative, Base and Optimistic Scenarios (USD Million)
- Table 13.57 Biopreservation Media Providers Market for Other End Users, Till 2035, Conservative, Base and Optimistic Scenarios (USD Million)
- Table 13.58 Biopreservation Media Providers Market: Distribution by Region
- Table 13.59 Biopreservation Media Providers Market in North America, Till 2035, Conservative, Base and Optimistic Scenarios (USD Million)
- Table 13.60 Biopreservation Media Providers Market in Europe, Till 2035, Conservative, Base and Optimistic Scenarios (USD Million)
- Table 13.61 Biopreservation Media Providers Market in Asia, Till 2035, Conservative, Base and Optimistic Scenarios (USD Million)
- Table 13.62 Biopreservation Media Providers Market in MENA, Till 2035, Conservative, Base and Optimistic Scenarios (USD Million)
- Table 13.63 Biopreservation Media Providers Market in Latin America, Till 2035, Conservative, Base and Optimistic Scenarios (USD Million)
- Table 13.64 Biopreservation Media Providers Market in Rest of the World, Till 2035, Conservative, Base and Optimistic Scenarios (USD Million)
List of Figures
- Figure 2.1 Executive Summary: Service Providers Landscape
- Figure 2.2 Executive Summary: Market Landscape
- Figure 2.3 Executive Summary: Partnerships and Collaborations
- Figure 2.4 Executive Summary: Current and Future Market Potential
- Figure 3.1 Applications of Biopreservation Media
- Figure 3.2 Key Benefits and Limitations of Hypothermic Biopreservation Media
- Figure 3.3 Key Benefits and Limitations of Cryopreservation Media
- Figure 4.1 Biopreservation Media Providers: Distribution by Year of Establishment
- Figure 4.2 Biopreservation Media Providers: Distribution by Company Size
- Figure 4.3 Biopreservation Media Providers: Distribution by Type of Company
- Figure 4.4 Biopreservation Media Providers: Distribution by Location of Headquarters
- Figure 4.5 Biopreservation Media: Distribution by Preservation Condition
- Figure 4.6 Biopreservation Media: Distribution by Type of Serum
- Figure 4.7 Biopreservation Media: Distribution by Type of Biological Sample
- Figure 4.8 Biopreservation Media: Distribution by Area of Application
- Figure 4.9 Biopreservation Media: Distribution by Type of Packaging Format
- Figure 4.10 Biopreservation Media: Distribution by Minimum Packaging Volume (mL)
- Figure 4.11 Biopreservation Media: Distribution by Maximum Packaging Volume (mL)
- Figure 4.12 Biopreservation Media: Distribution by Minimum Price (USD)
- Figure 4.13 Biopreservation Media: Distribution by Maximum Price (USD)
- Figure 5.1 Biopreservation Media Providers: Distribution by Location of Headquarters (World Map Representation)
- Figure 5.2 Biopreservation Media Providers: Distribution by Year of Establishment, Company Size, Number of Biopreservation Media Offered and Region (4D Bubble Chart)
- Figure 5.3 Biopreservation Media: Distribution by Preservation Condition and Area of Application (Treemap Representation)
- Figure 5.4 Biopreservation Media: Distribution by Company Size, Region, Preservation Condition, Type of Serum and Type of Biological Sample (Grid Representation)
- Figure 5.5 Biopreservation Media: Distribution by Minimum Packaging Volume and Minimum Price (Heat Map Representation)
- Figure 6.1 Company Competitiveness Analysis: Benchmarking of Product Portfolio Strength
- Figure 6.2 Company Competitiveness Analysis: Benchmarking of Partnership Activity
- Figure 6.3 Company Competitiveness Analysis: Very Small Companies
- Figure 6.4 Company Competitiveness Analysis: Small Companies
- Figure 6.5 Company Competitiveness Analysis: Mid-Sized Companies
- Figure 6.6 Company Competitiveness Analysis: Large Companies
- Figure 8.1 Partnerships and Collaborations: Cumulative Year-wise Trend, Since 2015
- Figure 8.2 Partnerships and Collaborations: Logo Landscape
- Figure 8.3 Partnerships and Collaborations: Distribution by Type of Partnership
- Figure 8.4 Partnerships and Collaborations: Distribution by Year and Type of Partnership
- Figure 8.5 Partnerships and Collaborations: Distribution by Type of Partnership and Company Size
- Figure 8.6 Partnerships and Collaborations: Distribution by Type of Partner
- Figure 8.7 Partnerships and Collaborations: Year-wise Distribution by Type of Partner
- Figure 8.8 Partnerships and Collaborations: Distribution by Type of Partner and Type of Partnership
- Figure 8.9 Partnerships and Collaborations: Distribution by Type of Partner and Company Size
- Figure 8.10 Partnerships and Collaborations: Distribution by Number of Partnerships
- Figure 8.11 Partnerships and Collaborations: Local and International Deals
- Figure 8.12 Partnerships and Collaborations: Intercontinental and Intracontinental Deals
- Figure 8.13 Partnerships and Collaborations: Distribution by Location of Headquarters of Partner
- Figure 8.14 Partnerships and Collaborations: Distribution by Location of Headquarters of Partner and Type of Partnership
- Figure 9.1 Biopreservation Media: Bowman Clock Pricing Strategy Matrix
- Figure 9.2 Biopreservation Media: Bowman Clock Pricing Strategy Graphical Interpretation
- Figure 10.1 Biopreservation Media Providers Market, Till 2035 (USD Million)
- Figure 10.2 Biopreservation Media Providers Market: Distribution by Preservation Condition
- Figure 10.3 Biopreservation Media Providers Market for Cryogenic / LN2 Vapor Phase, Till 2035 (USD Million)
- Figure 10.4 Biopreservation Media Providers Market for Frozen (Ultra-low) / Deep Frozen, Till 2035 (USD Million)
- Figure 10.5 Biopreservation Media Providers Market for Frozen / Cold Chain, Till 2035 (USD Million)
- Figure 10.6 Biopreservation Media Providers Market for Refrigerated, Till 2035 (USD Million)
- Figure 10.7 Biopreservation Media Providers Market: Distribution by Type of Serum
- Figure 10.8 Biopreservation Media Providers Market for Fetal Bovine Serum Containing Media, Till 2035 (USD Million)
- Figure 10.9 Biopreservation Media Providers Market for Fetal Calf Serum Containing Media, Till 2035 (USD Million)
- Figure 10.10 Biopreservation Media Providers Market for Human Serum Containing Media, Till 2035 (USD Million)
- Figure 10.11 Biopreservation Media Providers Market for Serum Free Media, Till 2035 (USD Million)
- Figure 10.12 Biopreservation Media Providers Market: Distribution by Type of Biological Sample
- Figure 10.13 Biopreservation Media Providers Market for Germline Cells / Stem Cells, Till 2035 (USD Million)
- Figure 10.14 Biopreservation Media Providers Market for Organs, Till 2035 (USD Million)
- Figure 10.15 Biopreservation Media Providers Market for Somatic Cells, Till 2035 (USD Million)
- Figure 10.16 Biopreservation Media Providers Market for Tissues, Till 2035 (USD Million)
- Figure 10.17 Biopreservation Media Providers Market: Distribution by Area of Application
- Figure 10.18 Biopreservation Media Providers Market for Diagnostic Use, Till 2035 (USD Million)
- Figure 10.19 Biopreservation Media Providers Market for Research and Development, Till 2035 (USD Million)
- Figure 10.20 Biopreservation Media Providers Market for Therapeutic Use, Till 2035 (USD Million)
- Figure 10.21 Biopreservation Media Providers Market: Distribution by Type of Packaging Format
- Figure 10.22 Biopreservation Media Providers Market for Bags, Till 2035 (USD Million)
- Figure 10.23 Biopreservation Media Providers Market for Bottles, Till 2035 (USD Million)
- Figure 10.24 Biopreservation Media Providers Market for Vials, Till 2035 (USD Million)
- Figure 10.25 Biopreservation Media Providers Market for Others, Till 2035 (USD Million)
- Figure 10.26 Biopreservation Media Providers Market: Distribution by End Users
- Figure 10.27 Biopreservation Media Providers Market for Academic and Research Institutes, Till 2035 (USD Million)
- Figure 10.28 Biopreservation Media Providers Market for Biobanks / Genebanks, Till 2035 (USD Million)
- Figure 10.29 Biopreservation Media Providers Market for Hospitals, Till 2035 (USD Million)
- Figure 10.30 Biopreservation Media Providers Market for Pharmaceutical and Biotechnology Companies, Till 2035 (USD Million)
- Figure 10.31 Biopreservation Media Providers Market for Other End Users, Till 2035 (USD Million)
- Figure 10.32 Biopreservation Media Providers Market: Distribution by Region
- Figure 10.33 Biopreservation Media Providers Market in North America, Till 2035 (USD Million)
- Figure 10.34 Biopreservation Media Providers Market in Europe, Till 2035 (USD Million)
- Figure 10.35 Biopreservation Media Providers Market in Asia, Till 2035 (USD Million)
- Figure 10.36 Biopreservation Media Providers Market in MENA, Till 2035 (USD Million)
- Figure 10.37 Biopreservation Media Providers Market in Latin America, Till 2035 (USD Million)
- Figure 10.38 Biopreservation Media Providers Market in Rest of the World, Till 2035 (USD Million)
- Figure 10.39 Biopreservation Media Providers Market, Conservative, Base and Optimistic Scenarios (USD Million)
- Figure 11.1 Concluding Remarks: Current Market Landscape
- Figure 11.2 Concluding Remarks: Company Competitiveness Analysis
- Figure 11.3 Concluding Remarks: Partnerships and Collaborations
- Figure 11.4 Concluding Remarks: Market Sizing and Opportunity Analysis
 人類生物樣本保存市場:按產品、生物檢體、保存方法、應用、最終用戶和地區分類
 生物保存市場:2026-2032年全球市場預測(按產品類型、技術、檢體類型、應用和最終用戶分類)生物防腐劑市場:按產品類型、應用和地區分類
 生物保存市場報告:按產品類型、應用和地區分類(2026-2034 年)
 生物保存市場-全球及區域分析:按產品類型、應用、最終用戶和地區分類-分析與預測(2025-2035)
 全球生物保存市場:按產品、應用、細胞供應和地區分類-市場規模、產業動態、機會分析和預測(2026-2035 年)
 生物保存市場分析及預測(至2035年):依類型、產品、服務、技術、組件、應用、最終用戶、製程、設備、材料類型分類
 全球生物保存市場規模、佔有率、趨勢和成長分析報告(2026-2034)
 生物保存市場規模、佔有率和成長分析(按產品、生物樣本、應用、最終用戶和地區分類)—產業預測(2026-2033 年)生物保存市場報告:2031 年趨勢、預測與競爭分析