


 |
市場調查報告書
商品編碼
1771287
自動液體處理系統市場:產業趨勢和全球預測 - 各移液技術,各清洗技術,各種模式,類別設備,各用途,各終端用戶,主要各地區Automated Liquid Handling Systems Market: Industry Trends and Global Forecasts - Distribution by Pipetting Technology, Washing Technology, Modality, Type of Instrument, Application, End User and Key Geographical Regions |
||||||
全球自動液體處理系統市場:概要
預計2035年,全球自動化液體處理系統市場規模將從目前的32.6億美元成長至63.5億美元,預測期間內複合年增長率為6.9%。
市場區隔包括以下參數的市場規模和機會分析:
移液技術
- 接觸技術
- 空氣置換技術
- 活塞/容量式技術
- 音響技術
- 自由噴射技術
清洗技術
- 超音波技術
- 音響技術
- 離心技術
模式
- 固定晶片
- 拋棄式晶片
設備類型
- 獨立的
- 桌面式型工作站
- 多設備系統
- 其他
用途
- 連續稀釋
- 板複製
- PCR/qPCR安裝
- 孔板重組
- 高通量篩檢
- 全基因放大
- 細胞培養
- ELISA
- 細胞化驗分析
- 珠清洗
- 其他
終端用戶
- 生物科技及製藥公司
- 學術機構及政府研究機關
- 醫院及診斷中心
- 其他
主要地區
- 北美
- 歐洲
- 亞太地區
- 中東·北非
- 南美
全球自動化液體處理系統市場:成長與趨勢
近年來,生物製藥產業見證了實驗室科學領域的多項進步,包括自動化系統的出現。自動化液體處理系統在製藥業的應用徹底改變了現代實驗室的運作方式。自動化液體處理系統相對於手動方法的優勢是推動該市場成長的主要動力。此外,由於工作流程的改進,可以實現更高的通量、更高的準確性並顯著節省時間,越來越多的實驗室正在採用這些系統。過去二十年來,這些系統的應用提高了實驗室的競爭力。然而,為了充分發揮自動化液體處理系統的潛力並維持未來成長,必須克服各種障礙和現有課題。
許多利害關係人特別關注實驗室自動化領域的進步,例如開發具有液體分配功能的自動化液體處理系統。目前,超過 125 家公司參與自動化液體處理系統的製造,包括自動分配系統/自動微孔板洗板機。
全球自動化液體處理系統市場:關鍵洞察
本研究報告探討了全球自動化液體處理系統市場的現狀,並識別了產業內的潛在成長機會。報告的主要發現包括:
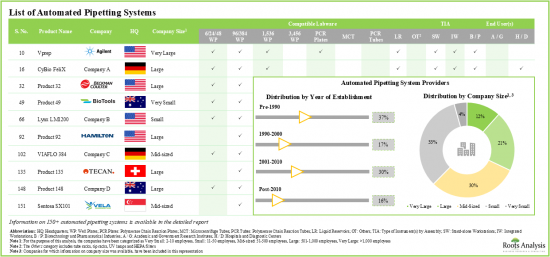
- 目前,全球 70 家知名公司聲稱提供 150 多種自動移液系統,其中 70% 以上的系統可用作整合工作站。
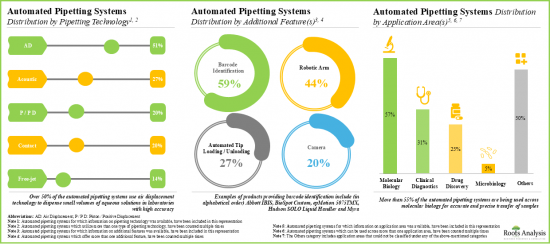
- 自動移液系統具有先進的功能,可提高可重複性和工作流程的準確性。近 60% 的系統具有條碼識別功能,可輕鬆追蹤樣本試劑。
- 為了在該行業中建立競爭優勢,利害關係人正在積極升級現有的自動分配系統,以豐富其產品組合。
- 在我們的研究中,我們發現超過 100 台自動化微孔板洗板機正用於生物製藥和製藥行業的各種應用。
- 近 80% 的自動化微孔板洗板機用作獨立工作站,以提供樣品製備的靈活性,並且超過 95% 的此類系統與平板微孔板相容。
- 值得注意的是,各公司正致力於在自動化微孔板洗板機中整合高級功能,以符合不斷發展的行業基準。
- 該領域的合作活動正以超過 30% 的複合年增長率增長,事實上,過去三年簽署的與自動化液體處理系統相關的交易數量最多。
- 最近,各利害關係人已提交/授予近 500 項與自動化液體處理系統相關的專利,這表明該領域的創新步伐正在加快。
- 隨著自動化液體處理系統需求的不斷增長,預計到 2035 年,市場複合年增長率將超過 6.9%。
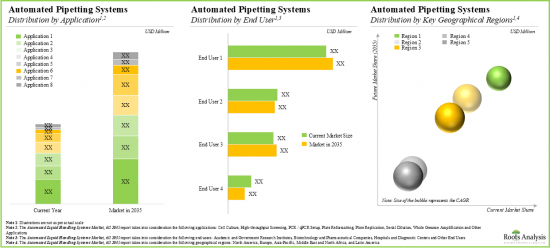
- 自動化液體處理設備市場目前和未來的機會廣泛分佈於各種應用、最終用戶和主要地區。
- 預計自動化微孔板洗板機市場的成長主要受聲波技術需求成長的推動,預計到2035年北美將佔據主要市場佔有率(35%)。
全球自動化液體處理系統市場:主要細分市場
空氣置換技術佔據自動化液體處理系統市場的最大佔有率。
根據移液技術,市場細分為接觸式技術、空氣置換技術、活塞/容積式技術、聲波技術和自由噴射技術。目前,空氣置換技術佔據全球自動化液體處理系統市場的大部分佔有率(約30%)。此外,與其他細分市場相比,聲學技術領域的成長速度可能更快。
按類型劃分,一次性吸頭是全球自動化液體處理系統市場中成長最快的細分市場。
依類型劃分,市場分為固定吸頭和一次性吸頭。目前,一次性吸頭在全球自動化液體處理系統市場中佔有最高佔有率(約75%)。值得注意的是,自動化液體處理系統市場的一次性吸頭細分市場很可能會以相對較高的複合年增長率成長。
依儀器類型劃分,獨立式細分市場在自動化液體處理系統市場中佔有最大佔有率
依儀器類型劃分,市場分為獨立式、單一桌上型工作站、多儀器系統及其他類型。目前,獨立式在自動化液體處理系統市場中佔有最大佔有率(約35%)。此外,多儀器系統細分市場很可能會以相對較高的複合年增長率成長。
按應用劃分,高通量篩選細分市場是預測期內自動化液體處理系統市場中成長最快的細分市場。
依應用劃分,市場分為連續稀釋、孔板複製、PCR/qPCR 建構、孔板重新格式化、高通量篩選、全基因組擴增、細胞培養、ELISA、基於細胞的檢測、珠子清洗和其他應用。目前,連續稀釋細分市場在自動化液體處理系統市場中佔有最高佔有率(超過 30%)。此外,值得注意的是,用於高通量篩選的自動化液體處理系統市場很可能會以相對較高的複合年增長率成長。
生技與製藥公司細分市場在全球自動化液體處理系統市場中佔有最大佔有率
根據最終用戶,市場細分為生物技術和製藥公司、學術和政府研究機構、醫院和診斷中心等。目前,生物技術和製藥公司佔據全球自動化液體處理系統市場的最大佔有率(約45%)。預計未來這一趨勢將保持不變。
北美佔最大市場佔有率。
依主要地區劃分,市場分為北美、歐洲、亞太地區、拉丁美洲以及中東和北非。目前,北美(約45%)在自動化液體處理系統市場佔據主導地位,擁有最大的收入佔有率。然而,預計亞太地區的市場將以更高的複合年增長率成長。
自動液體處理系統市場參與企業案例
- Agilent Technologies
- Beckman Coulter Life Sciences
- Eppendorf
- Hamilton Robotics
- MyGenostics
- Tecan
- Thermo Fisher Scientific
本報告概述了全球自動化液體處理系統市場,包括按移液技術、清潔技術、模式、設備類型、應用、最終用戶趨勢、區域趨勢和公司概況進行的市場概述。
目錄
第1章 序文
第2章 摘要整理
第3章 簡介
- 章概要
- 自動液體處理系統概要
- 手動和自動的液體處理
- 自動移液系統
- 自動微量盤洗滌儀
- 自動液體處理系統的用途
- 自動液體處理系統的引進的課題
- 未來展望
第4章 自動移液系統:市場形勢
- 章概要
- 自動移液系統:市場形勢
- 自動移液系統供應商的形勢
第5章 自動移液系統供應商:競爭力分析
- 章概要
- 前提主要的參數
- 調查手法
- 企業競爭力分析:自動移液系統供應商
- 北美公司(同類公司第一組)
- 歐洲公司(同類公司第二組)
- 亞太地區及世界其他地區公司(同類公司第三組)
第6章 自動移液系統供應商:企業簡介
- 章概要
- Beckman Coulter Life Sciences
- Eppendorf
- Hamilton Robotics
- MyGenostics
第7章 自動微量盤洗滌儀:市場形勢
- 章概要
- 自動微量盤洗滌儀:市場形勢
- 自動微量盤洗滌儀供應商的形勢
第8章 自動微量盤洗滌儀供應商:競爭力分析
- 章概要
- 前提主要的參數
- 調查手法
- 企業競爭力分析:自動微量盤洗滌儀供應商
- 北美公司(同類公司第一組)
- 歐洲公司(同類公司第二組)
- 亞太地區及世界其他地區公司(同類公司第三組)
第9章 自動微量盤洗滌儀供應商:企業簡介
- 章概要
- Agilent Technologies
- Tecan
- Thermo Fisher Scientific
第10章 夥伴關係和合作
- 章概要
- 夥伴關係模式
- 自動液體處理系統:夥伴關係和合作
第11章 專利分析
- 章概要
- 範圍與調查手法
- 自動液體處理系統:專利分析
- 自動液體處理系統:專利基準分析
- 自動液體處理系統:專利評估分析
- 主要專利:引用數分析
第12章 市場規模的評估與機會分析
- 章概要
- 調查手法主要的前提
- 全球自動液體處理系統市場(到2035年)
第13章 SWOT分析
- 章概要
- 自動液體處理系統:SWOT分析
- SWOT要素的比較
- 結論
第14章 結論
第15章 附錄I:表格形式資料
第16章 附錄II:企業及組織一覽
GLOBAL AUTOMATED LIQUID HANDLING SYSTEMS MARKET: OVERVIEW
As per Roots Analysis, the global automated liquid handling systems market is estimated to grow from USD 3.26 billion in the current year to USD 6.35 billion by 2035, at a CAGR of 6.9% during the forecast period, till 2035.
The market sizing and opportunity analysis has been segmented across the following parameters:
Pipetting Technology
- Contact Technology
- Air Displacement Technology
- Piston / Positive Displacement Technology
- Acoustic Technology
- Free-jet Technology
Washing Technology
- Ultrasonic Technology
- Acoustic Technology
- Centrifugal Technology
Modality
- Fixed Tips
- Disposable Tips
Type of Instrument
- Standalone
- Individual Benchtop Workstation
- Multi Instrument Systems
- Others
Application
- Serial Dilution
- Plate Replication
- PCR / qPCR Setup
- Plate Reformatting
- High-throughput Screening
- Whole Genome Amplification
- Cell Culture
- ELISA
- Cell-based Assays
- Bead Washing
- Other Applications
End User
- Biotechnology and Pharmaceutical Companies
- Academics and Government Research Institutes
- Hospitals and Diagnostic Centers
- Other End Users
Key Geographical Regions
- North America
- Europe
- Asia-Pacific
- Middle East and North Africa
- Latin America
GLOBAL AUTOMATED LIQUID HANDLING SYSTEMS MARKET: GROWTH AND TRENDS
In recent years, the biopharmaceutical domain has witnessed several advancements in the field of laboratory sciences, including the emergence of automated systems. The use of automated liquid handling systems in the pharmaceutical industry has revolutionized the way modern laboratories operate. The advantages offered by automated liquid handling systems over manual methods primarily drive the growth of this market. Moreover, due to the increased throughput, greater precision and improved workflows that allow significant time saving, more and more laboratories are now adopting these systems. This is being done in order to give laboratories a competitive edge in the past two decades. However, to leverage the full potential of automated liquid handlers and sustain growth in the future, it is important to address the various hurdles and existing challenges.
Notably, many stakeholders are focused on incorporating advancements in lab automation such as the development of automated liquid handling systems with the capability to dispense liquid volumes. Presently, over 125 companies are engaged in the manufacturing of automated liquid handlers including automated pipetting systems / automated microplate washers.
GLOBAL AUTOMATED LIQUID HANDLING SYSTEMS MARKET: KEY INSIGHTS
The report delves into the current state of global automated liquid handling systems market and identifies potential growth opportunities within industry. Some key findings from the report include:
- Presently, 70 well-established players across the globe claim to offer more than 150 automated pipetting systems; more than 70% of these systems can be used as integrated workstations.
- Automated pipetting systems are equipped with advanced features to enhance reproducibility and workflow accuracy; nearly 60% of the systems offer barcode identification for tracking sample reagents conveniently.
- In pursuit of building a competitive edge in this industry, stakeholders are actively upgrading their existing automated pipetting systems in order to augment their product portfolio offerings.
- During our research, we identified more than 100 automated microplate washers that have various applications in the biopharmaceutical and pharmaceutical industries.
- Close to 80% of the automated microplate washers are used as stand-alone workstations, offering flexibility in sample preparation; over 95% of such systems are compatible with flat microplates.
- It is worth highlighting that players are focused on the integration of advanced features into their automated microplate washers to comply with the evolving industry benchmarks.
- The partnership activity in this domain has increased at a CAGR of over 30%; in fact, the maximum deals related to automated liquid handling systems have been inked in the last three years.
- Around 500 patents related to automated liquid handling systems have recently been filed / granted by various stakeholders, indicating the growing pace of innovation in this field.
- With the rising demand for automated pipetting systems, the market is expected to grow at an annualized rate of more than 6.9% till 2035.
- The current and projected future automated pipetting systems market opportunity is likely to be well distributed across various applications, end users and key geographical regions.
- Growth in the automated microplate washer's domain is anticipated to be primarily driven by the rising demand of acoustic technology; North America is expected to capture larger share (35%) of the market by 2035.
GLOBAL AUTOMATED LIQUID HANDLING SYSTEMS MARKET: KEY SEGMENTS
Air Displacement Technology Segment Occupies the Largest Share of the Automated Liquid Handling Systems Market
Based on pipetting technology, the market is segmented into contact technology, air displacement technology, piston / positive displacement technology, acoustic technology and free-jet technology. At present, air displacement technology segment holds the majority share (~30%) of the global automated liquid handling systems market. Additionally, the acoustic technology segment is likely to grow at a faster pace compared to the other segments.
By Modality, Disposable Tips is the Fastest Growing Segment of the Global Automated Liquid Handling Systems Market
Based on the modality, the market is segmented into fixed tips and disposable tips. Currently, the disposable tips segment captures the highest proportion (~75%) of the global automated liquid handling systems market. It is worth highlighting that the automated liquid handling systems market for disposable tips segment is likely to grow at a relatively higher CAGR.
Standalone Segment Occupies the Largest Share of the Automated Liquid Handling Systems Market by Type of Instrument
Based on the type of instrument, the market is segmented into standalone, individual benchtop workstation, multi-instrument systems and others. At present, the standalone segment holds the maximum share (~35%) of the automated liquid handling systems market. In addition, the multi-instrument systems segment is likely to grow at a relatively higher CAGR.
By Application, the High-throughput Screening Segment is the Fastest Growing Segment of the Automated Liquid Handling Systems Market During the Forecast Period
Based on the application, the market is segmented into serial dilution, plate replication, PCR / qPCR setup, plate reformatting, high-throughput screening, whole genome amplification, cell culture, ELISA, cell-based assays, bead washing and other applications. Currently, serial dilution segment captures the highest proportion (>30%) of the automated liquid handling systems market. Further, it is worth highlighting that the automated liquid handling systems market for high-throughput screening is likely to grow at a relatively higher CAGR.
Biotechnology and Pharmaceutical Companies Segment Account for the Largest Share of the Global Automated Liquid Handling Systems Market
Based on the end user, the market is segmented into biotechnology and pharmaceutical companies, academic and government research institutes, hospitals and diagnostic centers and other end users. Currently, biotechnology and pharmaceutical companies segment holds the maximum share (~45%) of the global automated liquid handling systems market. This trend is likely to remain the same in the coming years.
North America Accounts for the Largest Share of the Market
Based on key geographical regions, the market is segmented into North America, Europe, Asia-Pacific, Latin America, and Middle East and North Africa. Currently, North America (~45%) dominates the automated liquid handling systems market and accounts for the largest revenue share. However, the market in Asia-Pacific is expected to grow at a higher CAGR.
Example Players in the Automated Liquid Handling Systems Market
- Agilent Technologies
- Beckman Coulter Life Sciences
- Eppendorf
- Hamilton Robotics
- MyGenostics
- Tecan
- Thermo Fisher Scientific
GLOBAL AUTOMATED LIQUID HANDLING SYSTEMS MARKET: RESEARCH COVERAGE
- Market Sizing and Opportunity Analysis: The report features an in-depth analysis of the global automated liquid handling systems market, focusing on key market segments, including [A] pipetting technology, [B] washing technology, [C] modality, [D] type of instrument, [E] application, [F] end user and [G] key geographical regions.
- Automated Pipetting Systems Market Landscape: A comprehensive evaluation of automated pipetting systems, considering various parameters, such as [A] pipetting technology, [B] certification(s), [C] type of instrument(s) by assembly, [D] pipetting head option(s), [E] weight of automated pipetting system (in kg), [F] compatible labware, [G] application area(s), [H] application(s), [I] additional feature(s) and [J] end user(s). Additionally, a comprehensive evaluation of automated pipetting system providers, based on parameters, such as [A] year of establishment, [B] company size (in terms of employee count) and [C] location of headquarters.
- Automated Pipetting System Providers Competitiveness Analysis: A comprehensive competitive analysis of automated pipetting system providers, examining factors, such as [A] company strength, [B] product diversity and [C] product strength.
- Automated Pipetting System Providers Company Profiles: In-depth profiles of companies engaged in the manufacturing of automated pipetting systems, focusing on [A] company overviews, [B] financial information (if available), [C] product portfolio and [D] recent developments and an informed future outlook.
- Automated Microplate Washers Market Landscape: A comprehensive evaluation of automated microplate washers, considering various parameters, such as [A] type of instrument(s), [B] compatible microplate(s), [C] weight of automated microplate washers (in Kg), [D] compatible labware, [E] application(s), and [F] end user(s). Additionally, a comprehensive evaluation of automated microplate washer providers, based on parameters, such as [A] year of establishment, [B] company size (in terms of employee count) and [C] location of headquarters.
- Automated Microplate Washer Providers Competitiveness Analysis: A comprehensive competitive analysis of automated microplate washer providers, examining factors, such as [A] company strength, [B] product diversity and [C] product strength.
- Automated Microplate Washer Providers Company Profiles: In-depth profiles of companies engaged in the manufacturing of automated microplate washers, focusing on [A] company overviews, [B] financial information (if available), [C] product portfolio and [D] recent developments and an informed future outlook.
- Partnerships and Collaborations: An insightful analysis of the deals inked by stakeholders in the automated liquid handling systems market, based on several parameters, such as [A] year of partnership, [B] type of partnership, [C] type of automated liquid handling system, [D] most popular products, [E] most active players (in terms of the number of partnerships signed) and [F] geographical distribution of partnership activity.
- Patent Analysis: An in-depth analysis of patents filed / granted till date in the automated liquid handling systems domain, based on various relevant parameters, such as [A] patent publication year, [B] type of patent, [C] patent jurisdiction, [D] CPC symbols, [F] type of applicant, [G] emerging focus areas, [H] leading players, [I] benchmarking analysis and [J] patent valuation.
- SWOT Analysis: An analysis of industry affiliated trends, opportunities and challenges, which are likely to impact the evolution of automated liquid handling systems market; it includes a Harvey ball analysis, assessing the relative impact of each SWOT parameter on industry dynamics.
KEY QUESTIONS ANSWERED IN THIS REPORT
- How many companies are currently engaged in this market?
- Which are the leading companies in this market?
- What factors are likely to influence the evolution of this market?
- What is the current and future market size?
- What is the CAGR of this market?
- How is the current and future market opportunity likely to be distributed across key market segments?
REASONS TO BUY THIS REPORT
- The report provides a comprehensive market analysis, offering detailed revenue projections of the overall market and its specific sub-segments. This information is valuable to both established market leaders and emerging entrants.
- Stakeholders can leverage the report to gain a deeper understanding of the competitive dynamics within the market. By analyzing the competitive landscape, businesses can make informed decisions to optimize their market positioning and develop effective go-to-market strategies.
- The report offers stakeholders a comprehensive overview of the market, including key drivers, barriers, opportunities, and challenges. This information empowers stakeholders to stay abreast of market trends and make data-driven decisions to capitalize on growth prospects.
ADDITIONAL BENEFITS
- Complimentary PPT Insights Packs
- Complimentary Excel Data Packs for all Analytical Modules in the Report
- 15% Free Content Customization
- Detailed Report Walkthrough Session with Research Team
- Free Updated report if the report is 6-12 months old or older
TABLE OF CONTENTS
1. PREFACE
- 1.1. Scope of the Report
- 1.2. Research Methodology
- 1.2.1. Research Assumptions
- 1.2.2. Project Methodology
- 1.2.3. Forecast Methodology
- 1.2.4. Robust Quality Control
- 1.2.5. Key Considerations
- 1.2.5.1. Demographics
- 1.2.5.2. Economic Factors
- 1.2.5.3. Government Regulations
- 1.2.5.4. Supply Chain
- 1.2.5.5. COVID Impact / Related Factors
- 1.2.5.6. Market Access
- 1.2.5.7. Healthcare Policies
- 1.2.5.8. Industry Consolidation
- 1.3 Key Questions Answered
- 1.4. Chapter Outlines
2. EXECUTIVE SUMMARY
3. INTRODUCTION
- 3.1. Chapter Overview
- 3.2. Overview of Automated Liquid Handling Systems
- 3.3. Manual versus Automated Liquid Handling
- 3.4. Automated Pipetting Systems
- 3.4.1. Working Mechanism of Automated Pipetting Systems
- 3.4.2. Types of Automated Pipetting Systems
- 3.4.2.1. Tip-based Pipetting Systems
- 3.4.2.2. Non-tip based Pipetting Systems
- 3.4.3. Advantages of Automated Pipetting Systems
- 3.5. Automated Microplate Washers
- 3.5.1. Features of an Ideal Automated Microplate Washer
- 3.6. Applications of Automated Liquid Handling Systems
- 3.7. Challenges in Adoption of Automated Liquid Handling Systems
- 3.8. Future Perspectives
4. AUTOMATED PIPETTING SYSTEMS: MARKET LANDSCAPE
- 4.1. Chapter Overview
- 4.2. Automated Pipetting Systems: Overall Market Landscape
- 4.2.1. Analysis by Type of Technology
- 4.2.2. Analysis by Pipetting Technology
- 4.2.3. Analysis by Certification(s)
- 4.2.4. Analysis by Type of Instrument(s) by Assembly
- 4.2.5. Analysis by Pipetting Head Option(s)
- 4.2.6. Analysis by Weight of Automated Pipetting System (in Kg)
- 4.2.7. Analysis by Compatible Labware
- 4.2.8. Analysis by Application Area(s)
- 4.2.9. Analysis by Application(s)
- 4.2.10. Analysis by Additional Feature(s)
- 4.2.11. Analysis by End User(s)
- 4.3. Automated Pipetting System Providers Landscape
- 4.3.1. Analysis by Year of Establishment
- 4.3.2. Analysis by Company Size
- 4.3.3. Analysis by Location of Headquarters (Region-wise)
- 4.3.4. Analysis by Company Size and Location of Headquarters (Region-wise)
- 4.3.5. Analysis by Location of Headquarters (Country-wise)
- 4.3.6. Most Active Players: Analysis by Number of Automated Pipetting Systems Manufactured
5. AUTOMATED PIPETTING SYSTEM PROVIDERS: COMPETITIVENESS ANALYSIS
- 5.1. Chapter Overview
- 5.2. Assumptions and Key Parameters
- 5.3. Methodology
- 5.4. Company Competitiveness Analysis: Automated Pipetting System Providers
- 5.4.1. Companies based in North America (Peer Group I)
- 5.4.2. Companies based in Europe (Peer Group II)
- 5.4.3. Companies based in Asia-Pacific and Rest of the World (Peer Group III)
6. AUTOMATED PIPETTING SYSTEM PROVIDERS: COMPANY PROFILES
- 6.1. Chapter Overview
- 6.2. Beckman Coulter Life Sciences
- 6.2.1. Company Overview
- 6.2.2. Financial Information
- 6.2.3. Product Portfolio
- 6.2.4. Recent Developments and Future Outlook
- 6.3. Eppendorf
- 6.3.1. Company Overview
- 6.3.2. Financial Information
- 6.3.3. Product Portfolio
- 6.3.4. Recent Developments and Future Outlook
- 6.4. Hamilton Robotics
- 6.4.1. Company Overview
- 6.4.2. Product Portfolio
- 6.4.3. Recent Developments and Future Outlook
- 6.5. MyGenostics
- 6.5.1. Company Overview
- 6.5.2. Product Portfolio
- 6.5.3. Recent Developments and Future Outlook
7. AUTOMATED MICROPLATE WASHERS: MARKET LANDSCAPE
- 7.1. Chapter Overview
- 7.2. Automated Microplate Washers: Overall Market Landscape
- 7.2.1. Analysis by Type of Instrument(s) by Assembly
- 7.2.2. Analysis by Compatible Microplate(s)
- 7.2.3. Analysis by Weight of Automated Microplate Washer (in Kg)
- 7.2.4. Analysis by Compatible Software
- 7.2.5. Analysis by Compatible Labware
- 7.2.6. Analysis by Application Area(s)
- 7.2.7. Analysis by Application(s)
- 7.2.8. Analysis by End User(s)
- 7.3. Automated Microplate Washer Providers Landscape
- 7.3.1. Analysis by Year of Establishment
- 7.3.2. Analysis by Company Size
- 7.3.3. Analysis by Location of Headquarters (Region-wise)
- 7.3.4. Analysis by Company Size and Location of Headquarters (Region-wise)
- 7.3.5. Analysis by Location of Headquarters (Country-wise)
- 7.3.6. Most Active Players: Analysis by Number of Automated Microplate Washers Manufactured
8. AUTOMATED MICROPLATE WASHER PROVIDERS: COMPETITIVENESS ANALYSIS
- 8.1. Chapter Overview
- 8.2. Assumptions and Key Parameters
- 8.3. Methodology
- 8.4. Company Competitiveness Analysis: Automated Microplate Washer Providers
- 8.4.1. Companies based in North America (Peer Group I)
- 8.4.2. Companies based in Europe (Peer Group II)
- 8.4.3. Companies based in Asia-Pacific and Rest of the World (Peer Group III)
9. AUTOMATED MICROPLATE WASHER PROVIDERS: COMPANY PROFILES
- 9.1. Chapter Overview
- 9.2. Agilent Technologies
- 9.2.1. Company Overview
- 9.2.2. Financial Information
- 9.2.3. Product Portfolio
- 9.2.4. Recent Developments and Future Outlook
- 9.3. Tecan
- 9.3.1. Company Overview
- 9.3.2. Financial Information
- 9.3.3. Product Portfolio
- 9.3.4. Recent Developments and Future Outlook
- 9.4. Thermo Fisher Scientific
- 9.4.1. Company Overview
- 9.4.2. Financial Information
- 9.4.3. Product Portfolio
- 9.4.4. Recent Developments and Future Outlook
10. PARTNERSHIPS AND COLLABORATIONS
- 10.1. Chapter Overview
- 10.2. Partnership Models
- 10.3. Automated Liquid Handling Systems: Partnerships and Collaborations
- 10.3.1. Analysis by Year of Partnership
- 10.3.2. Analysis by Type of Partnership
- 10.3.3. Analysis by Year and Type of Partnership
- 10.3.4. Analysis by Type of Automated Liquid Handling System(s)
- 10.3.5. Analysis by Product and Type of Partnership
- 10.3.6. Most Popular Products: Distribution by Number of Partnerships
- 10.3.7. Most Active Players: Analysis by Type of Partnership
- 10.3.8. Analysis by Geography
- 10.3.8.1. Local and International Agreements
- 10.3.8.2. Intracontinental and Intercontinental Agreements
11. PATENT ANALYSIS
- 11.1. Chapter Overview
- 11.2. Scope and Methodology
- 11.3. Automated Liquid Handling Systems: Patent Analysis
- 11.3.1. Analysis by Patent Publication Year
- 11.3.2. Analysis by Annual Number of Granted Patents and Patent Applications
- 11.3.3. Analysis by Geography
- 11.3.4. Analysis by CPC Sections
- 11.3.5. Word Cloud Analysis: Emerging Focus Areas
- 11.3.6. Analysis by Type of Organization
- 11.3.7. Leading Industry Players: Analysis by Number of Patents
- 11.3.8. Leading Non-Industry Players: Analysis by Number of Patents
- 11.3.9. Leading Individual Assignees: Analysis by Number of Patents
- 11.4. Automated Liquid Handling Systems: Patent Benchmarking Analysis
- 11.4.1. Analysis by Patent Characteristics
- 11.5. Automated Liquid Handling Systems: Patent Valuation Analysis
- 11.6. Leading Patents: Analysis by Number of Citations
12. MARKET SIZING AND OPPORTUNITY ANALYSIS
- 12.1. Chapter Overview
- 12.2. Methodology and Key Assumptions
- 12.3. Global Automated Liquid Handling Systems Market, Till 2035
- 12.3.1. Automated Liquid Handling Systems Market: Distribution by Type of Automated Liquid Handling System
- 12.3.1.1. Automated Pipetting Systems Market: Till 2035
- 12.3.1.1.1. Automated Pipetting Systems Market: Distribution by Pipetting Technology
- 12.3.1.1.1.1. Automated Pipetting Systems Market for Contact Technology, Till 2035
- 12.3.1.1.1.2. Automated Pipetting Systems Market for Air Displacement Technology, Till 2035
- 12.3.1.1.1.3. Automated Pipetting Systems Market for Piston / Positive Displacement Technology, Till 2035
- 12.3.1.1.1.4. Automated Pipetting Systems Market for Acoustic Technology, Till 2035
- 12.3.1.1.1.5. Automated Pipetting Systems Market for Free-jet Technology, Till 2035
- 12.3.1.1.2. Automated Pipetting Systems Market: Distribution by Modality
- 12.3.1.1.2.1. Automated Pipetting Systems Market for Fixed Tips, Till 2035
- 12.3.1.1.2.2. Automated Pipetting Systems Market for Disposable Tips, Till 2035
- 12.3.1.1.3. Automated Pipetting Systems Market: Distribution by Type of Instrument
- 12.3.1.1.3.1. Automated Pipetting Systems Market for Standalone, Till 2035
- 12.3.1.1.3.2. Automated Pipetting Systems Market for Individual Benchtop Workstation, Till 2035
- 12.3.1.1.3.1. Automated Pipetting Systems Market for Multi Instrument System, Till 2035
- 12.3.1.1.3.2. Automated Pipetting Systems Market for Others, Till 2035
- 12.3.1.1.4. Automated Pipetting Systems Market: Distribution by Application
- 12.3.1.1.4.1. Automated Pipetting Systems Market for Serial Dilution, Till 2035
- 12.3.1.1.4.2. Automated Pipetting Systems Market for Plate Replication, Till 2035
- 12.3.1.1.4.3. Automated Pipetting Systems Market for PCR / qPCR Setup, Till 2035
- 12.3.1.1.4.4. Automated Pipetting Systems Market for Plate Reformatting, Till 2035
- 12.3.1.1.4.5. Automated Pipetting Systems Market for High-throughput Screening, Till 2035
- 12.3.1.1.4.6. Automated Pipetting Systems Market for Whole Genome Amplification, Till 2035
- 12.3.1.1.4.7. Automated Pipetting Systems Market for Cell Culture, Till 2035
- 12.3.1.1.4.8. Automated Pipetting Systems Market for Other Applications, Till 2035
- 12.3.1.1.5. Automated Pipetting Systems Market: Distribution by End User
- 12.3.1.1.5.1. Automated Pipetting Systems Market for Biotechnology and Pharmaceutical Companies, Till 2035
- 12.3.1.1.5.2. Automated Pipetting Systems Market for Academic and Government Research Institutes, Till 2035
- 12.3.1.1.5.3. Automated Pipetting Systems Market for Hospitals and Diagnostic Centers, Till 2035
- 12.3.1.1.5.4. Automated Pipetting Systems Market for Other End Users, Till 2035
- 12.3.1.1.6. Automated Pipetting Systems Market: Distribution by Key Geographical Regions
- 12.3.1.1.6.1 Automated Pipetting Systems Market in North America, Till 2035
- 12.3.1.1.6.2. Automated Pipetting Systems Market in Europe, Till 2035
- 12.3.1.1.6.3. Automated Pipetting Systems Market in Asia-Pacific, Till 2035
- 12.3.1.1.6.4. Automated Pipetting Systems Market in Middle East and North Africa, Till 2035
- 12.3.1.1.6.5. Automated Pipetting Systems Market in Latin America, Till 2035
- 12.3.1.1.1. Automated Pipetting Systems Market: Distribution by Pipetting Technology
- 12.3.1.2. Automated Microplate Washers Market: Till 2035
- 12.3.1.2.1. Automated Microplate Washers Market: Distribution by Washing Technology
- 12.3.1.2.1.1. Automated Microplate Washers Market for Ultrasonic Technology, Till 2035
- 12.3.1.2.1.2. Automated Microplate Washers Market for Acoustic Technology, Till 2035
- 12.3.1.2.1.3. Automated Microplate Washers Market for Centrifugal Technology, Till 2035
- 12.3.1.2.2. Automated Microplate Washers Market: Distribution by Application
- 12.3.1.2.2.1. Automated Microplate Washers Market for ELISA, Till 2035
- 12.3.1.2.2.2. Automated Microplate Washers Market for Cell-based Assays, Till 2035
- 12.3.1.2.2.3. Automated Microplate Washers Market for Bead Washing, Till 2035
- 12.3.1.2.2.4. Automated Microplate Washers Market for Other Applications, Till 2035
- 12.3.1.2.3. Automated Microplate Washers Market: Distribution by End User
- 12.3.1.2.3.1. Automated Microplate Washers Market for Biotechnology and Pharmaceutical Companies, Till 2035
- 12.3.1.2.3.2. Automated Microplate Washers Market for Academic and Government Research Institutes, Till 2035
- 12.3.1.2.3.3. Automated Microplate Washers Market for Hospitals and Diagnostic Centers, Till 2035
- 12.3.1.2.3.4. Automated Microplate Washers Market for Other End Users, Till 2035
- 12.3.1.2.4. Automated Microplate Washers Market: Distribution by Key Geographical Regions
- 12.3.1.2.4.1. Automated Microplate Washers Market in North America, Till 2035
- 12.3.1.2.4.2. Automated Microplate Washers Market in Europe, Till 2035
- 12.3.1.2.4.3. Automated Microplate Washers Market in Asia-Pacific, Till 2035
- 12.3.1.2.4.4. Automated Microplate Washers Market in Middle East and North Africa, Till 2035
- 12.3.1.2.4.5. Automated Microplate Washers Market in Latin America, Till 2035
- 12.3.1.2.1. Automated Microplate Washers Market: Distribution by Washing Technology
- 12.3.1.1. Automated Pipetting Systems Market: Till 2035
- 12.3.1. Automated Liquid Handling Systems Market: Distribution by Type of Automated Liquid Handling System
13. SWOT ANALYSIS
- 13.1. Chapter Overview
- 13.2. Automated Liquid Handling Systems: SWOT Analysis
- 13.3. Comparison of SWOT Factors
- 13.3.1. Weaknesses
- 13.3.2. Opportunities
- 13.3.3. Threats
- 13.4. Concluding Remarks
14. CONCLUDING REMARKS
15. APPENDIX I: TABULATED DATA
16. APPENDIX II: LIST OF COMPANIES AND ORGANIZATIONS
List of Tables
- Table 3.1 Manual, Semi-automated and Automated Pipetting Systems
- Table 4.1 Automated Pipetting Systems: Information on Type of Technology, Pipetting Technology, Certification(s) and Type of Instrument(s) by Assembly
- Table 4.2 Automated Pipetting Systems: Information on Pipetting Head Option(s), Weight of Automated Pipetting System (in Kg), Compatible Labware and Application Area(s)
- Table 4.3 Automated Pipetting Systems: Information on Application(s), Additional Feature(s) and End User(s)
- Table 4.4 Automated Pipetting System Providers: Information on Year of Establishment, Employee Count, Company Size, Location and Region of Headquarters
- Table 6.1 Automated Pipetting System Manufacturers: List of Companies Profiled
- Table 6.2 Beckman Coulter Life Sciences: Company Snapshot
- Table 6.3 Beckman Coulter Life Sciences: Echo 525
- Table 6.4 Beckman Coulter Life Sciences: Echo 550
- Table 6.5 Beckman Coulter Life Sciences: Echo 650
- Table 6.6 Beckman Coulter Life Sciences: Echo 655
- Table 6.7 Beckman Coulter Life Sciences: Biomek 3000
- Table 6.8 Beckman Coulter Life Sciences: Biomek i5
- Table 6.9 Beckman Coulter Life Sciences: Biomek i7
- Table 6.10 Beckman Coulter Life Sciences: Biomek NGeniuS
- Table 6.11 Beckman Coulter Life Sciences: Sagian Multipette Automated Liquid Handler
- Table 6.12 Beckman Coulter Life Sciences: Biomek 4000
- Table 6.13 Beckman Coulter Life Sciences: Recent Developments and Future Outlook
- Table 6.14 Eppendorf: Company Snapshot
- Table 6.15 Eppendorf: epMotion 5075v
- Table 6.16 Eppendorf: epMotion 5075t
- Table 6.17 Eppendorf: epMotion 5075l
- Table 6.18 Eppendorf: epMotion 5075m
- Table 6.19 Eppendorf: epMotion 5075vt
- Table 6.20 Eppendorf: epMotion 5075MC
- Table 6.21 Eppendorf: epMotion 5075TMX
- Table 6.22 Eppendorf: epMotion 5075VAC
- Table 6.23 Eppendorf: epMotion 5075LH
- Table 6.24 Eppendorf: epMotion 5073t NGS solution
- Table 6.25 Eppendorf: epMotion 96/96xl
- Table 6.26 Eppendorf: epMotion 5070
- Table 6.27 Eppendorf: Recent Developments and Future Outlook
- Table 6.28 Hamilton Robotics: Company Snapshot
- Table 6.29 Hamilton Robotics: Microlab STAR
- Table 6.30 Hamilton Robotics: Microlab VANTAGE
- Table 6.31 Hamilton Robotics: NIMBUS384
- Table 6.32 Hamilton Robotics: NIMBUS4
- Table 6.33 Hamilton Robotics: NIMBUS96
- Table 6.34 Hamilton Robotics: Recent Developments and Future Outlook
- Table 6.35 MyGenostics: Company Snapshot
- Table 6.36 MyGenostics: MGS-96
- Table 6.37 MyGenostics: MGN-H200/H1000
- Table 6.38 MyGenostics: MGN-SIRO-4000
- Table 6.39 MyGenostics: SIRO-3000
- Table 7.1 Automated Microplate Washers: Information on Type of Instrument(s) by Assembly and Compatible Microplate(s)
- Table 7.2 Automated Microplate Washers: Information on Weight of Automated Microplate Washer (in Kg), Compatible Software and Compatible Labware
- Table 7.3 Automated Microplate Washers: Information on Application Area(s), Application(s) and End User(s)
- Table 7.4 Automated Microplate Washer Providers: Information on Year of Establishment, Employee Count, Company Size, Location and Region of Headquarters
- Table 9.1 Automated Microplate Washer Manufacturers: List of Companies Profiled
- Table 9.2 Agilent Technologies: Company Snapshot
- Table 9.3 Agilent Technologies: BioTek ELX405s
- Table 9.4 Agilent Technologies: BioTek ELx405 Select
- Table 9.5 Agilent Technologies: ELx405 HT
- Table 9.6 Agilent Technologies: ELx405 Magna
- Table 9.7 Agilent Technologies: Biotek 405TS
- Table 9.8 Agilent Technologies: BioTek 50 TS
- Table 9.9 Agilent Technologies: EL406 Microplate Washer Dispenser
- Table 9.10 Agilent Technologies: 405 LS
- Table 9.11 Agilent Technologies: Recent Developments and Future Outlook
- Table 9.12 Tecan: Company Snapshot
- Table 9.13 Tecan: HydroFlex
- Table 9.14 Tecan: 96 PW
- Table 9.15 Tecan: HydroFlex Plus
- Table 9.16 Tecan: HydroSpeed
- Table 9.17 Tecan: Recent Developments and Future Outlook
- Table 9.18 Thermo Fisher Scientific: Company Snapshot
- Table 9.19 Thermo Fisher Scientific: Wellwash Versa
- Table 9.20 Thermo Fisher Scientific: Wellwash
- Table 9.21 Thermo Fisher Scientific: accuWash
- Table 9.22 Thermo Fisher Scientific: accuWash Versa
- Table 9.23 Thermo Fisher Scientific: Recent Developments and Future Outlook
- Table 10.1 Automated liquid Handling Systems: List of Partnerships and Collaborations
- Table 11.1 Patent Analysis: Top CPC Sections
- Table 11.2 Patent Analysis: Top Five CPC Symbols
- Table 11.3 Patent Analysis: Top Seven CPC Codes
- Table 11.4 Patent Analysis: Summary of Benchmarking Analysis
- Table 11.5 Patent Analysis: Categorization based on Weighted Valuation Scores
- Table 11.6 Patent Portfolio: List of Leading Patents (by Highest Relative Valuation)
- Table 11.7 Patent Portfolio: List of Leading Patents (by Number of Citations)
- Table 15.1 Automated Pipetting Systems: Distribution by Type of Technology
- Table 15.2 Automated Pipetting Systems: Distribution by Pipetting Technology
- Table 15.3 Automated Pipetting Systems: Distribution by Certification(s)
- Table 15.4 Automated Pipetting Systems: Distribution by Type of Instrument(s) by Assembly
- Table 15.5 Automated Pipetting Systems: Distribution by Pipetting Head Option(s)
- Table 15.6 Automated Pipetting Systems: Distribution by Weight of Automated Pipetting Systems (in Kg)
- Table 15.7 Automated Pipetting Systems: Distribution by Compatible Labware
- Table 15.8 Automated Pipetting Systems: Distribution by Application Area(s)
- Table 15.9 Automated Pipetting Systems: Distribution by Application(s)
- Table 15.10 Automated Pipetting Systems: Distribution by Additional Feature(s)
- Table 15.11 Automated Pipetting Systems: Distribution by End User(s)
- Table 15.12 Automated Pipetting System Providers: Distribution by Year of Establishment
- Table 15.13 Automated Pipetting System Providers: Distribution by Company Size
- Table 15.14 Automated Pipetting System Providers: Distribution by Location of Headquarters (Region-wise)
- Table 15.15 Automated Pipetting System Providers: Distribution by Company Size and Location of Headquarters (Region-wise)
- Table 15.16 Automated Pipetting System Providers: Distribution by Location of Headquarters (Country-wise)
- Table 15.17 Most Active Players: Distribution by Number of Automated Pipetting Systems Manufactured
- Table 15.18 Beckman Coulter Life Sciences: Annual Revenues, Since 2018 (USD Billion)
- Table 15.19 Eppendorf: Annual Revenues, Since 2018 (USD Billion)
- Table 15.20 Automated Microplate Washers: Distribution by Type of Instrument(s) by Assembly
- Table 15.21 Automated Microplate Washers: Distribution by Compatible Microplate(s)
- Table 15.22 Automated Microplate Washers: Distribution by Weight of Automated Microplate Washer (in Kg)
- Table 15.23 Automated Microplate Washers: Distribution by Compatible Labware
- Table 15.24 Automated Microplate Washers: Distribution by Application Area(s)
- Table 15.25 Automated Microplate Washers: Distribution by Application(s)
- Table 15.26 Automated Microplate Washers: Distribution by End User(s)
- Table 15.27 Automated Microplate Washer Providers: Distribution by Year of Establishment
- Table 15.28 Automated Microplate Washer Providers: Distribution by Company Size
- Table 15.29 Automated Microplate Washer Providers: Distribution by Location of Headquarters (Region-wise)
- Table 15.30 Automated Microplate Washer Providers: Distribution by Company Size and Location of Headquarters (Region-wise)
- Table 15.31 Automated Microplate Washer Providers: Distribution by Location of Headquarters (Country-wise)
- Table 15.32 Most Active Players: Distribution by Number of Compatible Software
- Table 15.33 Most Active Players: Distribution by Number of Automated Microplate Washers Manufactured
- Table 15.34 Agilent Technologies: Annual Revenues, Since 2018 (USD Billion)
- Table 15.35 Tecan: Annual Revenues, Since 2018 (CHF Million)
- Table 15.36 Thermo Fisher Scientific: Annual Revenues, Since 2018 (USD Billion)
- Table 15.37 Partnerships and Collaborations: Distribution by Year of Partnership, Since 2018
- Table 15.38 Partnerships and Collaborations: Distribution by Type of Partnership
- Table 15.39 Partnerships and Collaborations: Distribution by Year and Type of Partnership, Since 2018
- Table 15.40 Partnerships and Collaborations: Distribution by Type of Automated Liquid Handling System(s)
- Table 15.41 Partnerships and Collaborations: Distribution by Product and Type of Partnership
- Table 15.42 Most Popular Products: Distribution by Number of Partnerships
- Table 15.43 Most Active Players: Distribution by Type of Partnership
- Table 15.44 Partnerships and Collaborations: Local and International Agreements
- Table 15.45 Partnerships and Collaborations: Intracontinental and Intercontinental Agreements
- Table 15.46 Patent Analysis: Distribution by Type of Patent
- Table 15.47 Patent Analysis: Cumulative Distribution by Patent Publication Year, Since 2017
- Table 15.48 Patent Analysis: Year-wise Distribution by Granted Patents and Patent Applications, Since 2017
- Table 15.49 Patent Analysis: Distribution by Geography
- Table 15.50 Patent Analysis: Distribution by CPC Sections
- Table 15.51 Patent Analysis: Cumulative Year-wise Distribution by Type of Organization, Since 2017
- Table 15.52 Leading Industry Players: Distribution by Number of Patents
- Table 15.53 Leading Non-Industry Players: Distribution by Number of Patents
- Table 15.54 Leading Individual Assignees: Distribution by Number of Patents
- Table 15.55 Patent Analysis: Distribution by Patent Age
- Table 15.56 Automated Liquid Handling Systems: Patent Valuation Analysis
- Table 15.57 Global Automated Liquid Handling Systems Market, Till 2035
- Table 15.58 Automated Liquid Handling Systems Market: Distribution by Type of Automated Liquid Handling System
- Table 15.59 Automated Pipetting Systems Market: Till 2035
- Table 15.60 Automated Pipetting Systems Market: Distribution by Pipetting Technology
- Table 15.61 Automated Pipetting Systems Market for Contact Technology: Conservative, Base and Optimistic Scenarios, Till 2035
- Table 15.62 Automated Pipetting Systems Market for Air Displacement Technology: Conservative, Base and Optimistic Scenarios, Till 2035
- Table 15.63 Automated Pipetting Systems Market for Piston / Positive Displacement Technology: Conservative, Base and Optimistic Scenarios, Till 2035
- Table 15.64 Automated Pipetting Systems Market for Acoustic Technology: Conservative, Base and Optimistic Scenarios: Till 2035
- Table 15.65 Automated Pipetting Systems Market for Free-jet Technology: Conservative, Base and Optimistic Scenarios: Till 2035
- Table 15.66 Automated Pipetting Systems Market: Distribution by Modality
- Table 15.67 Automated Pipetting Systems Market for Fixed Tips: Conservative, Base and Optimistic Scenarios, Till 2035
- Table 15.68 Automated Pipetting Systems Market for Disposable Tips: Conservative, Base and Optimistic Scenarios, Till 2035
- Table 15.69 Automated Pipetting Systems Market: Distribution by Type of Instrument
- Table 15.70 Automated Pipetting Systems Market for Standalone: Conservative, Base and Optimistic Scenarios, Till 2035
- Table 15.71 Automated Pipetting Systems Market for Individual Benchtop Workstation: Conservative, Base and Optimistic Scenarios, Till 2035
- Table 15.72 Automated Pipetting Systems Market for Multi Instrument System: Conservative, Base and Optimistic Scenarios, Till 2035
- Table 15.73 Automated Pipetting Systems Market for Others: Conservative, Base and Optimistic Scenarios, Till 2035
- Table 15.74 Automated Pipetting Systems Market: Distribution by Application
- Table 15.75 Automated Pipetting Systems Market for Serial Dilution: Conservative, Base and Optimistic Scenarios, Till 2035
- Table 15.76 Automated Pipetting Systems Market for Plate Replication: Conservative, Base and Optimistic Scenarios, Till 2035
- Table 15.77 Automated Pipetting Systems Market for PCR / qPCR Setup: Conservative, Base and Optimistic Scenarios, Till 2035
- Table 15.78 Automated Pipetting Systems Market for Plate Reformatting: Conservative, Base and Optimistic Scenarios, Till 2035
- Table 15.79 Automated Pipetting Systems Market for High-throughput Screening: Conservative, Base and Optimistic Scenarios, Till 2035
- Table 15.80 Automated Pipetting Systems Market for Whole Genome Amplification: Conservative, Base and Optimistic Scenarios, Till 2035
- Table 15.81 Automated Pipetting Systems Market for Cell Culture: Conservative, Base and Optimistic Scenarios, Till 2035
- Table 15.82 Automated Pipetting Systems Market for Other Applications: Conservative, Base and Optimistic Scenarios, Till 2035
- Table 15.83 Automated Pipetting Systems Market: Distribution by End User
- Table 15.84 Automated Pipetting Systems Market for Biotechnology and Pharmaceutical Companies: Conservative, Base and Optimistic Scenarios, Till 2035
- Table 15.85 Automated Pipetting Systems Market for Academic and Government Research Institutes: Conservative, Base and Optimistic Scenarios, Till 2035
- Table 15.86 Automated Pipetting Systems Market for Hospitals and Diagnostic Centers: Conservative, Base and Optimistic Scenarios, Till 2035
- Table 15.87 Automated Pipetting Systems Market for Other End Users: Conservative, Base and Optimistic Scenarios, Till 2035
- Table 15.88 Automated Pipetting Systems Market: Distribution by Key Geographical Regions
- Table 15.89 Automated Pipetting Systems Market in North America: Conservative, Base and Optimistic Scenarios, Till 2035
- Table 15.90 Automated Pipetting Systems Market in Europe: Conservative, Base and Optimistic Scenarios, Till 2035
- Table 15.91 Automated Pipetting Systems Market in Asia-Pacific: Conservative, Base and Optimistic Scenarios, Till 2035
- Table 15.92 Automated Pipetting Systems Market in Middle East and North Africa: Conservative, Base and Optimistic Scenarios, Till 2035
- Table 15.93 Automated Pipetting Systems Market in Latin America: Conservative, Base and Optimistic Scenarios, Till 2035
- Table 15.94 Automated Microplate Washers Market: Till 2035
- Table 15.95 Automated Microplate Washers Market: Distribution by Washing Technology
- Table 15.96 Automated Microplate Washers Market for Ultrasonic Technology: Conservative, Base and Optimistic Scenarios, Till 2035
- Table 15.97 Automated Microplate Washers Market for Acoustic Technology: Conservative, Base and Optimistic Scenarios, Till 2035
- Table 15.98 Automated Microplate Washers Market for Centrifugal Technology: Conservative, Base and Optimistic Scenarios, Till 2035
- Table 15.99 Automated Microplate Washers Market: Distribution by Application
- Table 15.100 Automated Microplate Washers Market for ELISA: Conservative, Base and Optimistic Scenarios, Till 2035
- Table 15.101 Automated Microplate Washers Market for Cell-based Assays: Conservative, Base and Optimistic Scenarios, Till 2035
- Table 15.102 Automated Microplate Washers Market for Bead Washing: Conservative, Base and Optimistic Scenarios, Till 2035
- Table 15.103 Automated Microplate Washers Market for Other Applications: Conservative, Base and Optimistic Scenarios, Till 2035
- Table 15.104 Automated Microplate Washers Market: Distribution by End User
- Table 15.105 Automated Microplate Washers Market for Biotechnology and Pharmaceutical Companies: Conservative, Base and Optimistic Scenarios, Till 2035
- Table 15.106 Automated Microplate Washers Market for Academic and Government Research Institutes: Conservative, Base and Optimistic Scenarios, Till 2035
- Table 15.107 Automated Microplate Washers Market for Hospitals and Diagnostic Centers: Conservative, Base and Optimistic Scenarios, Till 2035
- Table 15.108 Automated Microplate Washers Market for Other End Users: Conservative, Base and Optimistic Scenarios, Till 2035
- Table 15.109 Automated Microplate Washers Market: Distribution by Key Geographical Regions
- Table 15.110 Automated Microplate Washers Market in North America: Conservative, Base and Optimistic Scenarios, Till 2035
- Table 15.111 Automated Microplate Washers Market in Europe: Conservative, Base and Optimistic Scenarios, Till 2035
- Table 15.112 Automated Microplate Washers Market in Asia-Pacific: Conservative, Base and Optimistic Scenarios, Till 2035
- Table 15.113 Automated Microplate Washers Market in Middle East and North Africa: Conservative, Base and Optimistic Scenarios, Till 2035
- Table 15.114 Automated Microplate Washers Market in Latin America: Conservative, Base and Optimistic Scenarios, Till 2035
List of Figures
- Figure 2.1. Executive Summary: Current Market Landscape of Automated Pipetting Systems
- Figure 2.2. Executive Summary: Current Market Landscape of Automated Microplate Washers
- Figure 2.3. Executive Summary: Partnerships and Collaborations
- Figure 2.4. Executive Summary: Patent Analysis
- Figure 2.5. Executive Summary: Market Sizing and Opportunity Analysis
- Figure 3.1. Manual versus Automated Liquid Handling
- Figure 3.2. Working Mechanism of Automated Pipetting Systems
- Figure 3.3. Advantages of Automated Pipetting Systems
- Figure 3.4. Features of an Ideal Automated Microplate Washer
- Figure 3.5. Applications of Automated Liquid Handling Systems
- Figure 4.1. Automated Pipetting Systems: Distribution by Type of Technology
- Figure 4.2. Automated Pipetting Systems: Distribution by Pipetting Technology
- Figure 4.3. Automated Pipetting Systems: Distribution by Certification(s)
- Figure 4.4. Automated Pipetting Systems: Distribution by Type of Instrument(s) by Assembly
- Figure 4.5. Automated Pipetting Systems: Distribution by Pipetting Head Option(s)
- Figure 4.6. Automated Pipetting Systems: Distribution of Weight of Automated Pipetting Systems (in Kg)
- Figure 4.7. Automated Pipetting Systems: Distribution by Compatible Labware
- Figure 4.8. Automated Pipetting Systems: Distribution by Application Area(s)
- Figure 4.9. Automated Pipetting Systems: Distribution by Application(s)
- Figure 4.10. Automated Pipetting Systems: Distribution by Additional Feature (s)
- Figure 4.11. Automated Pipetting Systems: Distribution by End User(s)
- Figure 4.12. Automated Pipetting System Providers: Distribution by Year of Establishment
- Figure 4.13. Automated Pipetting System Providers: Distribution by Company Size
- Figure 4.14. Automated Pipetting System Providers: Distribution by Location of Headquarters (Region-wise)
- Figure 4.15. Automated Pipetting System Providers: Distribution by Company Size and Location of Headquarters (Region-wise)
- Figure 4.16. Automated Pipetting System Providers: Distribution by Location of Headquarters (Country-wise)
- Figure 4.17. Most Active Players: Distribution by Number of Automated Pipetting Systems Manufactured
- Figure 5.1. Company Competitiveness Analysis: Automated Pipetting System Providers based in North America (Peer Group I)
- Figure 5.2. Company Competitiveness Analysis: Automated Pipetting System Providers based in Europe (Peer Group II)
- Figure 5.3. Company Competitiveness Analysis: Automated Pipetting System Providers based in Asia-Pacific and Rest of the World (Peer Group III)
- Figure 6.1. Beckman Coulter Life Sciences: Annual Revenues, Since 2018 (USD Billion)
- Figure 6.2. Eppendorf: Annual Revenues, Since 2018 (USD Billion)
- Figure 7.1. Automated Microplate Washers: Distribution by Type of Instrument(s) by Assembly
- Figure 7.2. Automated Microplate Washers: Distribution by Compatible Microplate(s)
- Figure 7.3. Automated Microplate Washers: Distribution by Weight of Automated Microplate Washer (in Kg)
- Figure 7.4. Automated Microplate Washers: Distribution by Compatible Labware
- Figure 7.5. Automated Microplate Washers: Distribution by Application Area(s)
- Figure 7.6. Automated Microplate Washers: Distribution by Application(s)
- Figure 7.7. Automated Microplate Washers: Distribution by End User(s)
- Figure 7.8. Automated Microplate Washer Providers: Distribution by Year of Establishment
- Figure 7.9. Automated Microplate Washer Providers: Distribution by Company Size
- Figure 7.10. Automated Microplate Washer Providers: Distribution by Location of Headquarters (Region-wise)
- Figure 7.11. Automated Microplate Washer Providers: Distribution by Company Size and Location of Headquarters (Region-wise)
- Figure 7.12. Automated Microplate Washer Providers: Distribution by Location Headquarters (Country-wise)
- Figure 7.13. Most Active Players: Distribution by Number of Compatible Software
- Figure 7.14. Most Active Players: Distribution by Number of Automated Microplate Washers Manufactured
- Figure 8.1. Company Competitiveness Analysis: Automated Microplate Washer Providers based in North America (Peer Group I)
- Figure 8.2. Company Competitiveness Analysis: Automated Microplate Washer Providers based in Europe (Peer Group II)
- Figure 8.3. Company Competitiveness Analysis: Automated Microplate Washer Providers based in Asia-Pacific and Rest of the World (Peer Group III)
- Figure 9.1. Agilent Technologies: Annual Revenues, Since 2018 (USD Billion)
- Figure 9.2. Tecan: Annual Revenues, Since 2018 (CHF Million)
- Figure 9.3. Thermo Fisher Scientific: Annual Revenues, Since 2018 (USD Billion)
- Figure 10.1. Partnerships and Collaborations: Distribution by Year of Partnership, Since 2018
- Figure 10.2. Partnerships and Collaborations: Distribution by Type of Partnership
- Figure 10.3. Partnerships and Collaborations: Distribution by Year and Type of Partnership, Since 2018
- Figure 10.4. Partnerships and Collaborations: Distribution by Type of Automated Liquid Handling System(s)
- Figure 10.5. Partnerships and Collaborations: Distribution by Product and Type of Partnership
- Figure 10.6. Most Popular Products: Distribution by Number of Partnerships
- Figure 10.7. Most Active Players: Distribution by Type of Partnership
- Figure 10.8. Partnerships and Collaborations: Local and International Agreements
- Figure 10.9. Partnerships and Collaborations: Intracontinental and Intercontinental Agreements
- Figure 11.1. Patent Analysis: Distribution by Type of Patent
- Figure 11.2. Patent Analysis: Cumulative Distribution by Patent Publication Year, Since 2017
- Figure 11.3. Patent Analysis: Year-wise Distribution of Granted Patents and Patent Applications, Since 2017
- Figure 11.4. Patent Analysis: Distribution by Geography
- Figure 11.5. Patent Analysis: Distribution by CPC Sections
- Figure 11.6. Word Cloud Analysis: Emerging Focus Areas
- Figure 11.7. Patent Analysis: Cumulative Year-wise Distribution by Type of Organization, Since 2017
- Figure 11.8. Leading Industry Players: Distribution by Number of Patents
- Figure 11.9. Leading Non-Industry Players: Distribution by Number of Patents
- Figure 11.10. Leading Individual Assignees: Distribution by Number of Patents
- Figure 11.11. Leading Players: Benchmarking by Patent Characteristics (CPC Codes)
- Figure 11.12. Patent Analysis: Distribution by Patent Age
- Figure 11.13. Automated Liquid Handling Systems: Patent Valuation Analysis
- Figure 12.1. Global Automated Liquid Handling Systems Market, Till 2035
- Figure 12.2. Automated Liquid Handling Systems Market: Distribution by Type of Automated Liquid Handling System
- Figure 12.3. Automated Pipetting Systems Market: Till 2035
- Figure 12.4. Automated Pipetting Systems Market: Distribution by Pipetting Technology
- Figure 12.5. Automated Pipetting Systems Market for Contact Technology, Till 2035
- Figure 12.6. Automated Pipetting Systems Market for Air Displacement Technology, Till 2035
- Figure 12.7. Automated Pipetting Systems Market for Piston / Positive Displacement Technology, Till 2035
- Figure 12.8. Automated Pipetting Systems Market for Acoustic Technology, Till 2035
- Figure 12.9. Automated Pipetting Systems Market for Free-jet Technology, Till 2035
- Figure 12.10. Automated Pipetting Systems Market: Distribution by Modality
- Figure 12.11. Automated Pipetting Systems Market for Fixed Tips, Till 2035
- Figure 12.12. Automated Pipetting Systems Market for Disposable Tips, Till 2035
- Figure 12.13. Automated Pipetting Systems Market: Distribution by Type of Instrument
- Figure 12.14. Automated Pipetting Systems Market for Standalone, Till 2035
- Figure 12.15. Automated Pipetting Systems Market for Individual Benchtop Workstation, Till 2035
- Figure 12.16. Automated Pipetting Systems Market for Multi Instrument System, Till 2035
- Figure 12.17. Automated Pipetting Systems Market for Others, Till 2035
- Figure 12.18. Automated Pipetting Systems Market: Distribution by Application
- Figure 12.19. Automated Pipetting Systems Market for Serial Dilution, Till 2035
- Figure 12.20. Automated Pipetting Systems Market for Plate Replication, Till 2035
- Figure 12.21. Automated Pipetting Systems Market for PCR / qPCR Setup, Till 2035
- Figure 12.22. Automated Pipetting Systems Market for Plate Reformatting, Till 2035
- Figure 12.23. Automated Pipetting Systems Market for High-throughput Screening, Till 2035
- Figure 12.24. Automated Pipetting Systems Market for Whole Genome Amplification, Till 2035
- Figure 12.25. Automated Pipetting Systems Market for Cell Culture, Till 2035
- Figure 12.26. Automated Pipetting Systems Market for Other Applications, Till 2035
- Figure 12.27. Automated Pipetting Systems Market: Distribution by End User
- Figure 12.28. Automated Pipetting Systems Market for Biotechnology and Pharmaceutical Companies, Till 2035
- Figure 12.29. Automated Pipetting Systems Market for Academic and Government Research Institutes, Till 2035
- Figure 12.30. Automated Pipetting Systems Market for Hospitals and Diagnostic Centers, Till 2035
- Figure 12.31. Automated Pipetting Systems Market for Other End Users, Till 2035
- Figure 12.32. Automated Pipetting Systems Market: Distribution by Key Geographical Regions
- Figure 12.33. Automated Pipetting Systems Market in North America, Till 2035
- Figure 12.34. Automated Pipetting Systems Market in Europe, Till 2035
- Figure 12.35. Automated Pipetting Systems Market in Asia-Pacific, Till 2035
- Figure 12.36. Automated Pipetting Systems Market in Middle East and North Africa, Till 2035
- Figure 12.37. Automated Pipetting Systems Market in Latin America, Till 2035
- Figure 12.38. Automated Microplate Washers Market: Till 2035
- Figure 12.39. Automated Microplate Washers Market: Distribution by Washing Technology
- Figure 12.40. Automated Microplate Washers Market for Ultrasonic Technology
- Figure 12.41. Automated Microplate Washers Market for Acoustic Technology
- Figure 12.42. Automated Microplate Washers Market for Centrifugal Technology
- Figure 12.43. Automated Microplate Washers Market: Distribution by Application
- Figure 12.44. Automated Microplate Washers Market for ELISA, Till 2035
- Figure 12.45. Automated Microplate Washers Market for Cell-based Assays, Till 2035
- Figure 12.46. Automated Microplate Washers Market for Bead Washing, Till 2035
- Figure 12.47. Automated Microplate Washers Market for Other Applications, Till 2035
- Figure 12.48. Automated Microplate Washers Market: Distribution by End User
- Figure 12.49. Automated Microplate Washers Market for Biotechnology and Pharmaceutical Companies, Till 2035
- Figure 12.50. Automated Microplate Washers Market for Academic and Government Research Institutes, Till 2035
- Figure 12.51. Automated Microplate Washers Market for Hospitals and Diagnostic Centers, Till 2035
- Figure 12.52. Automated Microplate Washers Market for Other End Users, Till 2035
- Figure 12.53. Automated Microplate Washers Market: Distribution by Key Geographical Regions
- Figure 12.54. Automated Microplate Washers Market in North America, Till 2035
- Figure 12.55. Automated Microplate Washers Market in Europe, Till 2035
- Figure 12.56. Automated Microplate Washers Market in Asia-Pacific, Till 2035
- Figure 12.57. Automated Microplate Washers Market in Middle East and North Africa, Till 2035
- Figure 12.58. Automated Microplate Washers Market in Latin America, Till 2035
- Figure 13.1. Automated Liquid Handling Systems: SWOT Analysis
- Figure 13.2. Comparison of SWOT Factors: Harvey Ball Analysis
- Figure 14.1. Concluding Remarks: Current Market Landscape of Automated Pipetting Systems
- Figure 14.2. Concluding Remarks: Current Market Landscape of Automated Microplate Washers
- Figure 14.3. Concluding Remarks: Partnerships and Collaborations
- Figure 14.4. Concluding Remarks: Patent Analysis
- Figure 14.5. Concluding Remarks: Market Sizing and Opportunity Analysis
 奈升液體操控工作站市場:依產品類型、技術、工作流程類型、應用、最終用戶分類,全球預測(2026-2032年)自動化液體處理工作站市場:按組件、類型、應用和最終用戶分類,全球預測,2026-2032年
 2026年全球自動化液體處理系統市場報告
 自動化液體處理技術市場-全球產業規模、佔有率、趨勢、機會及預測(依產品、應用、最終用戶、地區及競爭格局分類),2021-2031年
 液體處理系統市場規模、佔有率、成長分析(按產品類型、類型、設備類型、最終用途、模式和地區分類)-2026-2033年產業預測
 列印貼標系統市場(2025):在高產能環境下實現精準一致的標籤按產品類型、技術、應用和最終用戶分類的自動化液體處理技術市場—2025-2032年全球預測液體處理系統市場按自動化程度、產品類型、應用、最終用戶和分銷管道分類 - 全球預測 2025-2032液體處理市場 - 全球產業規模、佔有率、趨勢、競爭、機會和預測,按類型、產品、應用、最終用戶、地區和競爭細分,2020-2030 年
 全球液體處理技術市場