


 |
市場調查報告書
商品編碼
1762534
自動化細胞處理系統市場產業趨勢及全球預測 - 依細胞療法處理步驟、依業務規模、依最終用戶、依主要地區Automated Cell Processing System Market: Industry Trends and Global Forecasts - Distribution by Cell Therapy Processing Step, Scale of Operation, End User and Key Geographical Regions |
||||||
自動化細胞處理系統市場:概覽
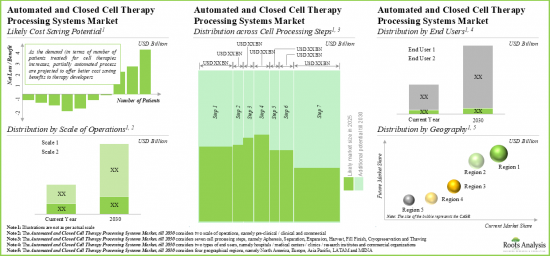
今年全球自動化細胞處理系統市場規模為 2.2億美元。預計預測期內,該市場的年複合成長率將達到 16%。
市場規模與機會分析依下列參數細分:
細胞療法處理步驟
- 單採
- 分離
- 擴張
- 收穫
- 填充/完成
- 冷凍保存
- 解凍
企業規模
- 臨床前/臨床業務
- 商業組織
最終使用者
- 醫院/醫療中心/診所/研究機構/學術機構
- 細胞療法製造商/開發商
主要地區
- 北美
- 歐洲
- 亞太地區
- 拉丁美洲
- 中東和北美非洲
自動化細胞處理系統市場:成長與趨勢
近年來,生物技術產業的許多突破性進展推動了細胞療法候選藥物數量的成長。事實上,目前有超過 2,000 種細胞和基因療法候選藥物接受研究,用於治療各種疾病。此外,FDA 批准的療法結果也表明,細胞療法在治療腫瘤、罕見疾病和慢性病方面具有巨大潛力。因此,這種療法在過去幾年中引起了醫療行業利益相關者的廣泛關注。然而,傳統的細胞療法生產過程勞動密集且耗時,導致生產成本高。此外,這種手動細胞療法生產過程會導致批次間差異。因此,對更精密、更省時的生產解決方案的需求日益迫切。
多年來,人們開發了多種先進且創新的自動化工具和技術。這些自動化封閉式細胞處理系統已證明具有顯著降低先進細胞療法生產成本的潛力。 GMP-In-A Box 等自動化系統具有諸多優勢,例如更高的吞吐量、更少的批次運行間空閒時間以及更少的人工成本。由於自動化的這些優勢,細胞處理系統市場在未來幾年有望實現良好的成長。
自動化細胞處理系統市場:關鍵洞察
本報告深入探討了自動化細胞處理系統市場的現狀,並揭示了該行業的潛在成長機會。報告的主要調查結果包括:
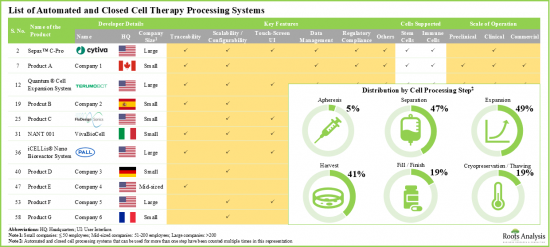
- 目前,已有超過60種創新的自動化和封閉系統被獨立開發,用於實現細胞療法開發、生產和冷凍保存各個階段的自動化。
- 市場格局較為分散,成熟企業和新進業者均在開發具有獨特特徵的新技術,用於處理不同規模的細胞。
- 自2010年以來,許多致力於開發自動化和封閉式細胞處理系統的新創公司應運而生,這一新興領域吸引了許多大型和小型企業的興趣。
- 大多數現有系統符合目前的監管要求。例如BATON、NANT 001、機器人細胞培養系統和Voltaloop。
- 利害關係人對該領域日益成長的興趣也反映在近期的合作活動中。近期的合作大多集中在新技術上,並得到了國內外企業的積極參與。
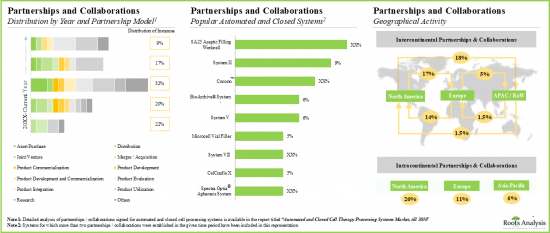
- 該領域的合作夥伴數量正以 24%的年複合成長率成長,其中超過 70%的合作夥伴協議是在2018年之後簽署的。
- 已簽署多項協議,重點利用或整合 SA25 無菌填充工作單元(vanrx 製藥系統),用於細胞治療產品的填充/完成。
- 為了追求競爭優勢,設備開發商現在致力於將先進功能整合到自身產品和合作夥伴產品中。
- 對包括大型製藥公司在內的300 多家參與細胞治療開發的利害關係人進行評估,發現該領域為設備供應商提供了若干策略合作機會。
- 考慮到各個處理步驟中潛在的成本節約,預計未來 10年自動化和封閉式細胞治療系統市場將以每年 16%的速度成長。
參與自動化細胞處理系統市場的公司範例
- AstraZeneca
- Baxter
- Bayer
- Cytiva(Acquired by Danaher Corporation)
- Cellular Therapeutics
- Lonza
- Merck
- Pall(Acquired by Danaher Corporation)
- Terumo BCT
- ThermoGenesis
目錄
第1章 簡介
章節2 執行摘要
第3章 引言
- 背景和背景
- 細胞療法
- 細胞療法製造
- 細胞療法製造面臨的主要挑戰
- 自動化和封閉式細胞處理系統概述
- 主要成長動力和障礙
- 近期與未來趨勢
第4章 競爭格局
- 章節概述
- 自動化和封閉式細胞療法處理系統:市場模式
- 自動化和封閉式細胞療法處理系統:開發商模式
第5章 產品競爭格局
- 章節概述
- 假設/關鍵參數
- 研究方法
- 產品競爭格局
第6章 公司簡介
- 章節概述
- Cytiva
- Pall
- Terumo BCT
- ThermoGenesis
第7章 合作夥伴關係
- 章節概述
- 合作模式
- 自動化和封閉式細胞治療處理系統:近期合作夥伴關係
第8章 自動化和封閉式細胞治療處理系統領域的主要製藥公司措施
- 章節概述
- 主要製藥公司的舉措
- AbbVie 的舉措
- Bristol Myers Squibb 的舉措
- Gilead Sciences 的舉措
- GlaxoSmithKline 的舉措
- Johnson & Johnson舉措
- Novartis舉措
- Roche舉措
- Sanofi舉措
- Takeda製藥舉措
- 主要藥廠措施摘要
第9章 潛在合作夥伴
- 章節概述
- 研究範圍與研究方法
- 自動化和封閉式細胞療法處理系統:細胞療法開發的潛在策略夥伴
- 自動化和封閉式細胞療法處理系統:細胞療法生產的潛在策略夥伴
第10章 案例研究:使用半自動化和全自動系統的成本效益分析
第11章 市場規模評估與機會分析
- 章節概述
- 關鍵假設與研究方法
- 全自動和封閉式細胞療法處理系統市場(至2035年)
第12章 結論
第13章 訪談/調查記錄
第14章 附錄1:表格資料
第15章 附錄2:公司與組織清單
AUTOMATED CELL PROCESSING SYSTEM MARKET: OVERVIEW
As per Roots Analysis, the global automated cell processing system market valued at USD 220 million in the current year is projected to grow at a CAGR of 16% during the forecast period.
The market sizing and opportunity analysis has been segmented across the following parameters:
Cell Therapy Processing Step
- Apheresis
- Separation
- Expansion
- Harvest
- Fill / Finish
- Cryopreservation
- Thawing
Scale of Operation
- Pre-clinical / Clinical Operations
- Commercial Organizations
End User
- Hospitals / Medical Centers / Clinics / Research Institutes / Academic Institutes
- Cell Therapy Manufacturers / Developers
Key Geographical Regions
- North America
- Europe
- Asia-Pacific
- Latin America
- Middle East and North Africa
AUTOMATED CELL PROCESSING SYSTEM MARKET: GROWTH AND TRENDS
Recently there has been a rise in the number of cell therapies candidates, driven by numerous developmental breakthroughs in the biotechnology industry. In fact, more than 2,000 cell and gene therapy candidates are currently being investigated for the treatment of a myriad of disease indications. Further, the results of FDA approved therapies demonstrated the vast potential of cellular therapies in the treatment of oncological disorders, rare diseases, and chronic diseases. Thus, this therapeutic modality has garnered considerable attention from players engaged in the healthcare industry in the past few years. However, the conventional cell therapy manufacturing process is labor-intensive and time-consuming which results in high cost of production. Moreover, this manual process of cell therapy manufacturing leads to batch-to-batch variation. Consequently, there is an emerging and pressing need for more sophisticated and time efficient solutions for production.
Over the years, several advanced and innovative automation tools and technologies have been developed. These automated and closed cell processing systems have been demonstrated to hold the potential for significant reduction in the cost associated with the manufacturing of advanced cell therapies. One such automated system, namely GMP-In-A Box, offers several advantages, including increased throughput, decreased idle time between batch runs and reduced manual labor. Owing to such benefits of automation, the cell processing systems market is poised to witness lucrative growth in the coming future.
AUTOMATED CELL PROCESSING SYSTEM MARKET: KEY INSIGHTS
The report delves into the current state of the automated cell processing system market and identifies potential growth opportunities within industry. Some key findings from the report include:
- Presently, over 60 innovative, automated and closed systems have been developed by different companies in order to automate various stages of cell therapy development, production, and cryopreservation.
- The market landscape is fragmented, featuring both established players and new entrants, engaged in developing novel technologies with distinct features, for processing cells across different scales of operation.
- Since 2010, many startups, focused on developing automated and closed cell processing systems, have been established; this upcoming domain has captured the interest of both big and small players.
- Majority of the available systems are compliant with the current regulatory requirements; examples include BATON, NANT 001, robotic cell culture systems and the volta loop.
- The increasing interest of stakeholders in this field is also reflected in the recent partnership activity; most recent deals are focused on novel technologies and involve the active participation of both international and indigenous players.
- The number of partnerships in this domain have increased at a CAGR of 24%; more than 70% of these partnerships have been signed since 2018.
- Several deals focused on utilization or integration of SA25 aseptic filling work cell (vanrx pharma systems) were signed for fill / finish of cell therapy products.
- In pursuit of a competitive advantage, equipment developers are presently focusing on the integration of advanced features into their respective products and affiliated offerings.
- An evaluation of more than 300+ stakeholders engaged in the development of cell therapies, including big pharma players, reveals several likely strategic partnership opportunities for equipment providers in this field.
- Given their cost saving potential across different processing steps, we expect the automated and closed cell therapy systems market to grow at an annualized rate of 16% over the next decade.
Example Players in the Automated Cell Processing System Market
- AstraZeneca
- Baxter
- Bayer
- Cytiva (Acquired by Danaher Corporation)
- Cellular Therapeutics
- Lonza
- Merck
- Pall (Acquired by Danaher Corporation)
- Terumo BCT
- ThermoGenesis
AUTOMATED CELL PROCESSING SYSTEM MARKET: RESEARCH COVERAGE
- Market Sizing and Opportunity Analysis: The report features an in-depth analysis of the global automated cell processing system market, focusing on key market segments, including [A] cell therapy processing step, [B] scale of operation, [C] end user and [D] key geographical regions.
- Market Landscape: A comprehensive evaluation of the automated and closed systems, based on several relevant parameters, such as [A] cell therapy processing step, [B] their key features, [C] product specifications, [D] type of cells supported, [E] type of cell culture, [F] scale of operation, [G] application, [H] end users, [I] key support services offered and [J] regulatory certification / accreditations obtained.
- Product Competitiveness Analysis: A comprehensive competitive analysis of automated and closed systems, examining factors, such as [A] supplier power and [B] portfolio-related parameters.
- Company Profiles: In-depth profiles of key players that are engaged in offering automated and closed cell therapy processing systems, focusing on [A] overview of the company, [B] financial information (if available), [C] detailed description of the system(s) they offer and [D] recent developments and an informed future outlook.
- Partnerships and Collaborations: An insightful analysis of the deals inked by stakeholders in the automated cell processing system market, based on several parameters, such as [A] year of partnership, [B] type of partnership, [C] type of therapy, [D] type of cell processing step, [E] key automated and closed cell processing systems, [F] partner's focus area, [G] most active players (in terms of number of partnerships signed), and [H] geographical location of collaborators.
- Big Pharma Initiatives: A comprehensive evaluation of recent initiatives undertaken by big pharma players engaged in the automated cell processing system market.
KEY QUESTIONS ANSWERED IN THIS REPORT
- How many companies are currently engaged in this market?
- Which are the leading companies in this market?
- What factors are likely to influence the evolution of this market?
- What is the current and future market size?
- What is the CAGR of this market?
- How is the current and future market opportunity likely to be distributed across key market segments?
REASONS TO BUY THIS REPORT
- The report provides a comprehensive market analysis, offering detailed revenue projections of the overall market and its specific sub-segments. This information is valuable to both established market leaders and emerging entrants.
- Stakeholders can leverage the report to gain a deeper understanding of the competitive dynamics within the market. By analyzing the competitive landscape, businesses can make informed decisions to optimize their market positioning and develop effective go-to-market strategies.
- The report offers stakeholders a comprehensive overview of the market, including key drivers, barriers, opportunities, and challenges. This information empowers stakeholders to stay abreast of market trends and make data-driven decisions to capitalize on growth prospects.
ADDITIONAL BENEFITS
- Complimentary PPT Insights Packs
- Complimentary Excel Data Packs for all Analytical Modules in the Report
- 15% Free Content Customization
- Detailed Report Walkthrough Session with Research Team
- Free Updated report if the report is 6-12 months old or older
TABLE OF CONTENTS
1. PREFACE
- 1.1. Scope of the Report
- 1.2. Research Methodology
- 1.2.1. Research Assumptions
- 1.2.2. Project Methodology
- 1.2.3. Forecast Methodology
- 1.2.4. Robust Quality Control
- 1.2.5. Key Considerations
- 1.2.5.1. Demographics
- 1.2.5.2. Economic Factors
- 1.2.5.3. Government Regulations
- 1.2.5.4. Supply Chain
- 1.2.5.6. COVID Impact / Related Factors
- 1.2.5.7. Market Access
- 1.2.5.8. Healthcare Policies
- 1.2.5.9. Industry Consolidation
- 1.3 Key Questions Answered
- 1.4. Chapter Outlines
2. EXECUTIVE SUMMARY
3. INTRODUCTION
- 3.1. Context and Background
- 3.2. Cell Therapies
- 3.3. Cell Therapy Manufacturing
- 3.4. Key Challenges Associated with Manufacturing Cell Therapies
- 3.5. Overview of Automated and Closed Cell Processing Systems
- 3.5.1. Need for Automated and Closed Cell Processing in Cell Therapy Manufacturing
- 3.5.2. Advantages and Affiliated Challenges
- 3.6. Key Growth Drivers and Roadblocks
- 3.7. Recent Developments and Upcoming Trends
4. COMPETITIVE LANDSCAPE
- 4.1. Chapter Overview
- 4.2. Automated and Closed Cell Therapy Processing Systems: Overall Market Landscape
- 4.2.1. Analysis by Cell Processing Step
- 4.2.2. Analysis by Types of Cells
- 4.2.3. Analysis by Type of Culture
- 4.2.4. Analysis by Scale of Operation
- 4.2.5. Analysis by Key Features
- 4.2.6. Analysis by Application Area
- 4.2.7. Analysis by Regulatory Certifications / Accreditations
- 4.2.8. Analysis by End User
- 4.3. Automated and Closed Cell Therapy Processing Systems: Developer Landscape
- 4.3.1. Analysis by Year of Establishment
- 4.3.2. Analysis by Company Size
- 4.3.3. Analysis by Type of Support Service(s) Offered
- 4.3.4. Analysis by Location of Headquarters
5. PRODUCT COMPETITIVENESS ANALYSIS
- 5.1. Chapter Overview
- 5.2. Assumptions / Key Parameters
- 5.3. Methodology
- 5.4. Product Competitiveness Analysis
- 5.4.1. Automated and Closed Cell Processing Systems for Apheresis
- 5.4.2. Automated and Closed Cell Processing Systems for Separation
- 5.4.3. Automated and Closed Cell Processing Systems for Expansion
- 5.4.4. Automated and Closed Cell Processing Systems for Harvest
- 5.4.5. Automated and Closed Cell Processing Systems for Fill Finish
- 5.4.6. Automated and Closed Cell Processing Systems for Cryopreservation
- 5.4.7. Automated and Closed Cell Processing Systems for Thawing
6. COMPANY PROFILES
- 6.1. Chapter Overview
- 6.2. Cytiva
- 6.2.1. Company Overview
- 6.2.2. Product Portfolio
- 6.2.3. Recent Developments and Future Outlook
- 6.3. Pall
- 6.3.1. Company Overview
- 6.3.2. Product Portfolio
- 6.3.3. Recent Developments and Future Outlook
- 6.4. Terumo BCT
- 6.4.1. Company Overview
- 6.4.2. Product Portfolio
- 6.4.3. Financial Information
- 6.4.4. Recent Developments and Future Outlook
- 6.5 ThermoGenesis
- 6.5.1. Company Overview
- 6.5.2. Product Portfolio
- 6.5.3. Financial Information
- 6.5.4. Recent Developments and Future Outlook
7. PARTNERSHIPS
- 7.1. Chapter Overview
- 7.2. Partnership Models
- 7.3. Automated and Closed Cell Therapy Processing Systems: Recent Partnerships
- 7.3.1. Analysis by Year of Partnership
- 7.3.2. Analysis by Type of Partnership
- 7.3.3. Analysis by Type of Therapy
- 7.3.4. Analysis by Cell Processing Step
- 7.3.5. Analysis by Type of Automated and Closed Cell Processing Systems
- 7.3.6. Analysis by Partner's Focus Area
- 7.3.7. Most Active Players: Analysis by Number of Partnerships
- 7.3.8. Geographical Analysis
- 7.3.8.1. Country-Wise Distribution
- 7.3.8.2. Intercontinental and Intracontinental Agreements
8. BIG PHARMA INITIATIVES IN AUTOMATED AND CLOSED CELL THERAPY PROCESSING SYSTEMS DOMAIN
- 8.1. Chapter Overview
- 8.2. Initiatives Undertaken by Big Pharma Players
- 8.2.1. Initiatives Undertaken by AbbVie
- 8.2.2. Initiatives Undertaken by Bristol Myers Squibb
- 8.2.3. Initiatives Undertaken by Gilead Sciences
- 8.2.4. Initiatives Undertaken by GlaxoSmithKline
- 8.2.5. Initiatives Undertaken by Johnson & Johnson
- 8.2.6. Initiatives Undertaken by Novartis
- 8.2.7. Initiatives Undertaken by Roche
- 8.2.8. Initiatives Undertaken by Sanofi
- 8.2.9. Initiatives Undertaken by Takeda Pharmaceutical
- 8.2.10. Summary of Big Pharma Initiatives
9. LIKELY PARTNER
- 9.1. Chapter Overview
- 9.2. Scope and Methodology
- 9.3. Automated and Closed Cell Therapy Processing Systems: Potential Strategic Partners for Cell Therapy Development
- 9.3.1. Dendritic Cell Therapy
- 9.3.2. Stem Cell Therapy
- 9.3.3. T-cell Therapy
- 9.3.4. Natural Killer Cell Therapy
- 9.4. Automated and Closed Cell Therapy Processing Systems: Potential Strategic Partners for Cell Therapy Manufacturing
- 9.4.1. Dendritic Cell Therapy
- 9.4.2. Stem Cell Therapy,
- 9.4.3. T-cell Therapy
- 9.4.4. Natural Killer Cell Therapy
10. CASE STUDY: COST BENEFIT ANALYSIS USING PARTIALLY AUTOMATED AND FULLY AUTOMATED SYSTEMS
- 10.1. Chapter Overview
- 10.2. Comparative Analysis of Manual, Partially Automated and Fully Automated Cell Processing Systems
- 10.3. Likely Cost Saving Potential for Kymriah(R)
- 10.4. Likely Cost Saving Potential for Yescarata(R)
- 10.5. Cost Saving Potential of Fully Automated Processing Systems: Regional Trends
- 10.6. Concluding Remarks
11. MARKET SIZING AND OPPORTUNITY ANALYSIS
- 11.1. Chapter Overview
- 11.2. Key Assumptions and Methodology
- 11.3. Overall Automated and Closed Cell Therapy Processing Systems Market, Till 2035
- 11.3.1. Overall Automated and Closed Cell Therapy Processing Systems Market: Distribution by Cell Therapy Processing Step
- 11.3.1.1. Automated and Closed Cell Therapy Processing Systems Market for Apheresis, Till 2035
- 11.3.1.2. Automated and Closed Cell Therapy Processing Systems Market for Separation, Till 2035
- 11.3.1.3. Automated and Closed Cell Therapy Processing Systems Market for Expansion, Till 2035
- 11.3.1.4. Automated and Closed Cell Therapy Processing Systems Market for Harvest, Till 2035
- 11.3.1.5. Automated and Closed Cell Therapy Processing Systems Market for Fill / Finish, Till 2035
- 11.3.1.6. Automated and Closed Cell Therapy Processing Systems Market for Cryopreservation, Till 2035
- 11.3.1.7. Automated and Closed Cell Therapy Processing Systems Market for Thawing, Till 2035
- 11.3.2. Automated and Closed Cell Therapy Processing Systems Market: Distribution by Scale of Operation
- 11.3.2.1. Automated and Closed Cell Therapy Processing Systems Market for Pre-clinical / Clinical Operations, Till 2035
- 11.3.2.2. Automated and Closed Cell Therapy Processing Systems Market for Commercial Operations, Till 2035
- 11.3.3. Automated and Closed Cell Therapy Processing Systems Market: Distribution by End User
- 11.3.3.1. Automated and Closed Cell Therapy Processing Systems Market for Hospitals / Medical Centers / Clinics / Research Institutes / Academic Institutes, Till 2035
- 11.3.3.2. Automated and Closed Cell Therapy Processing Systems Market for Cell Therapy Manufacturers / Developers, Till 2035
- 11.3.4. Automated and Closed Cell Therapy Processing Systems Market: Distribution by Key Geographic Regions
- 11.3.4.1. Automated and Closed Cell Therapy Processing Systems Market in North America, Till 2035
- 11.3.4.2. Automated and Closed Cell Therapy Processing Systems Market in Europe, Till 2035
- 11.3.4.3. Automated and Closed Cell Therapy Processing Systems Market in Asia-Pacific, Till 2035
- 11.3.4.4. Automated and Closed Cell Therapy Processing Systems Market in Latin America (LATAM), Till 2035
- 11.3.4.5. Automated and Closed Cell Therapy Processing Systems Market in Middle East North America (MENA), Till 2035
- 11.3.1. Overall Automated and Closed Cell Therapy Processing Systems Market: Distribution by Cell Therapy Processing Step
12. CONCLUSION
- 12.1. Chapter Overview
- 12.2. Key Takeaways
13. INTERVIEW / SURVEY TRANSCRIPT(S)
14. APPENDIX 1: TABULATED DATA
15. APPENDIX 2: LIST OF COMPANIES AND ORGANIZATIONS
List of Tables
- Table 3.1. Cell and Advanced Therapies: Key Applications
- Table 3.2. Assessment of Key Cell Therapy Manufacturing Steps
- Table 4.1. List of Automated and Closed Cell Therapy Processing Systems: Information on Cell Processing Step
- Table 4.2. List of Automated and Closed Cell Therapy Processing Systems: Information on Types of Cells
- Table 4.3. List of Automated and Closed Cell Therapy Processing Systems: Information on Type of Culture
- Table 4.4. List of Automated and Closed Cell Therapy Processing Systems: Information on Scale of Operation
- Table 4.5. List of Automated and Closed Cell Therapy Processing Systems: Information on Key Features
- Table 4.6. List of Automated and Closed Cell Therapy Processing Systems: Information on Application Area
- Table 4.7. List of Automated and Closed Cell Therapy Processing Systems: Information on Regulatory Certifications / Accreditations Obtained
- Table 4.8. List of Automated and Closed Cell Therapy Processing Systems: Information on End Users
- Table 4.9. List of Automated and Closed Cell Therapy Processing System Providers
- Table 4.10. List of Automated and Closed Cell Therapy Processing System Providers: Information on Type of Support Service(s) Offered
- Table 6.1. Cytiva: Key Highlights
- Table 6.2. Cytiva: Product Portfolio
- Table 6.3. Pall: Key Highlights
- Table 6.4. Pall: Product Portfolio
- Table 6.5. Terumo BCT: Key Highlights
- Table 6.6. Terumo BCT: Product Portfolio
- Table 6.7. Terumo BCT: Recent Developments and Future Outlook
- Table 6.8. ThermoGenesis: Key Highlights
- Table 6.9. ThermoGenesis: Product Portfolio
- Table 6.10. ThermoGenesis: Recent Developments and Future Outlook
- Table 7.1. Automated and Closed Cell Processing Systems: List of Partnerships, Since 2016
- Table 8.1. Automated and Closed Cell Processing Systems: List of Big Pharma Players
- Table 9.1. Likely Partners for Automated and Closed Cell Therapy Processing System Providers: Dendritic Cell Therapy Developers
- Table 9.2. Likely Partners for Automated and Closed Cell Therapy Processing System Providers: Stem Cell Therapy Developers
- Table 9.3. Likely Partners for Automated and Closed Cell Therapy Processing System Providers: T-cell Therapy Developers
- Table 9.4. Likely Partners for Automated and Closed Cell Therapy Processing System Providers: Natural Killer Cell Therapy Developers
- Table 9.5. Likely Partners for Automated and Closed Cell Therapy Processing System Providers: Dendritic Cell Therapy Manufacturers
- Table 9.6. Likely Partners for Automated and Closed Cell Therapy Processing System Providers: Stem Cell Therapy Manufacturers
- Table 9.7. Likely Partners for Automated and Closed Cell Therapy Processing System Providers: T-cell Therapy Manufacturers
- Table 9.8. Likely Partners for Automated and Closed Cell Therapy Processing System Providers: Natural Killer Cell Therapy Manufacturers
- Table 10.1. Comparative Analysis of Manual, Partially Automated and Fully Automated Cell Processing Systems, Since 2020
- Table 10.2. Cost Saving Potential of Fully Automated Systems
- Table 14.1. Automated and Closed Cell Therapy Processing Systems: Distribution by Cell Processing Step
- Table 14.2. Automated and Closed Cell Therapy Processing Systems: Distribution by Types of Cells
- Table 14.3. Automated and Closed Cell Therapy Processing Systems: Distribution by Type of Culture
- Table 14.4. Automated and Closed Cell Therapy Processing Systems: Distribution by Scale of Operation
- Table 14.5. Automated and Closed Cell Therapy Processing Systems: Distribution by Key Features
- Table 14.6. Automated and Closed Cell Therapy Processing Systems: Distribution by Application Area
- Table 14.7. Automated and Closed Cell Therapy Processing Systems: Distribution by Regulatory Certifications / Accreditations
- Table 14.8. Automated and Closed Cell Therapy Processing Systems: Distribution by End Users
- Table 14.9. Automated and Closed Cell Therapy Processing System Providers: Distribution Year of Establishment
- Table 14.10. Automated and Closed Cell Therapy Processing System Providers: Distribution by Company Size
- Table 14.11. Automated and Closed Cell Therapy Processing System Providers: Distribution by Type of Support Services Offered
- Table 14.12. Automated and Closed Cell Therapy Processing System Providers: Distribution by Geographical Location
- Table 14.13. Automated and Closed Cell Therapy Processing System Providers: Distribution by Geographical Location (Country-Wise)
- Table 14.14. Leading Developers: Distribution by Number of Automated and Closed Cell Therapy Processing Systems
- Table 14.15. Terumo BCT: Annual Revenues, Since FY 2016
- Table 14.16. ThermoGenesis: Annual Revenues, Since FY 2016
- Table 14.17. Recent Partnerships: Cumulative Distribution by Year of Partnership
- Table 14.18. Recent Partnerships: Distribution by Type of Partnership Model Adopted
- Table 14.19. Recent Partnerships: Year-wise Trend by Type of Partnership Model Adopted
- Table 14.20. Recent Partnerships: Distribution by Type of Therapy
- Table 14.21. Recent Partnerships: Distribution by Type of Therapy and Type of Partnership Model Adopted
- Table 14.22. Recent Partnerships: Distribution by Cell Processing Step
- Table 14.23. Recent Partnerships: Distribution by Automated and Closed Cell Processing System
- Table 14.24. Recent Partnerships: Distribution by Type of Partner
- Table 14.25. Recent Partnerships: Distribution by Type of Cell Processing Step and Developer
- Table 14.26. Recent Partnerships: Most Active Players
- Table 14.27. Recent Partnerships: Country-Wise Distribution
- Table 14.28. Recent Partnerships: Intercontinental and Intracontinental Distribution
- Table 14.29. Big Pharma Initiatives Summary
- Table 14.30. Cost Saving Analysis: Comparative Analysis of Manual, Partially Automated and Fully Automated Processing Systems, Till 2035
- Table 14.31. Cost Saving Potential of Fully Automated Processing Systems Based on Number of Patients
- Table 14.32. Cost Saving Potential of Fully Automated Processing Systems Across Different Regions
- Table 14.33. Overall Automated and Closed Cell Therapy Processing Systems Market, Till 2035 (USD Million)
- Table 14.34. Automated and Closed Cell Therapy Processing Systems Market: Distribution by Cell Therapy Processing Step (USD Million)
- Table 14.35. Automated and Closed Cell Therapy Processing Systems Market: Share of Cell Apheresis Systems, Till 2035 (USD Million)
- Table 14.36. Automated and Closed Cell Therapy Processing Systems Market: Share of Cell Separation Systems, Till 2035 (USD Million)
- Table 14.37. Automated and Closed Cell Therapy Processing Systems Market: Share of Cell Expansion Systems, Till 2035 (USD Million)
- Table 14.38. Automated and Closed Cell Therapy Processing Systems Market: Share of Cell Harvesting Systems, Till 2035 (USD Million)
- Table 14.39. Automated and Closed Cell Therapy Processing Systems Market: Share of Fill Finish Systems, Till 2035 (USD Million)
- Table 14.40. Automated and Closed Cell Therapy Processing Systems Market: Share of Cryopreservation Systems, Till 2035 (USD Million)
- Table 14.41. Automated and Closed Cell Therapy Processing Systems Market: Share of Thawing Systems, Till 2035 (USD Million)
- Table 14.42. Automated and Closed Cell Therapy Processing Systems Market: Distribution by Scale of Operation (USD Million)
- Table 14.43. Automated and Closed Cell Therapy Processing Systems Market: Share of Preclinical / Clinical Scale Operations, Till 2035 (USD Million)
- Table 14.44. Automated and Closed Cell Therapy Processing Systems Market: Share of Commercial Operations, Till 2035 (USD Million)
- Table 14.45. Automated and Closed Cell Therapy Processing Systems Market: Distribution by End User (USD Million)
- Table 14.46. Automated and Closed Cell Therapy Processing Systems Market: Share of Hospitals / Medical Centers / Clinics / Research Institutes / Academic Institutes, Till 2035 (USD Million)
- Table 14.47. Automated and Closed Cell Therapy Processing Systems Market: Share of Commercial Organizations, Till 2035 (USD Million)
- Table 14.48. Automated and Closed Cell Therapy Processing Systems Market: Distribution by Key Geographical Regions (USD Million)
- Table 14.49. Automated and Closed Cell Therapy Processing Systems Market: Share of North America, Till 2035 (USD Million)
- Table 14.50. Automated and Closed Cell Therapy Processing Systems Market: Share of Europe, Till 2035 (USD Million)
- Table 14.51. Automated and Closed Cell Therapy Processing Systems Market: Share of Asia-Pacific, Till 2035 (USD Million)
- Table 14.52. Automated and Closed Cell Therapy Processing Systems Market: Share of LATAM, Till 2035 (USD Million)
- Table 14.53. Automated and Closed Cell Therapy Processing Systems Market: Share of MENA, Till 2035 (USD Million)
List of Figures
- Figure 3.1. Key Steps Involved in Manufacturing of Cell Therapies
- Figure 3.2. Key Considerations while Automating Cell Therapy Manufacturing Process
- Figure 3.3. Role of Automated and Closed Systems across Each Cell Therapy Processing Step
- Figure 3.4. Advantages offered by Automated and Closed Cell Processing Systems
- Figure 3.5. Challenges Associated with Automated and Closed Cell Processing Systems
- Figure 3.6. Growth Drivers and Roadblocks in the Automated and Closed Systems Market
- Figure 4.1. Automated and Closed Cell Therapy Processing Systems: Distribution by Cell Processing Step
- Figure 4.2. Automated and Closed Cell Therapy Processing Systems: Distribution by Types of Cells
- Figure 4.3. Automated and Closed Cell Therapy Processing Systems: Distribution by Type of Culture
- Figure 4.4. Automated and Closed Cell Therapy Processing Systems: Distribution by Scale of Operation
- Figure 4.5. Automated and Closed Cell Therapy Processing Systems: Distribution by Key Features
- Figure 4.6. Automated and Closed Cell Therapy Processing Systems: Distribution by Application Area
- Figure 4.7. Automated and Closed Cell Therapy Processing Systems: Distribution by Regulatory Certifications / Accreditations
- Figure 4.8. Automated and Closed Cell Therapy Processing Systems: Distribution by End Users
- Figure 4.9. Automated and Closed Cell Therapy Processing System Providers: Distribution by Year of Establishment
- Figure 4.10. Automated and Closed Cell Therapy Processing System Providers: Distribution by Company Size
- Figure 4.11. Automated and Closed Cell Therapy Processing System Providers: Distribution by Type of Support Services Offered
- Figure 4.12. Automated and Closed Cell Therapy Processing System Providers: Distribution by Geographical Location
- Figure 4.13. Automated and Closed Cell Therapy Processing System Providers: Distribution by Geographical Location (Country-Wise)
- Figure 4.14. Leading Developers: Distribution by Number of Automated and Closed Cell Therapy Processing Systems
- Figure 5.1. Product Competitiveness Analysis: Automated and Closed Systems for Cell Apheresis
- Figure 5.2. Product Competitiveness Analysis: Automated and Closed Systems for Cell Separation
- Figure 5.3. Product Competitiveness Analysis: Automated and Closed Systems for Cell Expansion
- Figure 5.4. Product Competitiveness Analysis: Automated and Closed Systems for Cell Harvesting
- Figure 5.5. Product Competitiveness Analysis: Automated and Closed Systems for Fill Finish
- Figure 5.6. Product Competitiveness Analysis: Automated and Closed Systems for Cryopreservation
- Figure 5.7. Product Competitiveness Analysis: Automated and Closed Systems for Thawing
- Figure 6.1. Terumo BCT: Annual Revenues, Since FY 2016
- Figure 6.2. ThermoGenesis: Annual Revenues, Since FY 2016
- Figure 7.1. Recent Partnerships: Cumulative Distribution by Year of Partnership
- Figure 7.2. Recent Partnerships: Distribution by Type of Partnership Model Adopted
- Figure 7.3. Recent Partnerships: Year-wise Trend by Type of Partnership Model Adopted
- Figure 7.4. Recent Partnerships: Distribution by Type of Therapy
- Figure 7.5. Recent Partnerships: Distribution by Type of Therapy and Type of Partnership Model Adopted
- Figure 7.6. Recent Partnerships: Distribution by Cell Processing Step
- Figure 7.7. Recent Partnerships: Distribution by Automated and Closed Cell Processing System
- Figure 7.8. Recent Partnerships: Distribution by Type of Partner
- Figure 7.9. Recent Partnerships: Distribution by Type of Cell Processing Step and Developer
- Figure 7.10. Recent Partnerships: Most Active Players
- Figure 7.11. Recent Partnerships: Country-Wise Distribution
- Figure 7.12. Recent Partnerships: Intercontinental and Intracontinental Distribution
- Figure 8.1. Big Pharma Initiatives Summary
- Figure 10.1. Cost Saving Analysis: Comparative Analysis of Manual, Partially Automated and Fully Automated Processing Systems, Till 2035
- Figure 10.2. Cost Saving Potential of Fully Automated Processing Systems Based on Number of Patients
- Figure 10.3. Cost Saving Potential of Fully Automated Processing Systems Across Different Regions
- Figure 11.1. Overall Automated and Closed Cell Therapy Processing Systems Market, Till 2035 (USD Million)
- Figure 11.2. Automated and Closed Cell Therapy Processing Systems Market: Distribution by Cell Therapy Processing Step (USD Million)
- Figure 11.3. Automated and Closed Cell Therapy Processing Systems Market: Share of Cell Apheresis Systems, Till 2035 (USD Million)
- Figure 11.4. Automated and Closed Cell Therapy Processing Systems Market: Share of Cell Separation Systems, Till 2035 (USD Million)
- Figure 11.5. Automated and Closed Cell Therapy Processing Systems Market: Share of Cell Expansion Systems, Till 2035 (USD Million)
- Figure 11.6. Automated and Closed Cell Therapy Processing Systems Market: Share of Cell Harvesting Systems, Till 2035 (USD Million)
- Figure 11.7. Automated and Closed Cell Therapy Processing Systems Market: Share of Fill Finish Systems, Till 2035 (USD Million)
- Figure 11.8. Automated and Closed Cell Therapy Processing Systems Market: Share of Cryopreservation Systems, Till 2035 (USD Million)
- Figure 11.9. Automated and Closed Cell Therapy Processing Systems Market: Share of Thawing Systems, Till 2035 (USD Million)
- Figure 11.10. Automated and Closed Cell Therapy Processing Systems Market: Distribution by Scale of Operation (USD Million)
- Figure 11.11. Automated and Closed Cell Therapy Processing Systems Market: Share of Preclinical / Clinical Scale Operations, Till 2035 (USD Million)
- Figure 11.12. Automated and Closed Cell Therapy Processing Systems Market: Share of Commercial Operations, Till 2035 (USD Million)
- Figure 11.13. Automated and Closed Cell Therapy Processing Systems Market: Distribution by End User (USD Million)
- Figure 11.14. Automated and Closed Cell Therapy Processing Systems Market: Share of Hospitals / Medical Centers / Clinics / Research Institutes / Academic Institutes, Till 2035 (USD Million)
- Figure 11.16. Automated and Closed Cell Therapy Processing Systems Market: Share of Commercial Organizations, Till 2035 (USD Million)
- Figure 11.17. Automated and Closed Cell Therapy Processing Systems Market: Distribution by Key Geographical Regions (USD Million)
- Figure 11.18. Automated and Closed Cell Therapy Processing Systems Market: Share of North America, Till 2035 (USD Million)
- Figure 11.19. Automated and Closed Cell Therapy Processing Systems Market: Share of Europe, Till 2035 (USD Million)
- Figure 11.20. Automated and Closed Cell Therapy Processing Systems Market: Share of Asia-Pacific, Till 2035 (USD Million)
- Figure 11.21. Automated and Closed Cell Therapy Processing Systems Market: Share of LATAM, Till 2035 (USD Million)
- Figure 11.22. Automated and Closed Cell Therapy Processing Systems Market: Share of MENA, Till 2035 (USD Million)
 細胞和基因治療供應鏈軟體市場分析及預測(至2035年):按類型、產品類型、服務、技術、組件、應用、流程、部署類型、最終用戶和階段分類
 全球人類細胞治療原料市場規模、佔有率、趨勢和成長分析報告(2026-2034年)全球細胞治療市場規模、佔有率、趨勢和成長分析報告(2026-2034年)
 細胞療法市場規模、佔有率、趨勢及預測(按細胞類型、治療方法、治療領域、最終用戶和地區分類),2026-2034年
 人類細胞治療材料市場-全球產業規模、佔有率、趨勢、機會及預測(依產品、最終用戶、地區及競爭格局分類,2021-2031年)
 核受體檢測服務市場(按檢測類型、受體類別、技術、應用和最終用戶分類),全球預測,2026-2032年細胞療法生物製造市場按製造模式、治療領域、製程步驟、細胞類型和最終用戶分類,全球預測(2026-2032年)細胞療法市場規模、佔有率、成長及全球產業分析:依類型、應用、區域洞察及預測(2026-2034 年)自動化和封閉式細胞治療市場-2026-2031年預測日本細胞治療市場報告:按細胞類型、治療方法、治療領域、最終用戶和地區分類(2026-2034年)