


 |
市場調查報告書
商品編碼
1762522
反義寡核苷酸市場:產業趨勢及全球預測 - 依反義分子類型、反義寡核苷酸生成類型、標靶適應症、給藥途徑、治療類型和地區Antisense Oligonucleotides Market: Industry Trends and Global Forecasts - Distribution by Type of Antisense Molecule, Type of ASO Generation, Target Disease Indication, Route of Administration, Type of Therapy, and Geography |
||||||
反義寡核苷酸市場:概覽
今年反義寡核苷酸市場規模估計為 25億美元,預計在預測期內的年複合成長率為 15%。
本市場細分依據以下參數劃分市場規模與機會:
反義分子類型
- DNA分子
- RNA分子
反義寡核苷酸(ASO)的代數
- 第一代產品
- 第二代產品
- 第三代產品
目標適應症
- 肌萎縮側索硬化症
- 杜氏肌肉營養不良症
- 家族性乳糜微粒血症綜合症
- 家族性局部脂質營養不良
- 遺傳性轉甲狀腺素蛋白(hATTR)澱粉樣變性
- 亨丁頓舞蹈症
- 萊伯氏先天性黑曚症
- 脊髓性肌肉萎縮症
給藥途徑
- 鞘內給藥
- 靜脈給藥
- 玻璃體內治療
- 皮下治療
- Intraorifice治療
治療類型
- 合併治療
- 單藥治療
地區
- 北美
- 歐洲
- 亞太地區
- 世界其他地區
反義寡核苷酸市場:成長與趨勢
寡核苷酸是由15-20個核苷酸殘基組成的短的單股DNA或RNA分子。在現代生物製藥中,這些寡核苷酸的應用非常廣泛,包括但不限於基因檢測、基礎生物分子研究和法醫分析。反義寡核苷酸是一種功能多樣的寡核苷酸,是短鏈單股RNA/DNA分子,能夠特異性結合標靶mRNA,並且能夠透過多種機制改變蛋白質表現。
反義療法被認為是最有前景的藥物之一,它可以抑制蛋白質生成並抑制人類基因組中特定目標基因的功能。目前,這種機制是許多處於臨床試驗不同階段的治療藥物的基礎,這些藥物用於治療各種疾病,包括腫瘤、遺傳、肝臟、呼吸系統和傳染病。事實上,近年來,寡核苷酸藥物的開發者也在研究寡核苷酸干預措施對抗冠狀病毒(COVID-19)的適用性。鑑於反義寡核苷酸市場的創新和發展速度,預計反義寡核苷酸將成為未來的主要治療途徑。
反義寡核苷酸市場:關鍵洞察
本報告分析了反義寡核苷酸市場的現狀,並指出了潛在的成長機會。報告的主要調查結果包括:
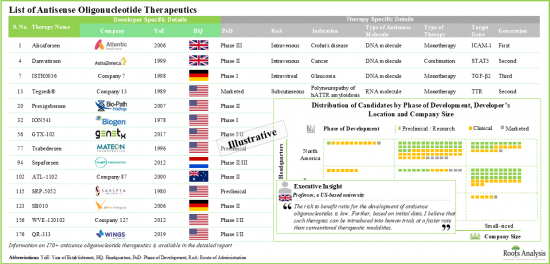
- 目前,全球約有 30 家公司研究治療各種適應症的藥物,以評估反義寡核苷酸的潛在治療效果。
- 目前有超過 170 種處於不同開發階段的候選藥物研發中,這些藥物被評估為單藥治療或與其他治療藥物合併使用。
- 大多數已核准的治療藥物和後期候選藥物都目的是治療遺傳、神經系統和腫瘤疾病。
- 鑑於反義寡核苷酸的益處,這些干預措施主要作為單藥療法進行評估。目前研究作為單藥療法的後期藥物包括Tofersen和Pelacarsen。
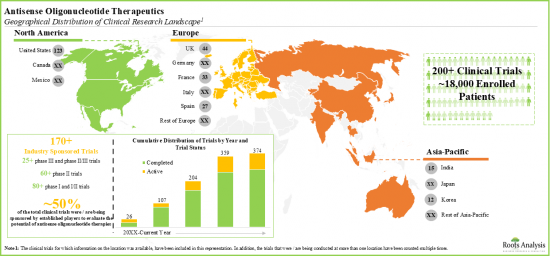
- 已有超過18,000名患者入組臨床試驗,評估近70種基於反義寡核苷酸的候選療法。
- 大多數反義寡核苷酸療法設計為皮下給藥,但患者也可以使用各種給藥系統自行給藥。
- 一些組織為該領域的研究活動提供資金支持。目前,重點主要放在研究治療神經系統疾病的藥物。
- 過去幾年,美國授予該領域的利害關係人資助金額穩定成長,其中超過70%的金額用於研究計畫。
- NIH的各個管理機構都參與了該領域,其中NINDS、NHLBI和NCI尤為突出。
- 各利害關係人在不同應用領域建立的合作關係數量也反映了人們對該領域日益成長的興趣。
- 目前有近20個分子處於後期開發階段,各公司之間的合作主要是為了產品開發和商業化。
- 過去,老牌企業和新進者都建立了策略夥伴關係,這些協議主要針對遺傳和神經系統疾病。
- 就上市藥物和後期藥物的銷售收入而言,未來的機會預計將在不同的疾病領域、分子類型和主要地理區域呈現高度多樣化。
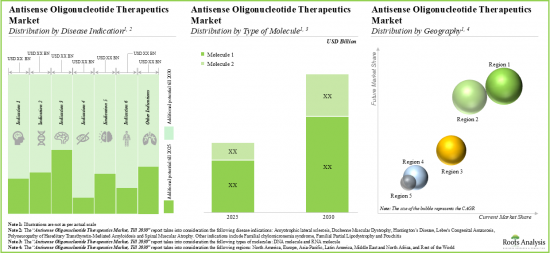
- 未來十年,該市場可能會持續穩定成長,不同世代、不同給藥途徑和不同治療類型的市場機會也將更加多樣化。
反義寡核苷酸市場參與者範例
- Antisense Therapeutics
- Biogen
- Bio-Path Holdings
- Ionis Pharmaceuticals
- ProQR Therapeutics
- Sarepta Therapeutics
- Sterna Biologicals
- Wave Life Sciences
目錄
第1章 簡介
第2章 執行摘要
第3章 簡介
- 章節概述
- 寡核苷酸及相關藥物概述
- 寡核苷酸的類型
- 寡核苷酸治療學
- RNA干擾治療學
- 反義寡核苷酸治療學
- 未來展望
第4章 反義寡核苷酸治療學:市場格局
- 章節概述
- 反義寡核苷酸治療學:研發管線回顧
- 依反義分子類型分析
- 依ASO世代分析
- 依開發階段分析
- 依目標基因分析
- 依標靶適應症分析
- 依治療領域分析
- 依給藥途徑分析
- 依治療方案分析
- 反義寡核苷酸治療學:開發商名單
- 依成立年份分析
- 依公司規模分析
第4章 依總部位置分析
第5章 公司簡介
- 章節概述
- Antisense Therapeutics
- Biogen
- Bio-Path Holdings
- Ionis Pharmaceuticals
- ProQR Therapeutics
- Sarepta Therapeutics
- Sterna Biologicals
- Wave Life Sciences
第6章 臨床試驗分析
- 章節概述
- 研究範圍與研究方法
- 反義寡核苷酸療法:臨床試驗分析
第7章 學術資助分析
- 章節概述
- 範圍與方法
- 反義寡核苷酸療法:學術資助分析
第8章 合作夥伴關係與合作
- 章節概述
- 合作模式
- 反義寡核苷酸療法:合作關係與合作概覽
第9章 市場預測與機會分析
- 章節概述
- 預測研究方法與關鍵假設
- 2035年全球反義寡核苷酸療法市場
- 2035年全球反義寡核苷酸療法市場:單一產品銷售預測
- 2035年全球反義寡核苷酸療法市場:依反義分子類型
- 2035年全球反義寡核苷酸治療市場:依ASO代數
- 2035年全球反義寡核苷酸治療市場:依標靶適應症
- 2035年全球反義寡核苷酸治療市場:依給藥途徑
- 2035年全球反義寡核苷酸治療市場:依治療類型
- 2035年全球反義寡核苷酸治療市場:依地區
第10章 案例研究:寡核苷酸製造商和純化服務
- 章節概述
- 專門用於研究和診斷應用的寡核苷酸製造商列表
- 專門用於治療應用的寡核苷酸製造商列表
第11章 結論
第12 附錄1 表格資料
第13章 附錄2 公司與組織清單
ANTISENSE OLIGONUCLEOTIDES MARKET: OVERVIEW
As per Roots Analysis, the global antisense oligonucleotides market valued at USD 2.5 billion in the current year is anticipated to grow at a lucrative CAGR of 15% during the forecast period.
The market sizing and opportunity analysis has been segmented across the following parameters:
Type of Antisense Molecule
- DNA Molecules
- RNA Molecules
Type of ASO Generation
- First-Generation Products
- Second-Generation Products
- Third-Generation Products
Target Disease Indication
- Amyotrophic Lateral Sclerosis
- Duchenne Muscular Dystrophy
- Familial Chylomicronemia Syndrome
- Familial Partial Lipodystrophy
- Hereditary Transthyretin-Mediated (hATTR) Amyloidosis
- Huntington's Disease
- Leber's Congenital Amaurosis
- Spinal Muscular Atrophy
Route of Administration
- Intrathecal Therapies
- Intravenous Therapies
- Intravitreal Therapies
- Subcutaneous Therapies
- Intraorifice Therapies
Type of Therapy
- Combination Therapies
- Monotherapies
Geography
- North America
- Europe
- Asia-Pacific
- Rest of the World
ANTISENSE OLIGONUCLEOTIDES MARKET: GROWTH AND TRENDS
Oligonucleotides are short single stranded DNA or RNA molecules, that comprise 15-20 nucleotide residues. In modern biopharmaceuticals, the applications of these oligonucleotides are vast, including (but not limited to) genetic testing, fundamental biomolecular research, and forensic analysis. Antisense oligonucleotides, a diverse class of oligonucleotides are short, single-stranded RNA / DNA molecules specifically binding to the target mRNA and have the ability to modify protein expression through a variety of mechanisms.
Antisense therapeutics are considered to be one of the most promising agents for impairing protein production and blocking the function of the specific target gene of interest in the human genome. Presently, this mechanism forms the basis for many therapeutics being investigated in different stages of clinical trials for treatment of a variety of disorders, including oncological disorders, genetic diseases, hepatic diseases, respiratory disorders and infectious diseases. In fact, in the recent past, the oligonucleotide drug developers had also investigated the relevance of these interventions against the Coronavirus (COVID-19). Given the pace of innovation and developments in the antisense oligonucleotides market, we can expect antisense oligonucleotides to become a major therapeutic modality in the foreseen future.
ANTISENSE OLIGONUCLEOTIDES MARKET: KEY INSIGHTS
The report delves into the current state of the antisense oligonucleotides market and identifies potential growth opportunities within industry. Some key findings from the report include:
- Around 30 players from are presently engaged in evaluating the potential therapeutic benefits of antisense oligonucleotides for the treatment of a wide range of disease indications, worldwide.
- The pipeline features 170+ candidate therapies in different stages of development, being evaluated either as monotherapies or in combination with other interventions; most of these products are administered parenterally.
- Majority of the approved therapies and late-stage candidates are intended for the treatment of genetic disorders, neurological disorders and oncological disorders.
- Given the advantages of antisense oligonucleotides, these interventions are primarily evaluated as monotherapy. Late-stage drugs being investigated as monotherapy include Tofersen and Pelacarsen.
- Over 18,000 patients have been enrolled in clinical trial sites evaluating close to 70 antisense oligonucleotide-based therapy candidates.
- Majority of the antisense oligonucleotide therapeutics are designed for subcutaneous administration; these can be self-administered by the patients using different drug delivery systems.
- Several organizations have extended financial support to aid research efforts in this domain; currently, the focus, in terms of funds disbursed, is primarily in support of investigations of drugs for treating neurological conditions.
- The number of grants awarded to stakeholders in this domain (in the US) has continuously increased in the past few years; more than 70% of the total amount was awarded for research projects.
- The field has witnessed the involvement of various administering institutes of the NIH; of all the institutes, participation of the NINDS, NHLBI, and NCI has been relatively more prominent.
- The rising interest in this field is reflected in the number of partnerships inked by the various stakeholders across different application areas.
- Given that nearly 20 molecules are in the late stages of development, companies have primarily collaborated for product development and commercialization purposes.
- Both established players and the new entrants have forged strategic partnerships in the recent past; these deals have primarily been inked for genetic and neurological disorders.
- The future opportunity, in terms of revenues from the sales of marketed and late-stage therapies, is anticipated to be well distributed across different disease areas, types of molecules and key geographical regions.
- The market is likely to witness steady growth over the coming decade; the opportunity will be dispersed across different generations, routes of administration and various types of therapies.
Example Players in the Antisense Oligonucleotides Market
- Antisense Therapeutics
- Biogen
- Bio-Path Holdings
- Ionis Pharmaceuticals
- ProQR Therapeutics
- Sarepta Therapeutics
- Sterna Biologicals
- Wave Life Sciences
ANTISENSE OLIGONUCLEOTIDES MARKET: RESEARCH COVERAGE
- Market Sizing and Opportunity Analysis: The report features an in-depth analysis of the global antisense oligonucleotides market, focusing on key market segments, including [A] type of antisense molecule, [B] type of ASO generation, [C] target disease indication, [D] route of administration, [E] type of therapy and [F] geography.
- Market Landscape: A comprehensive evaluation of antisense oligonucleotide therapeutics, based on several relevant parameters, such as [A] type of antisense molecule, [B] ASO generation, [C] phase of development of lead candidates, [D] target genes, [E] target disease indications, [F] target therapeutic areas, [G] route of administration and [H] type of therapy. Additionally, a comprehensive evaluation of drug developers, based on several relevant parameters, such as [A] year of establishment, [B] company size and [C] location of headquarters.
- Company Profiles: In-depth profiles of antisense oligonucleotide therapeutic developers, focusing on [A] overview of the company, [B] financial information (if available), [C] product portfolio and [D] recent developments and an informed future outlook.
- Clinical Trial Analysis: An insightful analysis of clinical trials related to antisense oligonucleotide therapeutics, based on several parameters, such as [A] trial registration year, [B] trial phase, [C] trial recruitment status, [D] enrolled patient population, [E] study design, leading industry sponsors / collaborators (in terms of number of trials conducted), [F] trial focus, [G] target therapeutic area and [H] target genes.
- Grants Analysis: A comprehensive assessment of grants that have been awarded to research institutes for antisense oligonucleotide therapeutic projects, based on various relevant parameters, such as [A] year of grant award, [B] amount awarded, [C] administering institute center, [D] support period, [E] type of grant application, [F] purpose of grant award, [G] activity code, [H] study section involved, [I] type of recipient organizations and [J] focus area. Additionally, a comprehensive assessment of grants focusing on, [A] geographical distribution of recipient organizations, [B] popular therapeutic areas, [C] popular funding institute centers, [D] prominent program officers and [E] popular recipient organizations.
- Partnerships and Collaborations: An insightful analysis of the deals inked by stakeholders in the antisense oligonucleotide market, based on several parameters, such as [A] year of partnership, [B] type of partnership, [C] most active players (in terms of number of partnerships signed) and [D] regional analysis.
- Case Study: A detailed discussion on the oligonucleotide CMOs and purification service providers, highlighting information on the [A] year of establishment, [B] company size, [C] scale of operation, [D] location of headquarters and [E] type of purification method used.
KEY QUESTIONS ANSWERED IN THIS REPORT
- How many companies are currently engaged in this market?
- Which are the leading companies in this market?
- What factors are likely to influence the evolution of this market?
- What is the current and future market size?
- What is the CAGR of this market?
- How is the current and future market opportunity likely to be distributed across key market segments?
REASONS TO BUY THIS REPORT
- The report provides a comprehensive market analysis, offering detailed revenue projections of the overall market and its specific sub-segments. This information is valuable to both established market leaders and emerging entrants.
- Stakeholders can leverage the report to gain a deeper understanding of the competitive dynamics within the market. By analyzing the competitive landscape, businesses can make informed decisions to optimize their market positioning and develop effective go-to-market strategies.
- The report offers stakeholders a comprehensive overview of the market, including key drivers, barriers, opportunities, and challenges. This information empowers stakeholders to stay abreast of market trends and make data-driven decisions to capitalize on growth prospects.
ADDITIONAL BENEFITS
- Complimentary PPT Insights Packs
- Complimentary Excel Data Packs for all Analytical Modules in the Report
- 15% Free Content Customization
- Detailed Report Walkthrough Session with Research Team
- Free Updated report if the report is 6-12 months old or older
TABLE OF CONTENTS
1. PREFACE
- 1.1. Scope of the Report
- 1.2. Research Methodology
- 1.2.1. Research Assumptions
- 1.2.2. Project Methodology
- 1.2.3. Forecast Methodology
- 1.2.4. Robust Quality Control
- 1.2.5. Key Considerations
- 1.2.5.1. Demographics
- 1.2.5.2. Economic Factors
- 1.2.5.3. Government Regulations
- 1.2.5.4. Supply Chain
- 1.2.5.5. COVID Impact / Related Factors
- 1.2.5.6. Market Access
- 1.2.5.7. Healthcare Policies
- 1.2.5.8. Industry Consolidation
- 1.3 Key Questions Answered
- 1.4. Chapter Outlines
2. EXECUTIVE SUMMARY
3. INTRODUCTION
- 3.1. Chapter Overview
- 3.2. Overview on Oligonucleotides and Affiliated Medical Products
- 3.2.1. Types of Oligonucleotides
- 3.2.1.1. Antisense Oligonucleotides (ASOs)
- 3.2.1.2. Aptamers
- 3.2.1.3. miRNA
- 3.2.1.4. shRNA
- 3.2.1.5. siRNA
- 3.2.1.6. Other Oligonucleotides
- 3.2.1. Types of Oligonucleotides
- 3.3. Oligonucleotide Therapeutics
- 3.3.1. RNA-Interference Therapeutics
- 3.3.1.1. Components of RNA-Interference Therapeutics
- 3.3.1.2. Mechanism of RNA-Interference Therapeutics
- 3.3.2. Antisense Oligonucleotide Therapeutics
- 3.3.2.1. Mechanism of Antisense Oligonucleotide Therapeutics
- 3.3.2.2. Types of Antisense Oligonucleotide Therapeutics
- 3.3.1. RNA-Interference Therapeutics
- 3.4. Future Perspectives
4. ANTISENSE OLIGONUCLEOTIDE THERAPEUTICS: MARKET LANDSCAPE
- 4.1. Chapter Overview
- 4.2. Antisense Oligonucleotide Therapeutics: Pipeline Review
- 4.2.1. Analysis by Type of Antisense Molecule
- 4.2.2. Analysis by ASO Generation
- 4.2.3. Analysis by Phase of Development
- 4.2.4. Analysis by Target Genes
- 4.2.5. Analysis by Target Indications
- 4.2.6. Analysis by Therapeutic Areas
- 4.2.7. Analysis by Route of Administration
- 4.2.8. Analysis by Type of Therapy
- 4.3. Antisense Oligonucleotide Therapeutics: List of Developers
- 4.3.1. Analysis by Year of Establishment
- 4.3.2. Analysis by Company Size
4. 3.3. Analysis by Location of Headquarters
- 4.4. Grid Analysis: Distribution by Phase of Development, Company Size and Location of Headquarters
5. COMPANY PROFILES
- 5.1. Chapter Overview
- 5.2. Antisense Therapeutics
- 5.2.1. Company Overview
- 5.2.2. Antisense Oligonucleotide Therapeutics Portfolio
- 5.2.3. Recent Developments and Future Outlook
- 5.3. Biogen
- 5.3.1. Company Overview
- 5.3.2. Financial Information
- 5.3.3. Antisense Oligonucleotide Therapeutics Portfolio
- 5.3.4. Recent Developments and Future Outlook
- 5.4. Bio-Path Holdings
- 5.4.1. Company Overview
- 5.4.2. Antisense Oligonucleotide Therapeutics Portfolio
- 5.4.3. Recent Developments and Future Outlook
- 5.5. Ionis Pharmaceuticals
- 5.5.1. Company Overview
- 5.5.2. Financial Information
- 5.5.3. Antisense Oligonucleotide Therapeutics Portfolio
- 5.5.4. Recent Developments and Future Outlook
- 5.6. ProQR Therapeutics
- 5.6.1. Company Overview
- 5.6.2. Antisense Oligonucleotide Therapeutics Portfolio
- 5.6.3. Recent Developments and Future Outlook
- 5.7. Sarepta Therapeutics
- 5.7.1. Company Overview
- 5.7.2. Financial Information
- 5.7.3. Antisense Oligonucleotide Therapeutics Portfolio
- 5.7.4. Recent Developments and Future Outlook
- 5.8. Sterna Biologicals
- 5.8.1. Company Overview
- 5.8.2. Antisense Oligonucleotide Therapeutics Portfolio
- 5.8.3. Recent Developments and Future Outlook
- 5.9. Wave Life Sciences
- 5.9.1. Company Overview
- 5.9.2. Financial Information
- 5.9.3. Antisense Oligonucleotide Therapeutics Portfolio
- 5.9.4. Recent Developments and Future Outlook
6. CLINICAL TRIAL ANALYSIS
- 6.1. Chapter Overview
- 6.2. Scope and Methodology
- 6.3. Antisense Oligonucleotide Therapeutics: Clinical Trial Analysis
- 6.3.1. Analysis by Trial Registration Year
- 6.3.2. Analysis by Trial Phase
- 6.3.3. Analysis by Trial Recruitment Status
- 6.3.4. Analysis by Trial Registration Year and Number of Patients Enrolled
- 6.3.5. Analysis by Study Design
- 6.3.6. Analysis by Type of Sponsor / Collaborator
- 6.3.7. Leading Players: Analysis by Number of Registered Trials
- 6.3.8. Word Cloud: Key Focus Areas
- 6.3.9. Analysis by Target Therapeutic Area
- 6.3.10. Analysis by Trial Registration Year and Target Gene
- 6.3.11. Popular Indications: Analysis by Number of Registered Trials
- 6.3.12. Popular Interventions: Analysis by Number of Registered Trials
- 6.3.13. Geographical Analysis by Number of Registered Trials
- 6.3.14. Geographical Analysis by Number of Patients Enrolled
7. ACADEMIC GRANTS ANALYSIS
- 7.1. Chapter Overview
- 7.2. Scope and Methodology
- 7.3. Antisense Oligonucleotide Therapeutics: Analysis of Academic Grants
- 7.3.1. Analysis by Year of Grant Award
- 7.3.2. Analysis by Amount Awarded
- 7.3.3. Analysis by Administering Institute Center
- 7.3.4. Analysis by Support Period
- 7.3.5. Analysis by Administering Institute Center and Support Period
- 7.3.6. Analysis by Type of Grant Application
- 7.3.7. Analysis by Purpose of Grant Award
- 7.3.8. Analysis by Activity Code
- 7.3.9. Analysis by Study Section Involved
- 7.3.10. Analysis by Type of Recipient Organization
- 7.3.11. Word Cloud Analysis: Emerging Focus Areas
- 7.3.12. Geographical Distribution of Recipient Organizations
- 7.3.13. Popular Therapeutic Areas: Analysis by Number of Grants
- 7.3.14. Popular NIH Departments: Analysis by Number of Grants
- 7.3.15. Prominent Program Officers: Analysis by Number of Grants
- 7.3.16. Popular Recipient Organizations: Analysis by Number of Grants
8. PARTNERSHIPS AND COLLABORATIONS
- 8.1. Chapter Overview
- 8.2. Partnership Models
- 8.3. Antisense Oligonucleotide Therapeutics: List of Partnerships and Collaborations
- 8.3.1. Analysis by Year of Partnership
- 8.3.2. Analysis by Type of Partnership
- 8.3.3. Analysis by Type of Partnership and Generation of Antisense Molecule Involved
- 8.3.4. Analysis by Type of Partnership and Target Therapeutic Area
- 8.3.5. Analysis by Year of Partnership and Type of Partner
- 8.3.6. Analysis by Type of Partnership and Type of Partner
- 8.3.7. Most Active Players: Analysis by Number of Partnerships
- 8.3.8. Regional Analysis
- 8.3.8.1. Intercontinental and Intracontinental Agreements
9. MARKET FORECAST AND OPPORTUNITY ANALYSIS
- 9.1. Chapter Overview
- 9.2. Forecast Methodology and Key Assumptions
- 9.3. Global Antisense Oligonucleotide Therapeutics Market, Till 2035
- 9.4. Global Antisense Oligonucleotide Therapeutics Market, Till 2035: Individual Product Sales Forecasts
- 9.4.1. Alicaforsen (Atlantic Healthcare)
- 9.4.1.1. Target Patient Population
- 9.4.1.2. Sales Forecast
- 9.4.2. Eteplirsen (Sarepta Therapeutics)
- 9.4.2.1. Target Patient Population
- 9.4.2.2. Sales Forecast
- 9.4.3. Golodirsen (Sarepta Therapeutics)
- 9.4.3.1. Target Patient Population
- 9.4.3.2. Sales Forecast
- 9.4.4. Inotersen (Ionis Pharmaceuticals)
- 9.4.4.1. Target Patient Population
- 9.4.4.2. Sales Forecast
- 9.4.5. Sepofarsen (ProQR Therapeutics)
- 9.4.5.1. Target Patient Population
- 9.4.5.2. Sales Forecast
- 9.4.6. Tofersen (Biogen)
- 9.4.6.1. Target Patient Population
- 9.4.6.2. Sales Forecast
- 9.4.7. Tominersen (Roche)
- 9.4.7.1. Target Patient Population
- 9.4.7.2. Sales Forecast
- 9.4.8. Viltolarsen (Nippon Shinyaku)
- 9.4.8.1. Target Patient Population
- 9.4.8.2. Sales Forecast
- 9.4.9. Volanesorsen (Ionis Pharmaceuticals)
- 9.4.9.1. Target Patient Population
- 9.4.9.2. Sales Forecast
- 9.4.1. Alicaforsen (Atlantic Healthcare)
- 9.5. Global Antisense Oligonucleotide Therapeutics Market, Till 2035: Distribution by Type of Antisense Molecule
- 9.5.1. Global Antisense Oligonucleotide Therapeutics Market for RNA Molecules, Till 2035
- 9.5.2. Global Antisense Oligonucleotide Therapeutics Market for DNA Molecules, Till 2035
- 9.6. Global Antisense Oligonucleotide Therapeutics Market, Till 2035: Distribution by ASO Generation
- 9.6.1. Global Antisense Oligonucleotide Therapeutics Market for First-generation Products, Till 2035
- 9.6.2. Global Antisense Oligonucleotide Therapeutics Market for Second-generation Products, Till 2035
- 9.6.3. Global Antisense Oligonucleotide Therapeutics Market for Third-generation Products, Till 2035
- 9.7. Global Antisense Oligonucleotide Therapeutics Market, Till 2035: Distribution by Target Disease Indication
- 9.7.1. Global Antisense Oligonucleotide Therapeutics Market for Amyotrophic Lateral Sclerosis, Till 2035
- 9.7.2. Global Antisense Oligonucleotide Therapeutics Market for Duchenne Muscular Dystrophy, Till 2035
- 9.7.3. Global Antisense Oligonucleotide Therapeutics Market for Familial Chylomicronemia Syndrome, Till 2035
- 9.7.4. Global Antisense Oligonucleotide Therapeutics Market for Familial Partial Lipodystrophy, Till 2035
- 9.7.5. Global Antisense Oligonucleotide Therapeutics Market for Hereditary Transthyretin-Mediated (hATTR) Amyloidosis, Till 2035
- 9.7.6. Global Antisense Oligonucleotide Therapeutics Market for Huntington's Disease, Till 2035
- 9.7.7. Global Antisense Oligonucleotide Therapeutics Market for Leber's Congenital Amaurosis, Till 2035
- 9.7.8. Global Antisense Oligonucleotide Therapeutics Market for Pouchitis, Till 2035
- 9.7.9. Global Antisense Oligonucleotide Therapeutics Market for Spinal Muscular Atrophy, Till 2035
- 9.8. Global Antisense Oligonucleotide Therapeutics Market, Till 2035: Distribution by Route of Administration
- 9.8.1. Global Antisense Oligonucleotide Therapeutics Market for Intrathecal Therapies, Till 2035
- 9.8.2. Global Antisense Oligonucleotide Therapeutics Market for Intravenous Therapies, Till 2035
- 9.8.3. Global Antisense Oligonucleotide Therapeutics Market for Intravitreal Therapies, Till 2035
- 9.8.4. Global Antisense Oligonucleotide Therapeutics Market for Subcutaneous Therapies, Till 2035
- 9.8.5. Global Antisense Oligonucleotide Therapeutics Market for Intraorifice Therapies, Till 2035
- 9.9. Global Antisense Oligonucleotide Therapeutics Market, Till 2035: Distribution by Type of Therapy
- 9.9.1. Global Antisense Oligonucleotide Therapeutics Market for Combination Therapies Till 2035
- 9.9.2. Global Antisense Oligonucleotide Therapeutics Market for Monotherapies, Till 2035
- 9.10. Global Antisense Oligonucleotide Market, Till 2035: Geographical Distribution
- 9.10.1. Antisense Oligonucleotide Market in the US, Till 2035
- 9.10.2. Antisense Oligonucleotide Market in Canada, Till 2035
- 9.10.3. Antisense Oligonucleotide Market in the UK, Till 2035
- 9.10.4. Antisense Oligonucleotide Market in Germany, Till 2035
- 9.10.5. Antisense Oligonucleotide Market in France, Till 2035
- 9.10.6. Antisense Oligonucleotide Market in Italy, Till 2035
- 9.10.7. Antisense Oligonucleotide Market in Spain, Till 2035
- 9.10.8. Antisense Oligonucleotide Market in Australia, Till 2035
- 9.10.9. Antisense Oligonucleotide Market in Japan, Till 2035
- 9.10.10. Antisense Oligonucleotide Market in Korea, Till 2035
- 9.10.11. Antisense Oligonucleotide Market in Brazil, Till 2035
- 9.10.12. Antisense Oligonucleotide Market in Israel, Till 2035
10. CASE STUDY: OLIGONUCLEOTIDE MANUFACTURERS AND PURIFICATION SERVICES
- 10.1. Chapter Overview
- 10.2. List of Oligonucleotide Manufacturers Focused on Research and Diagnostic Applications
- 10.2.1. Analysis by Year of Establishment
- 10.2.2. Analysis by Company Size
- 10.2.3. Analysis by Scale of Operation
- 10.2.4. Analysis by Location of Headquarters
- 10.2.5. Analysis by Type of Purification Method Used
- 10.3. List of Oligonucleotide Manufacturers Focused on Therapeutic Applications
- 10.3.1. Analysis by Year of Establishment
- 10.3.2. Analysis by Company Size
- 10.3.3. Analysis by Scale of Operation
- 10.3.4. Analysis by Location of Headquarters
- 10.3.5. Analysis by Type of Purification Method Used
11. CONCLUDING REMARKS
12. APPENDIX 1: TABULATED DATA
13. APPENDIX 2: LIST OF COMPANIES AND ORGANIZATIONS
List of Tables
- Table 4.1 Antisense Oligonucleotide Therapeutics: List of Drugs
- Table 4.2 Antisense Oligonucleotide Therapeutics: List of Developers
- Table 5.1 Antisense Oligonucleotide Therapeutics: List of Companies Profiled
- Table 5.2 Antisense Therapeutics: Company Snapshot
- Table 5.3 Drug Profile: ATL1102
- Table 5.4 Drug Profile: ATL1103
- Table 5.5 Antisense Therapeutics: Recent Developments and Future Outlook
- Table 5.6 Biogen: Company Snapshot
- Table 5.7 Drug Profile: Tofersen
- Table 5.8 Drug Profile: ION541
- Table 5.9 Biogen: Recent Developments and Future Outlook
- Table 5.10 Bio-Path Holdings: Company Snapshot
- Table 5.11 Drug Profile: Prexigebersen
- Table 5.12 Drug Profile: BP1002
- Table 5.13 Drug Profile: BP1003
- Table 5.14 Bio-Path Holdings: Recent Developments and Future Outlook
- Table 5.15 Ionis Pharmaceuticals: Company Snapshot
- Table 5.16 Drug Profile: Spinraza(R)
- Table 5.17 Drug Profile: Tegsedi(R)
- Table 5.18 Drug Profile: Waylivra(R)
- Table 5.19 Drug Profile: AKCEA-APOCIII-LRx
- Table 5.20 Drug Profile: IONIS-PKK-LRx
- Table 5.21 Drug Profile: IONIS-PKK-Rx
- Table 5.22 Drug Profile: IONIS-ENAC-2.5Rx
- Table 5.23 Drug Profile: IONIS-FB-LRx
- Table 5.24 Drug Profile: IONIS-AGT-LRx
- Table 5.25 Drug Profile: AKCEA-TTR-LRx
- Table 5.26 Drug Profile: IONIS-GHR-LRx
- Table 5.27 Drug Profile: ION253
- Table 5.28 Drug Profile: IONIS-TMPRSS6-LRx
- Table 5.29 Drug Profile: ION736
- Table 5.30 Drug Profile: IONIS-AR-2.5Rx
- Table 5.31 Drug Profile: ION224
- Table 5.32 Drug Profile: ISIS-FGFR4RX
- Table 5.33 Drug Profile: ISIS-GCCRRx
- Table 5.34 Drug Profile: IONIS-GCGRRx
- Table 5.35 Drug Profile: IONIS-HBV-LRx
- Table 5.36 Drug Profile: ION251
- Table 5.37 Drug Profile: ION 449
- Table 5.38 Drug Profile: BIIB078
- Table 5.39 Drug Profile: BIIB094
- Table 5.40 Drug Profile: BIIB101
- Table 5.41 Drug Profile: ISIS-EIF4ERx
- Table 5.42 Drug Profile: BIIB080
- Table 5.43 Drug Profile: ION663
- Table 5.44 Drug Profile: ION674
- Table 5.45 Drug Profile: ION537
- Table 5.46 Drug Profile: ION929
- Table 5.47 Drug Profile: ION363
- Table 5.48 Drug Profile: ION373
- Table 5.49 Drug Profile: ION283
- Table 5.50 Drug Profile: ION260
- Table 5.51 Drug Profile: ION581
- Table 5.52 Drug Profile: ION716
- Table 5.53 Drug Profile: ION904
- Table 5.54 Drug Profile: ION547
- Table 5.55 Ionis Pharmaceuticals: Recent Developments and Future Outlook
- Table 5.56 ProQR Therapeutics: Company Snapshot
- Table 5.57 Drug Profile: Sepofarsen
- Table 5.58 Drug Profile: QR-421a
- Table 5.59 Drug Profile: QR-1123
- Table 5.60 Drug Profile: QR-411
- Table 5.61 Drug Profile: QR-504a
- Table 5.62 Drug Profile: QRX-704
- Table 5.63 Drug Profile: QR-1011
- Table 5.64 Drug Profile: QRX-461
- Table 5.65 Drug Profile: QRX-136
- Table 5.66 Drug Profile: QRX-1204
- Table 5.67 ProQR Therapeutics: Recent Developments and Future Outlook
- Table 5.68 Sarepta Therapeutics: Company Snapshot
- Table 5.69 Drug Profile: Exondys 51
- Table 5.70 Drug Profile: Vyondys 53
- Table 5.71 Drug Profile: Amondys 45
- Table 5.72 Drug Profile: SRP-5051
- Table 5.73 Drug Profile: Exon 52
- Table 5.74 Drug Profile: Exon 43
- Table 5.75 Drug Profile: Exon 44
- Table 5.76 Drug Profile: Exon 50
- Table 5.77 Drug Profile: Exon 55
- Table 5.78 Drug Profile: SRP-5052
- Table 5.79 Drug Profile: SRP-5053
- Table 5.80 Drug Profile: SRP-5044
- Table 5.81 Drug Profile: SRP-5045
- Table 5.82 Drug Profile: SRP-5050
- Table 5.83 Sarepta Therapeutics: Recent Developments and Future Outlook
- Table 5.84 Sterna Biologicals: Company Snapshot
- Table 5.85 Drug Profile: SB010
- Table 5.86 Drug Profile: SB011
- Table 5.87 Drug Profile: SB012
- Table 5.88 Sterna Biologicals: Recent Developments and Future Outlook
- Table 5.89 Wave Life Sciences: Company Snapshot
- Table 5.90 Drug Profile: WVE-120102
- Table 5.91 Drug Profile: Suvodirsen
- Table 5.92 Drug Profile: WVE-004
- Table 5.93 Drug Profile: WVE-003
- Table 5.94 Drug Profile: WVE-N531
- Table 5.95 Drug Profile: Undisclosed Drug 1
- Table 5.96 Drug Profile: Undisclosed Drug 2
- Table 5.97 Drug Profile: Undisclosed Drug 3
- Table 5.98 Drug Profile: Undisclosed Drug 4
- Table 5.99 Drug Profile: Undisclosed Drug 5
- Table 5.100 Drug Profile: Undisclosed Drug 6
- Table 5.101 Wave Life Sciences: Recent Developments and Future Outlook
- Table 8.1 Antisense Oligonucleotide Therapeutics: List of Partnerships and Collaborations
- Table 9.1 Antisense Oligonucleotide Therapeutics: Summary of the Competitive Insights
- Table 10.1 Oligonucleotide Manufacturers Focused on Research and Diagnostic Applications: List of Industry Players
- Table 10.2 Oligonucleotide Manufacturers Focused on Therapeutic Applications: List of Industry Players
- Table 12.1 Antisense Oligonucleotide Therapeutics: Distribution by Type of Antisense Molecule
- Table 12.2 Antisense Oligonucleotide Therapeutics: Distribution by ASO Generation
- Table 12.3 Antisense Oligonucleotide Therapeutics: Distribution by Phase of Development
- Table 12.4 Antisense Oligonucleotide Therapeutics: Distribution by Target Genes
- Table 12.5 Antisense Oligonucleotide Therapeutics: Distribution by Target Indications
- Table 12.6 Antisense Oligonucleotide Therapeutics: Distribution by Therapeutic Areas
- Table 12.7 Antisense Oligonucleotide Therapeutics: Distribution by Route of Administration
- Table 12.8 Antisense Oligonucleotide Therapeutics: Distribution by Type of Therapy
- Table 12.9 Antisense Oligonucleotide Therapeutic Developers: Distribution by Year of Establishment
- Table 12.10 Antisense Oligonucleotide Therapeutic Developers: Distribution by Company Size
- Table 12.11 Antisense Oligonucleotide Therapeutic Developers: Distribution by Location of Headquarters
- Table 12.12 Biogen: Annual Revenues, Since 2015 (USD Million)
- Table 12.13 Ionis Pharmaceuticals: Annual Revenues, Since 2015 (USD Million)
- Table 12.14 Sarepta Therapeutics: Annual Revenues, Since 2015 (USD Million)
- Table 12.15 Wave Life Sciences: Annual Revenues, Since 2015 (USD Million)
- Table 12.16 Clinical Trial Analysis: Cumulative Distribution of Trials by Registration Year
- Table 12.17 Clinical Trial Analysis: Distribution by Trial Phase
- Table 12.18 Clinical Trial Analysis: Distribution by Trial Recruitment Status
- Table 12.19 Clinical Trial Analysis: Distribution by Trial Registration Year and Number of Patients Enrolled
- Table 12.20 Clinical Trial Analysis: Distribution by Study Design
- Table 12.21 Clinical Trial Analysis: Distribution by Type of Sponsor / Collaborator
- Table 12.22 Leading Players: Distribution by Number of Registered Trials
- Table 12.23 Clinical Trial Analysis: Distribution by Target Therapeutic Area
- Table 12.24 Clinical Trial Analysis: Distribution by Trial Registration Year and Target Gene
- Table 12.25 Popular Indications: Distribution by Number of Registered Trials
- Table 12.26 Popular Interventions: Distribution by Number of Registered Trials
- Table 12.27 Clinical Trial Analysis: Geographical Distribution by Number of Registered Trials
- Table 12.28 Clinical Trial Analysis: Geographical Distribution by Number of Patients Enrolled
- Table 12.29 Grant Analysis: Cumulative Trend by Year of Grant Award, Since 2017
- Table 12.30 Grant Analysis: Cumulative Distribution by Amount Awarded, Since 2017 (USD Million)
- Table 12.31 Grant Analysis: Distribution by Administering Institute Center
- Table 12.32 Grant Analysis: Distribution by Support Period
- Table 12.33 Grant Analysis: Distribution by Administering Institute Center and Support Period
- Table 12.34 Grant Analysis: Distribution by Type of Grant Application
- Table 12.35 Grant Analysis: Distribution by Purpose of Grant Award
- Table 12.36 Grant Analysis: Distribution by Activity Code
- Table 12.37 Grant Analysis: Distribution by Study Section Involved
- Table 12.38 Grant Analysis: Distribution by Type of Recipient Organization
- Table 12.39 Grant Analysis: Geographical Distribution of Recipient Organizations
- Table 12.40 Popular Therapeutic Areas: Distribution by Number of Grants
- Table 12.41 Popular NIH Departments: Distribution by Number of Grants
- Table 12.42 Prominent Program Officers: Distribution by Number of Grants
- Table 12.43 Popular Recipient Organizations: Distribution by Number of Grants
- Table 12.44 Partnerships and Collaborations: Cumulative Year-wise Trend, Since 2016
- Table 12.45 Partnerships and Collaborations: Distribution by Type of Partnership
- Table 12.46 Partnerships and Collaborations: Distribution by Type of Partnership and Generation of Antisense Molecule Involved
- Table 12.47 Partnerships and Collaborations: Distribution by Type of Partnership and Target Therapeutic Area
- Table 12.48 Partnerships and Collaborations: Distribution by Year of Partnership and Type of Partner
- Table 12.49 Partnerships and Collaborations: Distribution by Type of Partnership and Type of Partner
- Table 12.50 Most Active Players: Distribution by Number of Partnerships
- Table 12.51 Partnerships and Collaborations: Regional Distribution
- Table 12.52 Global Antisense Oligonucleotide Therapeutics Market, Till 2035 (USD Million)
- Table 12.53 Alicaforsen: Sales Forecast, Till 2035 (USD Million)
- Table 12.54 Eteplirsen: Sales Forecast, Till 2035 (USD Million)
- Table 12.55 Golodirsen: Sales Forecast, Till 2035 (USD Million)
- Table 12.56 Inotersen: Sales Forecast, Till 2035 (USD Million)
- Table 12.57 Sepofarsen: Sales Forecast, Till 2035 (USD Million)
- Table 12.58 Tofersen: Sales Forecast, Till 2035 (USD Million)
- Table 12.59 Tominersen: Sales Forecast, Till 2035 (USD Million)
- Table 12.60 Viltolarsen: Sales Forecast, Till 2035 (USD Million)
- Table 12.61 Volanesorsen: Sales Forecast, Till 2035 (USD Million)
- Table 12.62 Global Antisense Oligonucleotide Therapeutics Market, Till 2035: Distribution by Type of Antisense Molecule (USD Million)
- Table 12.63 Global Antisense Oligonucleotide Therapeutics Market for RNA Molecules, Till 2035 (USD Million)
- Table 12.64 Global Antisense Oligonucleotide Therapeutics Market for DNA Molecules, Till 2035 (USD Million)
- Table 12.65 Global Antisense Oligonucleotide Therapeutics Market, Till 2035: Distribution by ASO Generation (USD Million)
- Table 12.66 Global Antisense Oligonucleotide Therapeutics Market for First-generation Products, Till 2035 (USD Million)
- Table 12.67 Global Antisense Oligonucleotide Therapeutics Market for Second-generation Products, Till 2035 (USD Million)
- Table 12.68 Global Antisense Oligonucleotide Therapeutics Market for Third-generation Products, Till 2035 (USD Million)
- Table 12.69 Global Antisense Oligonucleotide Therapeutics Market, Till 2035: Distribution by Target Disease Indication (USD Million)
- Table 12.70 Global Antisense Oligonucleotide Therapeutics Market for Amyotrophic Lateral Sclerosis, Till 2035 (USD Million)
- Table 12.71 Global Antisense Oligonucleotide Therapeutics Market for Duchenne Muscular Dystrophy, Till 2035 (USD Million)
- Table 12.72 Global Antisense Oligonucleotide Therapeutics Market for Familial Chylomicronemia Syndrome, Till 2035 (USD Million)
- Table 12.73 Global Antisense Oligonucleotide Therapeutics Market for Familial Partial Lipodystrophy, Till 2035 (USD Million)
- Table 12.74 Global Antisense Oligonucleotide Therapeutics Market for Hereditary Transthyretin-Mediated (hATTR) Amyloidosis, Till 2035 (USD Million)
- Table 12.75 Global Antisense Oligonucleotide Therapeutics Market for Huntington's Disease, Till 2035 (USD Million)
- Table 12.76 Global Antisense Oligonucleotide Therapeutics Market for Leber's Congenital Amaurosis, Till 2035 (USD Million)
- Table 12.77 Global Antisense Oligonucleotide Therapeutics Market for Pouchitis, Till 2035 (USD Million)
- Table 12.78 Global Antisense Oligonucleotide Therapeutics Market for Spinal Muscular Atrophy, Till 2035 (USD Million)
- Table 12.79 Global Antisense Oligonucleotide Therapeutics Market, Till 2035: Distribution by Route of Administration (USD Million)
- Table 12.80 Global Antisense Oligonucleotide Therapeutics Market for Intrathecal Therapies, Till 2035 (USD Million)
- Table 12.81 Global Antisense Oligonucleotide Therapeutics Market for Intravenous Therapies, Till 2035 (USD Million)
- Table 12.82 Global Antisense Oligonucleotide Therapeutics Market for Intravitreal Therapies, Till 2035 (USD Million)
- Table 12.83 Global Antisense Oligonucleotide Therapeutics Market for Subcutaneous Therapies, Till 2035 (USD Million)
- Table 12.84 Global Antisense Oligonucleotide Therapeutics Market for Intraorifice Therapies, Till 2035 (USD Million)
- Table 12.85 Global Antisense Oligonucleotide Therapeutics Market, Till 2035: Distribution by Type of Therapy (USD Million)
- Table 12.86 Global Antisense Oligonucleotide Therapeutics Market for Combination Therapies Till 2035 (USD Million)
- Table 12.87 Global Antisense Oligonucleotide Therapeutics Market for Monotherapies, Till 2035 (USD Million)
- Table 12.88 Global Antisense Oligonucleotide Market, Till 2035: Distribution by Geography (USD Million)
- Table 12.89 Antisense Oligonucleotide Market in the US, Till 2035 (USD Million)
- Table 12.90 Antisense Oligonucleotide Market in Canada, Till 2035 (USD Million)
- Table 12.91 Antisense Oligonucleotide Market in the UK, Till 2035 (USD Million)
- Table 12.92 Antisense Oligonucleotide Market in Germany, Till 2035 (USD Million)
- Table 12.93 Antisense Oligonucleotide Market in France, Till 2035 (USD Million)
- Table 12.94 Antisense Oligonucleotide Market in Italy, Till 2035 (USD Million)
- Table 12.95 Antisense Oligonucleotide Market in Spain, Till 2035 (USD Million)
- Table 12.96 Antisense Oligonucleotide Market in Australia, Till 2035 (USD Million)
- Table 12.97 Antisense Oligonucleotide Market in Japan, Till 2035 (USD Million)
- Table 12.98 Antisense Oligonucleotide Market in Korea, Till 2035 (USD Million)
- Table 12.99 Antisense Oligonucleotide Market in Brazil, Till 2035 (USD Million)
- Table 12.100 Antisense Oligonucleotide Market in Israel, Till 2035 (USD Million)
- Table 12.101 Oligonucleotide Manufacturers Focused on Research and Diagnostic Applications: Distribution by Year of Establishment
- Table 12.102 Oligonucleotide Manufacturers Focused on Research and Diagnostic Applications: Distribution by Company Size
- Table 12.103 Oligonucleotide Manufacturers Focused on Research and Diagnostic Applications: Distribution by Scale of Operation
- Table 12.104 Oligonucleotide Manufacturers Focused on Research and Diagnostic Applications: Distribution by Location of Headquarters
- Table 12.105 Oligonucleotide Manufacturers Focused on Research and Diagnostic Applications: Distribution by Type of Purification Method Used
- Table 12.106 Oligonucleotide Manufacturers Focused on Therapeutic Applications: Distribution by Year of Establishment
- Table 12.107 Oligonucleotide Manufacturers Focused on Therapeutic Applications: Distribution by Company Size
- Table 12.108 Oligonucleotide Manufacturers Focused on Therapeutic Applications: Distribution by Scale of Operation
- Table 12.109 Oligonucleotide Manufacturers Focused on Therapeutic Applications: Distribution by Location of Headquarters
- Table 12.110 Oligonucleotide Manufacturers Focused on Therapeutic Applications: Distribution by Type of Purification Method Used
List of Figures
- Figure 3.1 Classification of Oligonucleotides
- Figure 3.2 Key Components of RNA interference
- Figure 3.3 Mechanism of RNA interference
- Figure 3.4 Key Features of Antisense Oligonucleotides
- Figure 3.5 Mechanism of Antisense Oligonucleotides
- Figure 4.1 Antisense Oligonucleotide Therapeutics: Distribution by Type of Antisense Molecule
- Figure 4.2 Antisense Oligonucleotide Therapeutics: Distribution by ASO Generation
- Figure 4.3 Antisense Oligonucleotide Therapeutics: Distribution by Phase of Development
- Figure 4.4 Antisense Oligonucleotide Therapeutics: Distribution by Target Genes
- Figure 4.5 Antisense Oligonucleotide Therapeutics: Distribution by Target Indications
- Figure 4.6 Antisense Oligonucleotide Therapeutics: Distribution by Therapeutic Areas
- Figure 4.7 Antisense Oligonucleotide Therapeutics: Distribution by Route of Administration
- Figure 4.8 Antisense Oligonucleotide Therapeutics: Distribution by Type of Therapy
- Figure 4.9 Antisense Oligonucleotide Therapeutic Developers: Distribution by Year of Establishment
- Figure 4.10 Antisense Oligonucleotide Therapeutic Developers: Distribution by Company Size
- Figure 4.11 Antisense Oligonucleotide Therapeutic Developers: Distribution by Location of Headquarters
- Figure 4.12 Grid Analysis: Distribution by Phase of Development of Therapeutics, Company Size and Location of Headquarters
- Figure 5.1 Biogen: Annual Revenues, Since 2015 (USD Million)
- Figure 5.2 Ionis Pharmaceuticals: Annual Revenues, Since 2015 (USD Million)
- Figure 5.3 Sarepta Therapeutics: Annual Revenues, Since 2015 (USD Million)
- Figure 5.4 Wave Life Sciences: Annual Revenues, Since 2015 (USD Million)
- Figure 6.1 Clinical Trial Analysis: Cumulative Distribution of Trials by Registration Year
- Figure 6.2 Clinical Trial Analysis: Distribution by Trial Phase
- Figure 6.3 Clinical Trial Analysis: Distribution by Trial Recruitment Status
- Figure 6.4 Clinical Trial Analysis: Distribution by Trial Registration Year and Number of Patients Enrolled
- Figure 6.5 Clinical Trial Analysis: Distribution by Study Design
- Figure 6.6 Clinical Trial Analysis: Distribution by Type of Sponsor / Collaborator
- Figure 6.7 Leading Players: Distribution by Number of Registered Trials
- Figure 6.8 Word Cloud: Key Focus Areas
- Figure 6.9 Clinical Trial Analysis: Distribution by Target Therapeutic Area
- Figure 6.10 Clinical Trial Analysis: Distribution by Trial Registration Year and Target Gene
- Figure 6.11 Popular Indications: Distribution by Number of Registered Trials
- Figure 6.12 Popular Interventions: Distribution by Number of Registered Trials
- Figure 6.13 Clinical Trial Analysis: Geographical Distribution by Number of Registered Trials
- Figure 6.14 Clinical Trial Analysis: Geographical Distribution by Number of Patients Enrolled
- Figure 7.1 Grant Analysis: Cumulative Trend by Year of Grant Award, Since 2017
- Figure 7.2 Grant Analysis: Cumulative Distribution by Amount Awarded (USD Million), Since 2017
- Figure 7.3 Grant Analysis: Distribution by Administering Institute Center
- Figure 7.4 Grant Analysis: Distribution by Support Period
- Figure 7.5 Grant Analysis: Distribution by Administering Institute Center and Support Period
- Figure 7.6 Grant Analysis: Distribution by Type of Grant Application
- Figure 7.7 Grant Analysis: Distribution by Purpose of Grant Award
- Figure 7.8 Grant Analysis: Distribution by Activity Code
- Figure 7.9 Grant Analysis: Distribution by Study Section Involved
- Figure 7.10 Grant Analysis: Distribution by Type of Recipient Organization
- Figure 7.11 Word Cloud Analysis: Emerging Focus Areas
- Figure 7.12 Grant Analysis: Geographical Distribution of Recipient Organizations
- Figure 7.13 Popular Therapeutic Areas: Distribution by Number of Grants
- Figure 7.14 Popular NIH Departments: Distribution by Number of Grants
- Figure 7.15 Prominent Program Officers: Distribution by Number of Grants
- Figure 7.16 Popular Recipient Organizations: Distribution by Number of Grants
- Figure 8.1 Partnerships and Collaborations: Cumulative Year-wise Trend, Since 2016
- Figure 8.2 Partnerships and Collaborations: Distribution by Type of Partnership
- Figure 8.3 Partnerships and Collaborations: Distribution by Type of Partnership and Generation of Antisense Molecule Involved
- Figure 8.4 Partnerships and Collaborations: Distribution by Type of Partnership and Target Therapeutic Area
- Figure 8.5 Partnerships and Collaborations: Distribution by Year of Partnership and Type of Partner
- Figure 8.6 Partnerships and Collaborations: Distribution by Type of Partnership and Type of Partner
- Figure 8.7 Most Active Players: Distribution by Number of Partnerships
- Figure 8.8 Partnerships and Collaborations: Regional Distribution
- Figure 8.9 Partnerships and Collaborations: Intercontinental and Intracontinental Agreements
- Figure 9.1 Global Antisense Oligonucleotide Therapeutics Market, Till 2035 (USD Million)
- Figure 9.2 Alicaforsen: Sales Forecast, Till 2035 (USD Million)
- Figure 9.3 Eteplirsen: Sales Forecast, Till 2035 (USD Million)
- Figure 9.4 Golodirsen: Sales Forecast, Till 2035 (USD Million)
- Figure 9.5 Inotersen: Sales Forecast, Till 2035 (USD Million)
- Figure 9.6 Sepofarsen: Sales Forecast, Till 2035 (USD Million)
- Figure 9.7 Tofersen: Sales Forecast, Till 2035 (USD Million)
- Figure 9.8 Tominersen: Sales Forecast, Till 2035 (USD Million)
- Figure 9.9 Viltolarsen: Sales Forecast, Till 2035 (USD Million)
- Figure 9.10 Volanesorsen: Sales Forecast, Till 2035 (USD Million)
- Figure 9.11 Global Antisense Oligonucleotide Therapeutics Market, Till 2035: Distribution by Type of Antisense Molecule (USD Million)
- Figure 9.12 Global Antisense Oligonucleotide Therapeutics Market for RNA Molecules, Till 2035 (USD Million)
- Figure 9.13 Global Antisense Oligonucleotide Therapeutics Market for DNA Molecules, Till 2035 (USD Million)
- Figure 9.14 Global Antisense Oligonucleotide Therapeutics Market, Till 2035: Distribution by ASO Generation (USD Million)
- Figure 9.15 Global Antisense Oligonucleotide Therapeutics Market for First-generation Products, Till 2035 (USD Million)
- Figure 9.16 Global Antisense Oligonucleotide Therapeutics Market for Second-generation Products, Till 2035 (USD Million)
- Figure 9.17 Global Antisense Oligonucleotide Therapeutics Market for Third-generation Products, Till 2035 (USD Million)
- Figure 9.18 Global Antisense Oligonucleotide Therapeutics Market, Till 2035: Distribution by Target Disease Indication (USD Million)
- Figure 9.19 Global Antisense Oligonucleotide Therapeutics Market for Amyotrophic Lateral Sclerosis, Till 2035 (USD Million)
- Figure 9.20 Global Antisense Oligonucleotide Therapeutics Market for Duchenne Muscular Dystrophy, Till 2035 (USD Million)
- Figure 9.21 Global Antisense Oligonucleotide Therapeutics Market for Familial Chylomicronemia Syndrome, Till 2035 (USD Million)
- Figure 9.22 Global Antisense Oligonucleotide Therapeutics Market for Familial Partial Lipodystrophy, Till 2035 (USD Million)
- Figure 9.23 Global Antisense Oligonucleotide Therapeutics Market for Hereditary Transthyretin-Mediated (hATTR) Amyloidosis, Till 2035 (USD Million)
- Figure 9.24 Global Antisense Oligonucleotide Therapeutics Market for Huntington's Disease, Till 2035 (USD Million)
- Figure 9.25 Global Antisense Oligonucleotide Therapeutics Market for Leber's Congenital Amaurosis, Till 2035 (USD Million)
- Figure 9.26 Global Antisense Oligonucleotide Therapeutics Market for Pouchitis, Till 2035 (USD Million)
- Figure 9.27 Global Antisense Oligonucleotide Therapeutics Market for Spinal Muscular Atrophy, Till 2035 (USD Million)
- Figure 9.28 Global Antisense Oligonucleotide Therapeutics Market, Till 2035: Distribution by Route of Administration (USD Million)
- Figure 9.29 Global Antisense Oligonucleotide Therapeutics Market for Intrathecal Therapies, Till 2035 (USD Million)
- Figure 9.30 Global Antisense Oligonucleotide Therapeutics Market for Intravenous Therapies, Till 2035 (USD Million)
- Figure 9.31 Global Antisense Oligonucleotide Therapeutics Market for Intravitreal Therapies, Till 2035 (USD Million)
- Figure 9.32 Global Antisense Oligonucleotide Therapeutics Market for Subcutaneous Therapies, Till 2035 (USD Million)
- Figure 9.33 Global Antisense Oligonucleotide Therapeutics Market for Intraorifice Therapies, Till 2035 (USD Million)
- Figure 9.34 Global Antisense Oligonucleotide Therapeutics Market, Till 2035: Distribution by Type of Therapy (USD Million)
- Figure 9.35 Global Antisense Oligonucleotide Therapeutics Market for Combination Therapies Till 2035 (USD Million)
- Figure 9.36 Global Antisense Oligonucleotide Therapeutics Market for Monotherapies, Till 2035 (USD Million)
- Figure 9.37 Global Antisense Oligonucleotide Market, Till 2035: Distribution by Geography (USD Million)
- Figure 9.38 Antisense Oligonucleotide Market in the US, Till 2035 (USD Million)
- Figure 9.39 Antisense Oligonucleotide Market in Canada, Till 2035 (USD Million)
- Figure 9.40 Antisense Oligonucleotide Market in the UK, Till 2035 (USD Million)
- Figure 9.41 Antisense Oligonucleotide Market in Germany, Till 2035 (USD Million)
- Figure 9.42 Antisense Oligonucleotide Market in France, Till 2035 (USD Million)
- Figure 9.43 Antisense Oligonucleotide Market in Italy, Till 2035 (USD Million)
- Figure 9.44 Antisense Oligonucleotide Market in Spain, Till 2035 (USD Million)
- Figure 9.45 Antisense Oligonucleotide Market in Australia, Till 2035 (USD Million)
- Figure 9.46 Antisense Oligonucleotide Market in Japan, Till 2035 (USD Million)
- Figure 9.47 Antisense Oligonucleotide Market in Korea, Till 2035 (USD Million)
- Figure 9.48 Antisense Oligonucleotide Market in Brazil, Till 2035 (USD Million)
- Figure 9.49 Antisense Oligonucleotide Market in Israel, Till 2035 (USD Million)
- Figure 10.1 Oligonucleotide Manufacturers Focused on Research and Diagnostic Applications: Distribution by Year of Establishment
- Figure 10.2 Oligonucleotide Manufacturers Focused on Research and Diagnostic Applications: Distribution by Company Size
- Figure 10.3 Oligonucleotide Manufacturers Focused on Research and Diagnostic Applications: Distribution by Scale of Operation
- Figure 10.4 Oligonucleotide Manufacturers Focused on Research and Diagnostic Applications: Distribution by Location of Headquarters
- Figure 10.5 Oligonucleotide Manufacturers Focused on Research and Diagnostic Applications: Distribution by Type of Purification Method Used
- Figure 10.6 Oligonucleotide Manufacturers Focused on Therapeutic Applications: Distribution by Year of Establishment
- Figure 10.7 Oligonucleotide Manufacturers Focused on Therapeutic Applications: Distribution by Company Size
- Figure 10.8 Oligonucleotide Manufacturers Focused on Therapeutic Applications: Distribution by Scale of Operation
- Figure 10.9 Oligonucleotide Manufacturers Focused on Therapeutic Applications: Distribution by Location of Headquarters
- Figure 10.10 Oligonucleotide Manufacturers Focused on Therapeutic Applications: Distribution by Type of Purification Method Used

