


 |
市場調查報告書
商品編碼
1723661
虛擬切片檢查市場:對象各治療領域,對象癌症類別,成像技術類別,各終端用戶,各地區,各主要企業:2035年為止的產業趨勢與全球預測Virtual Biopsy Market by Target Therapeutic Area, Type of Cancer Targeted, Type of Imaging Technology, End Users, Geographical Regions and Leading Players: Industry Trends and Global Forecasts, till 2035 |
||||||
虛擬切片市場
2019 年虛擬切片市場價值為 5.3 億美元。預計在預測期內,該市場將以 14.47% 的複合年增長率成長,從目前的 7.8 億美元增至 2035 年的 30.2 億美元。
虛擬切片市場機會分佈在以下領域:
對象治療領域
- 腫瘤學的疾病
- 神經疾病
- 心血管疾病
- 眼科疾病
- 內分泌疾病
- 消化器官疾病
- 其他
對象癌症類型
- 固體癌
- 乳癌
- 肺癌症
- 前列腺癌症
- 大腸癌症
- 腦瘤
- 其他
成像技術類型
- 核磁共振影像
- 電腦斷層攝影
- X光
- 超音波
- 其他
終端用戶
- 磁共振成像
- 電腦斷層攝影
- X光
- 超音波
- 其他
地區
- 北美(美國,加拿大)
- 歐洲(德國,法國,義大利,英國,西班牙,瑞士,其他)
- 亞太地區(中國,日本,印度,韓國,澳洲,其他)
- 中東·北非地區(沙烏地阿拉伯,以色列,埃及,其他)
- 南美(巴西,墨西哥,阿根廷,其他)
虛擬切片市場:成長與趨勢
多年來,醫護人員一直使用傳統的活檢技術透過手術採集病患樣整體分析病情。然而,這些方法通常會導致一些併發症,包括感染、切口後出血和患者不適。此外,由於樣本採集、手術介入和手術室維護等相關費用,傳統的活檢技術通常成本高昂。
根據印度醫學研究理事會 (ICMR) 的估計,癌症發生率預計將從 2022 年的 140 萬增至 2025 年的 150 萬。因此,醫療保健專業人員對更安全、更有效的替代方案的需求日益增長,以加強疾病檢測和患者護理。
為了滿足日益增長的需求並減輕與傳統手術相關的健康問題,虛擬活檢技術作為一種非侵入性疾病檢測和預後工具正日益普及。這項創新技術具有多種優勢,包括降低風險和改善病患篩檢流程。此外,虛擬活檢利用先進的人工智慧 (AI) 軟體對提取樣本的影像進行詳細分析,從而深入了解患者的病情。此外,這種方法在評估治療期間的藥物反應方面發揮關鍵作用,同時降低了與外科手術相關的風險,使其成為製定治療計劃的重要工具。
在虛擬活檢技術進步和對有效患者護理管理日益增長的需求的推動下,虛擬活檢設備的採用正在穩步增長,預計這將使醫療保健領域的早期檢測和常規診斷成為可能。
虛擬切片市場:關鍵洞察
本報告深入探討了虛擬活檢市場的現狀,並識別了行業內的潛在成長機會。報告的主要發現包括:
- 目前,全球各地的各種參與者正在開發約 45 種虛擬活檢設備,其中 65% 的設備創新由總部位於已開發地區的小型企業主導。
- 磁振造影 (33%) 已成為最廣泛採用的影像擷取技術,因為它使用安全的磁場和無線電波來擷取資料。
- 近 50% 的交易是在過去兩年內達成的,這表明在此期間合作活動顯著增加。
- 鑑於虛擬活檢技術在改善醫療保健結果方面的諸多優勢,許多投資者正在為相關公司提供資金支持,自 2020 年以來,該領域的投資已超過 4.25 億美元。
- 各行業和非行業參與者已申請/授予約 85 項與虛擬活檢相關的專利,以保護該領域產生的智慧財產權。
- 已有超過 65 篇科學家提交的論文,重點在於有助於開發高效醫療保健工具的最新技術趨勢。
- 虛擬活檢市場的發展受到人們對更安全、更有效率的傳統活檢程序替代方案日益增長的需求的推動,然而,複雜的監管規範仍然是行業發展的障礙。
- 預計到 2035 年,虛擬活檢相關的市場機會將以每年 14.47% 的速度增長,這主要得益於對非侵入性和更安全診斷工具日益增長的需求。
- 預期整體市場機會將均衡分佈於各類影像技術和最終用戶。
虛擬切片市場:關鍵細分市場
全球虛擬切片市場根據目標治療領域細分為腫瘤科、神經系統疾病、心血管疾病、眼科、內分泌疾病、胃腸道疾病等。目前,腫瘤科疾病佔據虛擬活檢市場的大部分佔有率,這是由於醫生越來越傾向於使用虛擬活檢設備等非侵入式設備進行癌症診斷。這些設備利用 CT(電腦斷層掃描)和 MRI(磁振造影)等先進技術進行影像擷取和數據分析,滿足了日益增長的需求。
根據目標癌症類型,全球虛擬切片市場涵蓋實體惡性腫瘤、乳癌、肺癌、攝護腺癌、大腸癌、腦腫瘤等。目前,實體惡性腫瘤領域預計將佔據主導地位並推動整體市場成長。這是因為實體癌症約佔成人癌症確診病例的 90%,這促使對能夠有效診斷此類疾病的先進診斷設備的需求不斷增長。
根據影像技術類型,全球虛擬切片市場細分為磁振造影、電腦斷層掃描、X 光、超音波等。具體而言,磁振造影 (MRI) 技術帶來的許多優勢,包括對樣本進行 360 度全方位視圖,使得對病患病情的分析變得輕鬆有效,因此,MRI 技術很可能在預測期內佔據虛擬活檢市場的主導地位。
根據最終用戶,全球市場細分為醫院和診所、研究機構和診斷中心以及其他領域。目前,醫院和診所佔據最大的市場佔有率。這是因為醫院和診所對虛擬活檢設備的需求不斷增長,用於對各種健康狀況進行篩檢、診斷和預測。
根據地區,市場細分為北美、歐洲、亞太地區、拉丁美洲以及中東和北非。在當前情況下,北美可能佔據最大的市場佔有率。這是因為該地區醫療保健領域的研發活動投入了大量預算。然而,拉丁美洲虛擬活檢市場預計在預測期內的複合年增長率將更高。
報告中解答的關鍵問題
- 目前有多少家公司進入該市場?
- 該市場的主要公司
- 可能影響該市場發展的因素
- 當前與未來的市場規模
- 該市場的複合年增長率
- 當前和未來的市場機會如何在主要細分市場中分配?
- 產業利害關係人通常採用哪些合作模式?
- 當前的投資趨勢
- 該市場的專利申請趨勢
為什麼要購買此報告?
- 本報告提供全面的市場分析,並針對整體市場和特定細分市場提供詳細的收入預測。這些資訊對於現有的市場領導者和新進入者都極具價值。
- 利害關係人可以利用該報告深入了解市場競爭動態。分析競爭格局有助於企業做出明智的決策,優化市場定位並制定有效的市場進入策略。
- 該報告為利害關係人提供了全面的市場概覽,包括關鍵推動因素、阻礙因素和挑戰。這些資訊使利害關係人能夠掌握市場趨勢,並做出基於數據的決策,從而掌握成長前景。
其他的優惠
- PPT 洞察包
- 報告所有分析模組可免費取得 Excel 資料包
- 10% 免費內容客製化
- 由我們的研究團隊提供詳細的報告講解
- 如果報告發佈時間超過 6-12 個月,可免費更新報告
本報告提供全球虛擬切片檢查市場相關調查,提供市場概要,以及對象各治療領域,對象癌症類別,成像技術類別,各終端用戶,各地區,各主要企業趨勢,及加入此市場的主要企業簡介等資訊。
目錄
第1章 序文
第2章 調查手法
第3章 市場動態
第4章 宏觀經濟指標
第5章 摘要整理
第6章 簡介
- 章概要
- 虛擬切片檢查概要
- 傳統的切片檢查和虛擬切片檢查
- 虛擬切片檢查的實施次序
- 虛擬切片檢查的應用
- 虛擬切片檢查伴隨的課題
- 未來展望
第7章 市場形勢
- 章概要
- 虛擬切片設備:市場形勢
- 虛擬切片設備:開發商的形勢
第8章 產品競爭力分析
- 章概要
- 前提主要的參數
- 調查手法
- 產品競爭力分析:虛擬切片設備
第9章 企業簡介:北美為據點的開發業者
- 章概要
- GE HealthCare
- Imaging Biometrics
- OptoVibronex
第10章 企業簡介:歐洲為據點的開發業者
- 章概要
- ImageBiopsy Lab
- Median Technologies
- Quibim
- Siemens Healthineers
第11章 企業簡介:亞太地區的虛擬切片檢查供應商
- 章概要
- City Imaging and Clinical Labs
第12章 夥伴關係和合作
第13章 資金籌措與投資
- 章概要
- 資金籌措模式
- 虛擬切片檢查:資金籌措與投資
- 結論
第14章 專利分析
第15章 出版物的分析
第16章 市場影響分析
- 章概要
- 市場促進因素
- 市場阻礙因素
- 市場機會
- 市場課題
- 結論
第17章 虛擬切片檢查市場
第18章 虛擬切片檢查市場(對象各治療領域)
第19章 虛擬切片檢查市場(對象癌症類別)
第20章 虛擬切片檢查市場(成像技術類別)
第21章 虛擬切片檢查市場(各終端用戶)
第22章 虛擬切片檢查市場(各地區)
第23章 虛擬切片檢查市場(各主要企業)
第24章 結論
第25章 執行洞察
第26章 附錄I:表格形式資料
第27章 附錄II:企業及組織的一覽
VIRTUAL BIOPSY MARKET
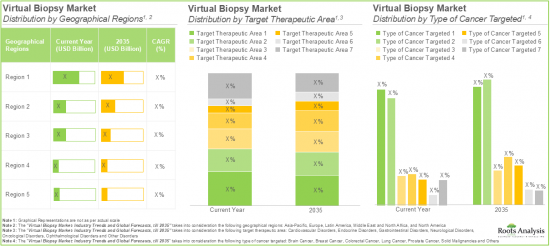
As per Roots Analysis, the virtual biopsy market, valued at USD 0.53 billion in 2019, is projected to reach USD 0.78 billion in current year and USD 3.02 billion by 2035, representing a CAGR of 14.47% during the forecast period.
The opportunity for virtual biopsy market has been distributed across the following segments:
Target Therapeutic Area
- Oncological Disorders
- Neurological Disorders
- Cardiovascular Disorders
- Ophthalmological Disorders
- Endocrine Disorders
- Gastrointestinal Disorders
- Others
Type of Cancer Targeted
- Solid Malignancies
- Breast Cancer
- Lung Cancer
- Prostate Cancer
- Colorectal Cancer
- Brain Cancer
- Others
Type of Imaging Technology
- Magnetic Resonance Imaging
- Computed Tomography
- X-ray
- Ultrasound
- Others
End Users
- Magnetic Resonance Imaging
- Computed Tomography
- X-ray
- Ultrasound
- Others
Geographical Regions
- North America (US and Canada)
- Europe (Germany, France, Italy, UK, Spain, Switzerland and Rest of Europe)
- Asia-Pacific (China, Japan, India, South Korea, Australia and Rest of Asia-Pacific)
- Middle East and North Africa (Saudi Arabia, Israel, Egypt, and Rest of Middle East and North Africa)
- Latin America (Brazil, Mexico, Argentina and Rest of Latin America)
VIRTUAL BIOPSY MARKET: GROWTH AND TRENDS
Over the years, healthcare professionals have been using conventional biopsy techniques for extracting patient samples surgically in order to analyze their condition. However, these methods are often associated with several complications, such as infections, hemorrhage after incision, and patient discomfort. In addition, conventional biopsy techniques are often cost intensive, with expenses related to sample collection, surgical interventions and operating room maintenance.
Based on estimates by the Indian Council of Medical Research (ICMR), the incidence of cancer cases is expected to increase from 1.4 million in 2022 to 1.5 million by 2025. As a result, the demand for safer and more efficient alternatives is increasing among medical professionals to enhance disease detection and patient care.
In order to meet the growing demand and mitigate the health concerns associated with the convention procedures, the virtual biopsy technique has gained traction as a non-invasive tool for disease detection and prognosis. This innovative technique provides various benefits, including reduced risks and the improved patient screening process. Further, virtual biopsy offers in-depth insights into patients' conditions by utilizing advanced artificial intelligence (AI) software that analyzes images from extracted samples in detail. Additionally, this approach plays a critical role in evaluating drug responses during treatment while mitigating the risks associated with surgical procedures, making it an essential tool for planning treatment.
Driven by the technological advancements in virtual biopsy techniques and the rising demand for effective patient care management, the adoption of virtual biopsy devices is steadily increasing and is anticipated to enable early detection and routine diagnostics in the healthcare sector.
VIRTUAL BIOPSY MARKET: KEY INSIGHTS
The report delves into the current state of the virtual biopsy market and identifies potential growth opportunities within the industry. Some key findings from the report include:
- Presently, about 45 virtual biopsy devices are being developed by various players worldwide; the innovation for 65% of these devices is being led by small players headquartered in developed regions.
- Magnetic resonance imaging (33%) has emerged as the most widely employed technology for image acquisition purposes, owing to the fact that it uses safe magnetic and radio waves for capturing data.
- Close to 50% of the deals have been inked in the last two years, demonstrating a considerable increase in partnership activity during this period; of these, more than 65% of the partnerships were international deals.
- Given the various benefits of virtual biopsy techniques in improving healthcare outcomes, a significant number of investors have provided financial support to the companies; over USD 425 million has been invested since 2020.
- Around 85 patents related to virtual biopsy have been filed / granted by various industry and non-industry players to protect the intellectual property generated within this field.
- More than 65 publications have been filed by scientists, focusing on recent technological advancements that contribute to the development of efficient healthcare tools.
- The virtual biopsy market is driven by an increase in the demand for safer and more efficient alternatives to conventional biopsy procedures; however, complex regulatory norms continue to pose a barrier to the industry growth.
- The market opportunity associated with virtual biopsy is likely to witness an annualized growth rate of 14.47% till 2035, owing to the growing demand for non-invasive and safer diagnostic tools.
- The overall opportunity is expected to be well distributed across different types of imaging technologies and end users.
VIRTUAL BIOPSY MARKET: KEY SEGMENTS
Oncological Disorder Segment is Likely to Dominate the Virtual Biopsy Market During the Forecast Period
Based on the target therapeutic area, the global market for virtual biopsy is segmented into oncological disorders, neurological disorders, cardiovascular disorders, ophthalmological disorders, endocrine disorders, gastrointestinal disorders and others. Currently, the majority share of the virtual biopsy market is captured by oncological disorders driven by the growing preference of physicians for non-invasive devices, such as virtual biopsy devices in cancer diagnosis. These devices meet this rising demand by using advanced technologies, such as computed tomography and magnetic resonance imaging for image capturing and analyzing the data.
Solid Malignancies Segment is Likely to Hold the Largest Share of the Virtual Biopsy Market During the Forecast Period
Based on the type of cancer targeted, the global virtual biopsy market is distributed across solid malignancies, breast cancer, lung cancer, prostate cancer, colorectal cancer, brain cancer and others. Currently, the solid malignancies segment is likely to dominate and drive the overall market growth. This can be attributed to the fact that solid tumors account for around 90% of all the adult cancer cases diagnosed, which results in increased demand for advanced diagnostic devices that can effectively diagnose such disorders.
By Type of Imaging Technology, Virtual Biopsy Devices Utilizing Magnetic Resonance Imaging Technology are Likely to Dominate the Market During the Forecast Period
Based on the type of imaging technology, the global virtual biopsy market is segmented across magnetic resonance imaging, computed tomography, X-ray, ultrasound and others. Notably, owing to the various advantages offered by magnetic resonance imaging (MRI) technology including a comprehensive 360-degree view of the sample, enabling easy and effective analysis of patient's condition, it is likely to dominate the virtual biopsy market during the forecast period.
Currently, Hospitals and Clinics Segment Holds the Largest Share of the Virtual Biopsy Market
Based on end users, the global market is segmented into hospitals and clinics, research institutions and diagnostic centers, and others. Currently, the hospitals and clinics segment holds the largest market share. This can be attributed to the increased demand for virtual biopsy devices in hospitals and clinics as these devices provide screening, diagnosis, and prognosis for various health conditions in these settings.
North America Accounts for the Largest Share of the Market
Based on geographical regions, the market is segmented into North America, Europe, Asia-Pacific, Latin America and Middle East and North Africa. In the current scenario, North America is likely to capture the largest market share. This can be attributed to the substantial budget amount allotted for research and development activities in the healthcare domain in this region. However, the virtual biopsy market in Latin America is expected to grow at a higher CAGR during the forecast period.
EXAMPLE PLAYERS IN THE VIRTUAL BIOPSY MARKET
- GE Healthcare
- Imaging Biometrics
- OptoVibronex
- ImageBiopsy Lab
- Median Technologies
- Quibim
- Siemens Healthineers
- City Imaging and Clinical Labs
VIRTUAL BIOPSY MARKET: RESEARCH COVERAGE
The report on the virtual biopsy market features insights on various sections, including:
- Market Sizing and Opportunity Analysis: An in-depth analysis of the virtual biopsy market, focusing on key market segments, including [A] target therapeutic area, [B] type of cancer targeted, [C] type of imaging technology, [D] end users, [E] geographical regions and [F] leading players.
- Market Impact Analysis: A thorough analysis of various factors, such as drivers, restraints, opportunities, and existing challenges that are likely to impact market growth.
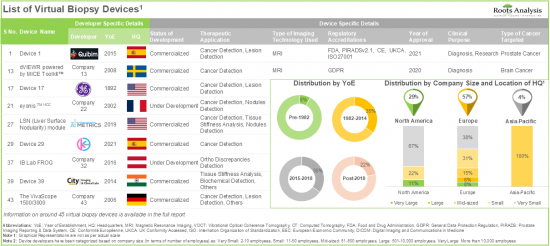
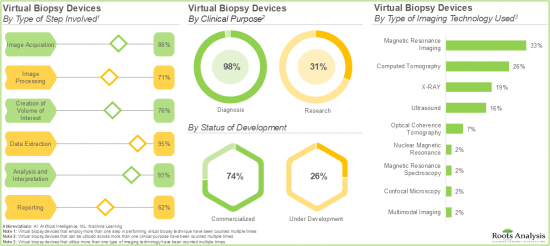
- Virtual Biopsy Devices Market Landscape: A comprehensive evaluation of various virtual biopsy devices, based on several relevant parameters, such as [A] status of development, [B] year of approval, [C] region of approval, [D] regulatory accreditations, [E] type of step involved, [F] clinical purpose, [G] type of imaging technology used, [H] therapeutic application, [I] target therapeutic area, and [J] type of cancer targeted. This section also features a list of players engaged in the development of virtual biopsy devices, along with analyses based on [A] year of establishment, [B] company size, [C] location of headquarters and [D] most active developers.
- Company Profiles: Detailed profiles of companies engaged in developing virtual biopsy devices across various regions, including [A] company overview, [B] financial information (if available), [C] virtual biopsy device portfolio, [D] recent developments and [E] an informed future outlook.
- Product Competitiveness Analysis: An in-depth analyses of virtual biopsy devices, based on various relevant parameters, such as [A] company strength, [B] product portfolio strength and [C] product portfolio diversity.
- Partnerships and Collaborations: An insightful analysis of the deals inked by stakeholders in virtual biopsy domain, based on several parameters, such as [A] year of partnership, [B] type of partnership, [C] type of partner, [D] type of imaging technology used, [E] therapeutic application, [F] most active players, and [G] geographical distribution of partnership activity.
- Funding and Investments: An in-depth analysis of the funding raised by companies engaged in the virtual biopsy domain, based on relevant parameters, such as [A] year of funding, [B] type of funding, [C] amount invested, [D] geographical distribution, [E] most active players and [F] most active investors.
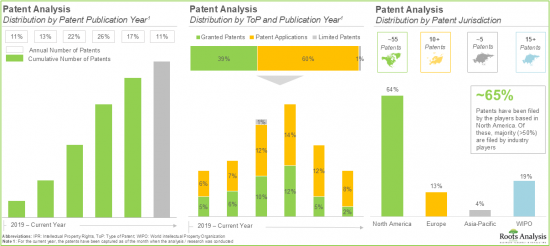
- Patent Analysis: Detailed analysis of patents filed / granted till date in the virtual biopsy domain, based on various relevant parameters, such as [A] type of patent, [B] publication year, [B] application year, [C] CPC symbols, [D] patent jurisdiction, [E] type of applicant, [F] leading industry players, [G] patent benchmarking, [H] patent valuation analysis, and [I] leading patents.
- Publication Analysis: A comprehensive assessment of publications made in the virtual biopsy domain, based on various relevant parameters, such as [A] year of publication, [B] type of publication, [C] key copyright holders, [D] most active publishers, [E] most active publishers (in terms of number of publications and impact factor) and [F] most popular keywords used.
KEY QUESTIONS ANSWERED IN THIS REPORT
- How many companies are currently engaged in this market?
- Which are the leading companies in this market?
- What factors are likely to influence the evolution of this market?
- What is the current and future market size?
- What is the CAGR of this market?
- How is the current and future market opportunity likely to be distributed across key market segments?
- What kind of partnership models are commonly adopted by industry stakeholders?
- What is the ongoing investment trend in this market?
- What is the patent filing activity trend in the market?
REASONS TO BUY THIS REPORT
- The report provides a comprehensive market analysis, offering detailed revenue projections of the overall market and its specific sub-segments. This information is valuable to both established market leaders and emerging entrants.
- Stakeholders can leverage the report to gain a deeper understanding of the competitive dynamics within the market. By analyzing the competitive landscape, businesses can make informed decisions to optimize their market positioning and develop effective go-to-market strategies.
- The report offers stakeholders a comprehensive overview of the market, including key drivers, barriers, opportunities, and challenges. This information empowers stakeholders to stay abreast of market trends and make data-driven decisions to capitalize on growth prospects.
ADDITIONAL BENEFITS
- Complimentary PPT Insights Packs
- Complimentary Excel Data Packs for all Analytical Modules in the Report
- 10% Free Content Customization
- Detailed Report Walkthrough Session with Research Team
- Free Updated report if the report is 6-12 months old or older
TABLE OF CONTENTS
1. PREFACE
- 1.1. Introduction
- 1.2. Market Share Insights
- 1.3. Key Market Insights
- 1.4. Report Coverage
- 1.5. Key Questions Answered
- 1.6. Chapter Outlines
2. RESEARCH METHODOLOGY
- 2.1. Chapter Overview
- 2.2. Research Assumptions
- 2.2.1. Market Landscape and Market Trends
- 2.2.2. Market Forecast and Opportunity Analysis
- 2.2.3. Comparative Analysis
- 2.3. Database Building
- 2.3.1. Data Collection
- 2.3.2. Data Validation
- 2.3.3. Data Analysis
- 2.4. Project Methodology
- 2.4.1. Secondary Research
- 2.4.1.1. Annual Reports
- 2.4.1.2. Academic Research Papers
- 2.4.1.3. Company Websites
- 2.4.1.4. Investor Presentations
- 2.4.1.5. Regulatory Filings
- 2.4.1.6. White Papers
- 2.4.1.7. Industry Publications
- 2.4.1.8. Conferences and Seminars
- 2.4.1.9. Government Portals
- 2.4.1.10. Media and Press Releases
- 2.4.1.11. Newsletters
- 2.4.1.12. Industry Databases
- 2.4.1.13. Roots Proprietary Databases
- 2.4.1.14. Paid Databases and Sources
- 2.4.1.15. Social Media Portals
- 2.4.1.16. Other Secondary Sources
- 2.4.2. Primary Research
- 2.4.2.1. Types of Primary Research
- 2.4.2.1.1. Qualitative Research
- 2.4.2.1.2. Quantitative Research
- 2.4.2.1.3. Hybrid Approach
- 2.4.2.2. Advantages of Primary Research
- 2.4.2.3. Techniques for Primary Research
- 2.4.2.3.1. Interviews
- 2.4.2.3.2. Surveys
- 2.4.2.3.3. Focus Groups
- 2.4.2.3.4. Observational Research
- 2.4.2.3.5. Social Media Interactions
- 2.4.2.4. Key Opinion Leaders Considered in Primary Research
- 2.4.2.4.1. Company Executives (CXOs)
- 2.4.2.4.2. Board of Directors
- 2.4.2.4.3. Company Presidents and Vice Presidents
- 2.4.2.4.4. Research and Development Heads
- 2.4.2.4.5. Technical Experts
- 2.4.2.4.6. Subject Matter Experts
- 2.4.2.4.7. Scientists
- 2.4.2.4.8. Doctors and Other Healthcare Providers
- 2.4.2.5. Ethics and Integrity
- 2.4.2.5.1. Research Ethics
- 2.4.2.5.2. Data Integrity
- 2.4.2.1. Types of Primary Research
- 2.4.3. Analytical Tools and Databases
- 2.4.1. Secondary Research
- 2.5. Robust Quality Control
3. MARKET DYNAMICS
- 3.1. Chapter Overview
- 3.2. Forecast Methodology
- 3.2.1. Top-down Approach
- 3.2.2. Bottom-up Approach
- 3.2.3. Hybrid Approach
- 3.3. Market Assessment Framework
- 3.3.1. Total Addressable Market (TAM)
- 3.3.2. Serviceable Addressable Market (SAM)
- 3.3.3. Serviceable Obtainable Market (SOM)
- 3.3.4. Currently Acquired Market (CAM)
- 3.4. Forecasting Tools and Techniques
- 3.4.1. Qualitative Forecasting
- 3.4.2. Correlation
- 3.4.3. Regression
- 3.4.4. Extrapolation
- 3.4.5. Convergence
- 3.4.6. Sensitivity Analysis
- 3.4.7. Scenario Planning
- 3.4.8. Data Visualization
- 3.4.9. Time Series Analysis
- 3.4.10. Forecast Error Analysis
- 3.5. Key Considerations
- 3.5.1. Demographics
- 3.5.2. Government Regulations
- 3.5.3. Reimbursement Scenarios
- 3.5.4. Market Access
- 3.5.5. Supply Chain
- 3.5.6. Industry Consolidation
- 3.5.7. Pandemic / Unforeseen Disruptions Impact
- 3.6. Limitations
4. MACRO-ECONOMIC INDICATORS
- 4.1. Chapter Overview
- 4.2. Market Dynamics
- 4.2.1. Time Period
- 4.2.1.1. Historical Trends
- 4.2.1.2. Current and Forecasted Estimates
- 4.2.2. Currency Coverage
- 4.2.2.1. Major Currencies Affecting the Market
- 4.2.2.2. Factors Affecting Currency Fluctuations
- 4.2.2.3. Impact of Currency Fluctuations on the Industry
- 4.2.3. Foreign Currency Exchange Rate
- 4.2.3.1. Impact of Foreign Exchange Rate Volatility on the Market
- 4.2.3.2. Strategies for Mitigating Foreign Exchange Risk
- 4.2.4. Recession
- 4.2.4.1. Assessment of Current Economic Conditions and Potential Impact on the Market
- 4.2.4.2. Historical Analysis of Past Recessions and Lessons Learnt
- 4.2.5. Inflation
- 4.2.5.1. Measurement and Analysis of Inflationary Pressures in the Economy
- 4.2.5.2. Potential Impact of Inflation on the Market Evolution
- 4.2.6. Interest Rates
- 4.2.6.1. Interest Rates and Their Impact on the Market
- 4.2.6.2. Strategies for Managing Interest Rate Risk
- 4.2.7. Commodity Flow Analysis
- 4.2.7.1. Type of Commodity
- 4.2.7.2. Origins and Destinations
- 4.2.7.3. Values and Weights
- 4.2.7.4. Modes of Transportation
- 4.2.8. Global Trade Dynamics
- 4.2.8.1. Import Scenario
- 4.2.8.2. Export Scenario
- 4.2.8.3. Trade Policies
- 4.2.8.4. Strategies for Mitigating the Risks Associated with Trade Barriers
- 4.2.8.5. Impact of Trade Barriers on the Market
- 4.2.9. War Impact Analysis
- 4.2.9.1. Russian-Ukraine War
- 4.2.9.2. Israel-Hamas War
- 4.2.10. COVID Impact / Related Factors
- 4.2.10.1. Global Economic Impact
- 4.2.10.2. Industry-specific Impact
- 4.2.10.3. Government Response and Stimulus Measures
- 4.2.10.4. Future Outlook and Adaptation Strategies
- 4.2.11. Other Indicators
- 4.2.11.1. Fiscal Policy
- 4.2.11.2. Consumer Spending
- 4.2.11.3. Gross Domestic Product (GDP)
- 4.2.11.4. Employment
- 4.2.11.5. Taxes
- 4.2.11.6. Stock Market Performance
- 4.2.11.7. Cross-Border Dynamics
- 4.2.1. Time Period
- 4.3. Conclusion
5. EXECUTIVE SUMMARY
6. INTRODUCTION
- 6.1. Chapter Overview
- 6.2. Overview of Virtual Biopsy
- 6.3. Conventional Biopsy Versus Virtual Biopsy
- 6.4. Steps Involved in Performing Virtual Biopsy
- 6.4.1. Acquisition of Data
- 6.4.2. Data Harmonization
- 6.4.3. Division of Data
- 6.4.4. Region of Interests (ROI) Segmentation
- 6.4.5. Extraction and Selection of Image Features
- 6.4.6. Validation of Model
- 6.5. Applications of Virtual Biopsy
- 6.5.1. Cancer Management
- 6.5.2. Other Therapeutic Applications
- 6.6. Challenges Associated with Virtual Biopsy
- 6.7. Future Perspectives
7. MARKET LANDSCAPE
- 7.1. Chapter Overview
- 7.2. Virtual Biopsy Devices: Overall Market Landscape
- 7.2.1. Analysis by Status of Development
- 7.2.2. Analysis by Year of Approval
- 7.2.3. Analysis by Region of Approval
- 7.2.4. Analysis by Regulatory Accreditations
- 7.2.5. Analysis by Type of Step Involved
- 7.2.6. Analysis by Clinical Purpose
- 7.2.7. Analysis by Type of Imaging Technology Used
- 7.2.8. Analysis by Status of Development and Type of Imaging Technology Used
- 7.2.9. Analysis by Therapeutic Application
- 7.2.10. Analysis by Target Therapeutic Area
- 7.2.11. Analysis by Status of Development and Target Therapeutic Area
- 7.2.12. Analysis by Type of Cancer Targeted
- 7.3. Virtual Biopsy Devices: Developer Landscape
- 7.3.1. Analysis by Year of Establishment
- 7.3.2. Analysis by Company Size
- 7.3.3. Analysis by Location of Headquarters (Region)
- 7.3.4. Analysis by Status of Development and Location of Headquarters (Region)
- 7.3.5. Analysis by Location of Headquarters (Country)
- 7.3.6. Analysis by Company Size and Location of Headquarters (Region)
- 7.3.7. Most Active Developers: Analysis by Number of Virtual Biopsy Devices Developed
8. PRODUCT COMPETITIVENESS ANALYSIS
- 8.1. Chapter Overview
- 8.2. Assumptions and Key Parameters
- 8.3. Methodology
- 8.4. Product Competitiveness Analysis: Virtual Biopsy Devices
- 8.4.1. Product Competitiveness Analysis: Virtual Biopsy Devices Developed by Players based in North America
- 8.4.2. Product Competitiveness Analysis: Virtual Biopsy Devices Developed by Players based in Europe and Asia-Pacific
9. COMPANY PROFILES: DEVELOPERS BASED IN NORTH AMERICA
- 9.1. Chapter Overview
- 9.2. GE HealthCare
- 9.2.1. Company Overview
- 9.2.2. Financial Information
- 9.2.3. Virtual Biopsy Device Portfolio
- 9.2.4. Recent Developments and Future Outlook
- 9.3. Imaging Biometrics
- 9.4. OptoVibronex
10. COMPANY PROFILES: DEVELOPERS BASED IN EUROPE
- 10.1. Chapter Overview
- 10.2. ImageBiopsy Lab
- 10.2.1. Company Overview
- 10.2.2. Virtual Biopsy Device Portfolio
- 10.2.3. Recent Developments and Future Outlook
- 10.3. Median Technologies
- 10.4. Quibim
- 10.5. Siemens Healthineers
11. COMPANY PROFILES: VIRTUAL BIOPSY PROVIDERS BASED IN ASIA-PACIFIC
- 11.1. Chapter Overview
- 11.2. City Imaging and Clinical Labs
- 11.2.1. Company Overview
- 11.2.2. Virtual Biopsy Device Portfolio
- 11.2.3. Recent Developments and Future Outlook
12. PARTNERSHIPS AND COLLABORATIONS
- 12.1. Chapter Overview
- 12.2. Partnership Models
- 12.3. Virtual Biopsy: Partnerships and Collaborations
- 12.3.1. Analysis by Year of Partnership
- 12.3.2. Analysis by Type of Partnership
- 12.3.3. Analysis by Year and Type of Partnership
- 12.3.4. Analysis by Type of Partner
- 12.3.5. Analysis by Type of Imaging Technology
- 12.3.6. Analysis by Therapeutic Application
- 12.3.7. Most Active Players: Analysis by Number of Partnerships
- 12.3.8. Analysis by Geography
- 12.3.8.1. Local and International Agreements
- 12.3.8.2. Intracontinental and Intercontinental Agreements
13. FUNDING AND INVESTMENTS
- 13.1. Chapter Overview
- 13.2. Funding Models
- 13.3. Virtual Biopsy: Funding and Investments
- 13.3.1. Analysis by Year of Funding
- 13.3.2. Analysis by Type of Funding
- 13.3.3. Analysis by Year and Type of Funding
- 13.3.4. Analysis by Amount Invested
- 13.3.5. Analysis of Amount Invested by Type of Funding
- 13.3.6. Analysis by Geography
- 13.3.7. Most Active Players: Analysis by Number of Funding Instances
- 13.3.8. Most Active Players: Analysis by Amount Raised
- 13.3.9. Leading Investors: Analysis by Number of Funding Instances
- 13.4. Concluding Remarks
14. PATENT ANALYSIS
- 14.1. Chapter Overview
- 14.2. Scope And Methodology
- 14.3. Virtual Biopsy: Patent Analysis
- 14.3.1. Analysis by Patent Publication Year
- 14.3.2. Analysis by Type of Patent and Publication Year
- 14.3.3. Analysis by Patent Application Year
- 14.3.4. Analysis by Patent Jurisdiction
- 14.3.5. Analysis by CPC Symbols
- 14.3.6. Analysis by Type of Applicant
- 14.3.7. Leading Industry Players: Analysis by Number of Patents
- 14.3.8. Leading Non-Industry Players: Analysis by Number of Patents
- 14.4. Patent Benchmarking Analysis
- 14.4.1. Analysis by Patent Characteristics (CPC Codes) by Leading Industry Players
- 14.5. Patent Valuation
- 14.6. Leading Patents by Number of Citations
15. PUBLICATION ANALYSIS
- 15.1. Chapter Overview
- 15.2. Scope and Methodology
- 15.3. Virtual Biopsy: Publication Analysis
- 15.3.1. Analysis by Year of Publication
- 15.3.2. Analysis by Type of Publication
- 15.3.3. Key Copyright Holders: Analysis by Number of Publications
- 15.3.4. Most Active Publishers: Analysis by Number of Publications
- 15.3.5. Key Journals: Analysis by Number of Publications
- 15.3.6. Key Journals: Analysis by Impact Factor
- 15.3.7. Publication Analysis: Most Popular Keywords
16. MARKET IMPACT ANALYSIS
- 16.1. Chapter Overview
- 16.2. Market Drivers
- 16.3. Market Restraints
- 16.4. Market Opportunities
- 16.5. Market Challenges
- 16.6. Conclusion
17. VIRTUAL BIOPSY MARKET
- 17.1. Chapter Overview
- 17.2. Key Assumptions and Methodology
- 17.3. Global Virtual Biopsy Market, Historical Trends (Since 2019) and Forecasted Estimates (Till 2035)
- 17.3.1. Scenario Analysis
- 17.3.1.1. Conservative Scenario
- 17.3.1.2. Optimistic Scenario
- 17.3.1. Scenario Analysis
- 17.4. Key Market Segmentations
18. VIRTUAL BIOPSY MARKET, BY TARGET THERAPEUTIC AREA
- 18.1. Chapter Overview
- 18.2. Key Assumptions and Methodology
- 18.3. Virtual Biopsy Market: Distribution by Target Therapeutic Area
- 18.3.1. Virtual Biopsy Market for Oncological Disorders, Historical Trends (Since 2019) and Forecasted Estimates (Till 2035)
- 18.3.2. Virtual Biopsy Market for Neurological Disorders, Historical Trends (Since 2019) and Forecasted Estimates (Till 2035)
- 18.3.3. Virtual Biopsy Market for Cardiovascular Disorders, Historical Trends (Since 2019) and Forecasted Estimates (Till 2035)
- 18.3.4. Virtual Biopsy Market for Ophthalmological Disorders, Historical Trends (Since 2019) and Forecasted Estimates (Till 2035)
- 18.3.5. Virtual Biopsy Market for Endocrine Disorders, Historical Trends (Since 2019) and Forecasted Estimates (Till 2035)
- 18.3.6. Virtual Biopsy Market for Gastrointestinal Disorders, Historical Trends (Since 2019) and Forecasted Estimates (Till 2035)
- 18.3.7. Virtual Biopsy Market for Others, Historical Trends (Since 2019) and Forecasted Estimates (Till 2035)
19. VIRTUAL BIOPSY MARKET, BY TYPE OF CANCER TARGETED
- 19.1. Chapter Overview
- 19.2. Key Assumptions and Methodology
- 19.3. Virtual Biopsy Market: Distribution by Type of Cancer Targeted
- 19.3.1. Virtual Biopsy Market for Solid Malignancies, Historical Trends (Since 2019) and Forecasted Estimates (Till 2035)
- 19.3.2. Virtual Biopsy Market for Breast Cancer, Historical Trends (Since 2019) and Forecasted Estimates (Till 2035)
- 19.3.3. Virtual Biopsy Market for Lung Cancer, Historical Trends (Since 2019) and Forecasted Estimates (Till 2035)
- 19.3.4. Virtual Biopsy Market for Prostate Cancer, Historical Trends (Since 2019) and Forecasted Estimates (Till 2035)
- 19.3.5. Virtual Biopsy Market for Colorectal Cancer, Historical Trends (Since 2019) and Forecasted Estimates (Till 2035)
- 19.3.6. Virtual Biopsy Market for Brain Cancer, Historical Trends (Since 2019) and Forecasted Estimates (Till 2035)
- 19.3.7. Virtual Biopsy Market for Others, Historical Trends (Since 2019) and Forecasted Estimates (Till 2035)
- 19.4. Data Triangulation and Validation
20. VIRTUAL BIOPSY MARKET, BY TYPE OF IMAGING TECHNOLOGY
- 20.1. Chapter Overview
- 20.2. Key Assumptions and Methodology
- 20.3. Virtual Biopsy Market: Distribution by Type of Imaging Technology
- 20.3.1. Virtual Biopsy Market for Magnetic Resonance Imaging, Historical Trends (Since 2019) and Forecasted Estimates (Till 2035)
- 20.3.2. Virtual Biopsy Market for Computed Tomography, Historical Trends (Since 2019) and Forecasted Estimates (Till 2035)
- 20.3.3. Virtual Biopsy Market for X-ray, Historical Trends (Since 2019) and Forecasted Estimates (Till 2035)
- 20.3.4. Virtual Biopsy Market for Ultrasound, Historical Trends (Since 2019) and Forecasted Estimates (Till 2035)
- 20.3.5. Virtual Biopsy Market for Others, Historical Trends (Since 2019) and Forecasted Estimates (Till 2035)
- 20.4. Data Triangulation and Validation
21. VIRTUAL BIOPSY MARKET, BY END USERS
- 21.1. Chapter Overview
- 21.2. Key Assumptions and Methodology
- 21.3. Virtual Biopsy Market: Distribution by End Users
- 21.3.1. Virtual Biopsy Market for Hospitals and Clinics, Historical Trends (Since 2019) and Forecasted Estimates (Till 2035)
- 21.3.2. Virtual Biopsy Market for Research Institutes and Diagnostic Centers, Historical Trends (Since 2019) and Forecasted Estimates (Till 2035)
- 21.3.3. Virtual Biopsy Market for Others, Historical Trends (Since 2019) and Forecasted Estimates (Till 2035)
- 21.4. Data Triangulation and Validation
22. VIRTUAL BIOPSY MARKET, BY GEOGRAPHICAL REGIONS
- 22.1. Chapter Overview
- 22.2. Key Assumptions and Methodology
- 22.3. Virtual Biopsy Market: Distribution by Geographical Regions
- 22.3.1. Virtual Biopsy Market for North America, Historical Trends (Since 2019) and Forecasted Estimates (Till 2035)
- 22.3.1.1. Virtual Biopsy Market in the US, Historical Trends (Since 2019) and Forecasted Estimates (Till 2035)
- 22.3.1.2. Virtual Biopsy Market in Canada, Historical Trends (Since 2019) and Forecasted Estimates (Till 2035)
- 22.3.1.3. Virtual Biopsy Market in Rest of North America, Historical Trends (Since 2019) and Forecasted Estimates (Till 2035)
- 22.3.2. Virtual Biopsy Market for Europe, Historical Trends (Since 2019) and Forecasted Estimates (Till 2035)
- 22.3.2.1. Virtual Biopsy Market in Germany, Historical Trends (Since 2019) and Forecasted Estimates (Till 2035)
- 22.3.2.2. Virtual Biopsy Market in France, Historical Trends (Since 2019) and Forecasted Estimates (Till 2035)
- 22.3.2.3. Virtual Biopsy Market in Italy, Historical Trends (Since 2019) and Forecasted Estimates (Till 2035)
- 22.3.2.4. Virtual Biopsy Market in Spain, Historical Trends (Since 2019) and Forecasted Estimates (Till 2035)
- 22.3.2.5. Virtual Biopsy Market in the UK, Historical Trends (Since 2019) and Forecasted Estimates (Till 2035)
- 22.3.2.6. Virtual Biopsy Market in Switzerland, Historical Trends (Since 2019) and Forecasted Estimates (Till 2035)
- 22.3.2.7. Virtual Biopsy Market in Rest of Europe, Historical Trends (Since 2019) and Forecasted Estimates (Till 2035)
- 22.3.3. Virtual Biopsy Market for Asia-Pacific, Historical Trends (Since 2019) and Forecasted Estimates (Till 2035)
- 22.3.3.1. Virtual Biopsy Market in Japan, Historical Trends (Since 2019) and Forecasted Estimates (Till 2035)
- 22.3.3.2. Virtual Biopsy Market in China, Historical Trends (Since 2019) and Forecasted Estimates (Till 2035)
- 22.3.3.3. Virtual Biopsy Market in India, Historical Trends (Since 2019) and Forecasted Estimates (Till 2035)
- 22.3.3.4. Virtual Biopsy Market in South Korea, Historical Trends (Since 2019) and Forecasted Estimates (Till 2035)
- 22.3.3.5. Virtual Biopsy Market in Australia, Historical Trends (Since 2019) and Forecasted Estimates (Till 2035)
- 22.3.3.6. Virtual Biopsy Market in Rest of Asia Pacific, Historical Trends (Since 2019) and Forecasted Estimates (Till 2035)
- 22.3.4. Virtual Biopsy Market for Middle East and North Africa, Historical Trends (Since 2019) and Forecasted Estimates (Till 2035)
- 22.3.4.1. Virtual Biopsy Market in Saudi Arabia, Historical Trends (Since 2019) and Forecasted Estimates (Till 2035)
- 22.3.4.2. Virtual Biopsy Market in Egypt, Historical Trends (Since 2019) and Forecasted Estimates (Till 2035)
- 22.3.4.3. Virtual Biopsy Market in Israel, Historical Trends (Since 2019) and Forecasted Estimates (Till 2035)
- 22.3.4.4. Virtual Biopsy Market in Rest of Middle East and North Africa, Historical Trends (Since 2019) and Forecasted Estimates (Till 2035)
- 22.3.5. Virtual Biopsy Market for Latin America, Historical Trends (Since 2019) and Forecasted Estimates (Till 2035)
- 22.3.5.1. Virtual Biopsy Market in Brazil, Historical Trends (Since 2019) and Forecasted Estimates (Till 2035)
- 22.3.5.2. Virtual Biopsy Market in Mexico, Historical Trends (Since 2019) and Forecasted Estimates (Till 2035)
- 22.3.5.3. Virtual Biopsy Market in Argentina, Historical Trends (Since 2019) and Forecasted Estimates (Till 2035)
- 22.3.5.4. Virtual Biopsy Market in Rest of Latin America, Historical Trends (Since 2019) and Forecasted Estimates (Till 2035)
- 22.3.1. Virtual Biopsy Market for North America, Historical Trends (Since 2019) and Forecasted Estimates (Till 2035)
- 22.4. Virtual Biopsy Market by Geographical Regions: Market Dynamics Assessment
- 22.4.1. Market Movement Analysis
- 22.4.2. Penetration Growth (P-G) Matrix
- 22.5. Data Triangulation and Validation
23. VIRTUAL BIOPSY MARKET, LEADING PLAYERS
- 23.1. Chapter Overview
- 23.2. Key Assumptions and Methodology
- 23.3. Virtual Biopsy Market: Distribution by Leading Players
- 23.4. Data Triangulation and Validation
24. CONCLUDING REMARKS
25. EXECUTIVE INSIGHTS
26. APPENDIX I: TABULATED DATA
27. APPENDIX II: LIST OF COMPANIES AND ORGANIZATION
List of Tables
- Table 7.1 Virtual Biopsy Devices: Information on Developer, Status of Development, Year of Approval, Region of Approval and Regulatory Accreditations
- Table 7.2 Virtual Biopsy Devices: Information on Type of Step Involved and Clinical Purpose
- Table 7.3 Virtual Biopsy Devices: Information on Type of Imaging Technology Used and Therapeutic Application
- Table 7.4 Virtual Biopsy Devices: Information on Target Therapeutic Area
- Table 7.5 Virtual Biopsy Devices: Information on Type of Cancer Targeted
- Table 7.6 Virtual Biopsy Devices: Information on List of Developers
- Table 9.1 Virtual Biopsy Device Developers based in North America: List of Companies Profiled
- Table 9.2 GE HealthCare: Company Overview
- Table 9.3 GE HealthCare: Virtual Biopsy Device Portfolio
- Table 9.4 GE HealthCare: Recent Developments and Future Outlook
- Table 9.5 Imaging Biometrics (Acquired by IQ-AI): Company Overview
- Table 9.6 Imaging Biometrics (Acquired by IQ-AI): Virtual Biopsy Device Portfolio
- Table 9.7 OptoVibronex: Company Overview
- Table 9.8 OptoVibronex: Virtual Biopsy Device Portfolio
- Table 10.1 Virtual Biopsy Device Developers based in Europe: List of Companies Profiled
- Table 10.2 ImageBiopsy Lab: Company Overview
- Table 10.3 ImageBiopsy Lab: Virtual Biopsy Device Portfolio
- Table 10.4 ImageBiopsy Lab: Recent Developments and Future Outlook
- Table 10.5 Median Technologies: Company Overview
- Table 10.6 Median Technologies: Virtual Biopsy Device Portfolio
- Table 10.7 Median Technologies: Recent Developments and Future Outlook
- Table 10.8 Quibim: Company Overview
- Table 10.9 Quibim: Virtual Biopsy Device Portfolio
- Table 10.10 Quibim: Recent Developments and Future Outlook
- Table 10.11 Siemens Healthineers: Company Overview
- Table 10.12 Siemens Healthineers: Virtual Biopsy Device Portfolio
- Table 11.1 Virtual Biopsy Device Developers based in Asia Pacific: List of Companies Profiled
- Table 11.2 City Imaging and Clinical Labs: Company Overview
- Table 11.3 City Imaging and Clinical Labs: Virtual Biopsy Device Portfolio
- Table 11.4 City Imaging and Clinical Labs: Recent Developments and Future Outlook
- Table 12.1 Virtual Biopsy Device Developers: List of Partnerships and Collaborations, Since 2020
- Table 12.2 Partnerships and Collaborations: Information on Location of Headquarters (Country and Region) and Type of Agreement (Country and Region)
- Table 13.1 Virtual Biopsy Devices: List of Funding and Investments, Since 2020
- Table 14.1 Patent Analysis: Top CPC Sections
- Table 14.2 Patent Analysis: Top CPC Symbols
- Table 14.3 Patent Analysis: Top CPC Codes
- Table 14.4 Patent Analysis: Summary of Benchmarking Analysis
- Table 14.5 Patent Analysis: Categorization based on Weighted Valuation Scores
- Table 14.6 Patent Portfolio: List of Leading Patents (by Highest Relative Valuation)
- Table 14.7 Patent Portfolio: List of Leading Patents (by Number of Citations)
- Table 25.1 GENECAST: Company Snapshot
- Table 25.2 Quibim: Company Snapshot
- Table 26.1 Virtual Biopsy Devices: Distribution by Status of Development
- Table 26.2 Virtual Biopsy Devices: Distribution by Year of Approval
- Table 26.3 Virtual Biopsy Devices: Distribution by Region of Approval
- Table 26.4 Virtual Biopsy Devices: Distribution by Regulatory Accreditations
- Table 26.5 Virtual Biopsy Devices: Distribution by Type of Step Involved
- Table 26.6 Virtual Biopsy Devices: Distribution by Clinical Purpose
- Table 26.7 Virtual Biopsy Devices: Distribution by Type of Imaging Technology Used
- Table 26.8 Virtual Biopsy Devices: Distribution by Status of Development and Type of Imaging Technology Used
- Table 26.9 Virtual Biopsy Devices: Distribution by Therapeutic Application
- Table 26.10 Virtual Biopsy Devices: Distribution by Target Therapeutic Area
- Table 26.11 Virtual Biopsy Devices: Distribution by Status of Development and Target Therapeutic Area
- Table 26.12 Virtual Biopsy Devices: Distribution by Type of Cancer Targeted
- Table 26.13 Virtual Biopsy Device Developers: Distribution by Year of Establishment
- Table 26.14 Virtual Biopsy Device Developers: Distribution by Company Size
- Table 26.15 Virtual Biopsy Device Developers: Distribution by Location of Headquarters (Region)
- Table 26.16 Virtual biopsy Device Developers: Distribution by Status of Development and Location of Headquarters (Region)
- Table 26.17 Virtual biopsy Device Developers: Distribution by Location of Headquarters (Country)
- Table 26.18 Virtual Biopsy Device Developers: Distribution by Company Size and Location of Headquarters (Region)
- Table 26.19 Most Active Developers: Distribution by Number of Virtual Biopsy Devices Developed
- Table 26.20 GE HealthCare: Business Segment-wise Revenues and Consolidated Financial Details (USD Million)
- Table 26.21 IQ-AI (Parent Company of Imaging Biometrics): Consolidated Financial Details (GBP Million)
- Table 26.22 Median Technologies: Consolidated Financial Details (EUR Million)
- Table 26.23 Siemens Healthineers: Business Segment-wise Revenues and Consolidated Financial Details (EUR Million)
- Table 26.24 Partnerships and Collaborations: Cumulative Year-wise Trend, Since 2020
- Table 26.25 Partnerships and Collaborations: Distribution by Type of Partnership
- Table 26.26 Partnerships and Collaborations: Distribution by Year and Type of Partnership, Since 2020
- Table 26.27 Partnerships and Collaborations: Distribution by Type of Partner
- Table 26.28 Partnerships and Collaborations: Distribution by Type of Imaging Technology
- Table 26.29 Partnerships and Collaborations: Distribution by Therapeutic Application
- Table 26.30 Most Active Players: Distribution by Number of Partnerships
- Table 26.31 Partnership and Collaborations: Local and International Agreements
- Table 26.32 Partnerships and Collaborations: Intracontinental and Intercontinental Agreements
- Table 26.33 Funding and Investments: Cumulative Year-wise Trend, Since 2020
- Table 26.34 Funding and Investments: Distribution by Type of Funding
- Table 26.35 Funding and Investments: Distribution by Year and Type of Funding, Since 2020
- Table 26.36 Funding and Investments: Distribution by Amount Invested, Since 2020 (USD Million)
- Table 26.37 Funding and Investments: Distribution of Amount Invested by Type of Funding (USD Million)
- Table 26.38 Funding and Investments: Distribution by Geography (Region)
- Table 26.39 Most Active Players: Distribution by Number of Funding Instances
- Table 26.40 Most Active Players: Distribution by Amount Raised (USD Million)
- Table 26.41 Leading Investors: Distribution by Number of Funding Instances
- Table 26.42 Funding and Investment Summary, Since 2020 (USD Million)
- Table 26.43 Patent Analysis: Distribution by Type of Patent
- Table 26.44 Patent Analysis: Cumulative Distribution by Patent Publication Year, Since 2019
- Table 26.45 Patent Analysis: Distribution by Type of Patent and Patent Publication Year, Since 2019
- Table 26.46 Patent Analysis: Distribution by Patent Application Year, Since Pre-2018
- Table 26.47 Patent Analysis: Patent Jurisdiction
- Table 26.48 Patent Analysis: Cumulative Year-wise Distribution by Type of Applicant, Since 2019
- Table 26.49 Leading Industry Players: Distribution by Number of Patents
- Table 26.50 Leading Non-Industry Players: Distribution by Number of Patents
- Table 26.51 Patent Analysis: Distribution by Patent Age
- Table 26.52 Virtual Biopsy: Patent Valuation
- Table 26.53 Publication Analysis: Cumulative Year-wise Trend, Since Pre-2019
- Table 26.54 Publication Analysis: Distribution by Type of Publication
- Table 26.55 Key Copyright Holders: Distribution by Number of Publications
- Table 26.56 Most Active Publishers: Distribution by Number of Publications
- Table 26.57 Key Journals: Distribution by Number of Publications
- Table 26.58 Key Journals: Distribution by Impact Factor
- Table 26.59 Publication Analysis: Most Popular Keywords
- Table 26.60 Global Virtual Biopsy Market, Historical Trends (Since 2019) and Forecasted Estimates (Till 2035) (USD Billion)
- Table 26.61 Global Virtual Biopsy Market, Forecasted Estimates (Till 2035): Conservative Scenario (USD Billion)
- Table 26.62 Global Virtual Biopsy Market, Forecasted Estimates (Till 2035): Optimistic Scenario (USD Billion)
- Table 26.63 Virtual Biopsy Market: Distribution by Target Therapeutic Area
- Table 26.64 Virtual Biopsy Market for Oncological Disorders, Historical Trends (Since 2019) and Forecasted Estimates (Till 2035) (USD Billion)
- Table 26.65 Virtual Biopsy Market for Neurological Disorders, Historical Trends (Since 2019) and Forecasted Estimates (Till 2035) (USD Billion)
- Table 26.66 Virtual Biopsy Market for Cardiovascular Disorders, Historical Trends (Since 2019) and Forecasted Estimates (Till 2035) (USD Billion)
- Table 26.67 Virtual Biopsy Market for Ophthalmological Disorders, Historical Trends (Since 2019) and Forecasted Estimates (Till 2035) (USD Billion)
- Table 26.68 Virtual Biopsy Market for Endocrine Disorders, Historical Trends (Since 2019) and Forecasted Estimates (Till 2035) (USD Billion)
- Table 26.69 Virtual Biopsy Market for Gastrointestinal Disorders, Historical Trends (Since 2019) and Forecasted Estimates (Till 2035) (USD Billion)
- Table 26.70 Virtual Biopsy Market for Others, Historical Trends (Since 2019) and Forecasted Estimates (Till 2035) (USD Billion)
- Table 26.71 Virtual Biopsy Market: Distribution by Type of Cancer Targeted
- Table 26.72 Virtual Biopsy Market for Solid Malignancies, Historical Trends (Since 2019) and Forecasted Estimates (Till 2035) (USD Billion)
- Table 26.73 Virtual Biopsy Market for Breast Cancer, Historical Trends (Since 2019) and Forecasted Estimates (Till 2035) (USD Billion)
- Table 26.74 Virtual Biopsy Market for Lung Cancer, Historical Trends (Since 2019) and Forecasted Estimates (Till 2035) (USD Billion)
- Table 26.75 Virtual Biopsy Market for Prostate Cancer, Historical Trends (Since 2019) and Forecasted Estimates (Till 2035) (USD Billion)
- Table 26.76 Virtual Biopsy Market for Colorectal Cancer, Historical Trends (Since 2019) and Forecasted Estimates (Till 2035) (USD Billion)
- Table 26.77 Virtual Biopsy Market for Brain Cancer, Historical Trends (Since 2019) and Forecasted Estimates (Till 2035) (USD Billion)
- Table 26.78 Virtual Biopsy Market for Others, Historical Trends (Since 2019) and Forecasted Estimates (Till 2035) (USD Billion)
- Table 26.79 Virtual Biopsy Market: Distribution by Imaging Technology
- Table 26.80 Virtual Biopsy Market for Magnetic Resonance Imaging, Historical Trends (Since 2019) and Forecasted Estimates (Till 2035) (USD Billion)
- Table 26.81 Virtual Biopsy Market for Computed Tomography, Historical Trends (Since 2019) and Forecasted Estimates (Till 2035) (USD Billion)
- Table 26.82 Virtual Biopsy Market for X-ray, Historical Trends (Since 2019) and Forecasted Estimates (Till 2035) (USD Billion)
- Table 26.83 Virtual Biopsy Market for Ultrasound, Historical Trends (Since 2019) and Forecasted Estimates (Till 2035) (USD Billion)
- Table 26.84 Virtual Biopsy Market for Others, Historical Trends (Since 2019) and Forecasted Estimates (Till 2035) (USD Billion)
- Table 26.85 Virtual Biopsy Market: Distribution by End Users
- Table 26.86 Virtual Biopsy Market for Hospitals and Clinics, Historical Trends (Since 2019) and Forecasted Estimates (Till 2035) (USD Billion)
- Table 26.87 Virtual Biopsy Market for Research Institutes and Diagnostic Centers, Historical Trends (Since 2019) and Forecasted Estimates (Till 2035) (USD Billion)
- Table 26.88 Virtual Biopsy Market for Others, Historical Trends (Since 2019) and Forecasted Estimates (Till 2035) (USD Billion)
- Table 26.89 Virtual Biopsy Market: Distribution by Geographical Regions
- Table 26.90 Virtual Biopsy Market in North America, Historical Trends (Since 2019) and Forecasted Estimates (Till 2035) (USD Billion)
- Table 26.91 Virtual Biopsy Market in the US, Historical Trends (Since 2019) and Forecasted Estimates (Till 2035) (USD Billion)
- Table 26.92 Virtual Biopsy Market in Canada, Historical Trends (Since 2019) and Forecasted Estimates (Till 2035) (USD Billion)
- Table 26.93 Virtual Biopsy Market in Europe, Historical Trends (Since 2019) and Forecasted Estimates (Till 2035) (USD Billion)
- Table 26.94 Virtual Biopsy Market in Germany, Historical Trends (Since 2019) and Forecasted Estimates (Till 2035) (USD Billion)
- Table 26.95 Virtual Biopsy Market in France, Historical Trends (Since 2019) and Forecasted Estimates (Till 2035) (USD Billion)
- Table 26.96 Virtual Biopsy Market in Italy, Historical Trends (Since 2019) and Forecasted Estimates (Till 2035) (USD Billion)
- Table 26.97 Virtual Biopsy Market in the UK, Historical Trends (Since 2019) and Forecasted Estimates (Till 2035) (USD Billion)
- Table 26.98 Virtual Biopsy Market in Spain, Historical Trends (Since 2019) and Forecasted Estimates (Till 2035) (USD Billion)
- Table 26.99 Virtual Biopsy Market in Switzerland, Historical Trends (Since 2019) and Forecasted Estimates (Till 2035) (USD Billion)
- Table 26.100 Virtual Biopsy Market in Rest of Europe, Historical Trends (Since 2019) and Forecasted Estimates (Till 2035) (USD Billion)
- Table 26.101 Virtual Biopsy Market in Asia-Pacific, Historical Trends (Since 2019) and Forecasted Estimates (Till 2035) (USD Billion)
- Table 26.102 Virtual Biopsy Market in China, Historical Trends (Since 2019) and Forecasted Estimates (Till 2035) (USD Billion)
- Table 26.103 Virtual Biopsy Market in Japan, Historical Trends (Since 2019) and Forecasted Estimates (Till 2035) (USD Billion)
- Table 26.104 Virtual Biopsy Market in India, Historical Trends (Since 2019) and Forecasted Estimates (Till 2035) (USD Billion)
- Table 26.105 Virtual Biopsy Market in South Korea, Historical Trends (Since 2019) and Forecasted Estimates (Till 2035) (USD Billion)
- Table 26.106 Virtual Biopsy Market in Australia, Historical Trends (Since 2019) and Forecasted Estimates (Till 2035) (USD Billion)
- Table 26.107 Virtual Biopsy Market in Rest of Asia Pacific, Historical Trends (Since 2019) and Forecasted Estimates (Till 2035) (USD Billion)
- Table 26.108 Virtual Biopsy Market in Middle East and North Africa, Historical Trends (Since 2019) and Forecasted Estimates (Till 2035) (USD Billion)
- Table 26.109 Virtual Biopsy Market in Saudi Arabia, Historical Trends (Since 2019) and Forecasted Estimates (Till 2035) (USD Billion)
- Table 26.110 Virtual Biopsy Market in Israel, Historical Trends (Since 2019) and Forecasted Estimates (Till 2035) (USD Billion)
- Table 26.111 Virtual Biopsy Market in Egypt, Historical Trends (Since 2019) and Forecasted Estimates (Till 2035) (USD Billion)
- Table 26.112 Virtual Biopsy Market in Rest of Middle East and North Africa, Historical Trends (Since 2019) and Forecasted Estimates (Till 035) (USD Billion)
- Table 26.113 Virtual Biopsy Market in Latin America, Historical Trends (Since 2019) and Forecasted Estimates (Till 2035) (USD Billion)
- Table 26.114 Virtual Biopsy Market in Brazil, Historical Trends (Since 2019) and Forecasted Estimates (Till 2035) (USD Billion)
- Table 26.115 Virtual Biopsy Market in Mexico, Historical Trends (Since 2019) and Forecasted Estimates (Till 2035) (USD Billion)
- Table 26.116 Virtual Biopsy Market in Argentina, Historical Trends (Since 2019) and Forecasted Estimates (Till 2035) (USD Billion)
- Table 26.117 Virtual Biopsy Market in Rest of Latin America, Historical Trends (Since 2019) and Forecasted Estimates (Till 2035) (USD Billion)
- Table 26.118 Virtual Biopsy Market: Distribution by Leading Players (USD Billion)
 2026年全球息肉切片檢查市場報告2026年全球皮膚切片檢查市場報告2026年全球虛擬活體組織切片市場報告
 虛擬切片檢查市場分析及預測(至2035年):按類型、產品類型、服務、技術、應用、最終用戶、組件、流程、解決方案、模式
 光學切片市場 - 全球產業規模、佔有率、趨勢、機會及預測(按技術、應用、最終用戶、地區和競爭格局分類,2021-2031年)
 骨髓切片檢查托盤市場:按產品組合、手術類型、材質組合、最終用戶和銷售管道- 全球預測(2026-2032 年)
 皮膚切片檢查市場規模、佔有率及成長分析(按類型、適應症、最終用戶和地區分類)-2026-2033年產業預測微創活體組織切片技術市場-全球產業規模、佔有率、趨勢、機會和預測,按產品、技術、循環生物標記、應用、最終用戶、地區和競爭格局細分,2020-2030年預測機器人切片檢查設備市場按產品類型、技術、應用、最終用戶和手術類型分類-2025-2032年全球預測2025年全球切片檢查市場報告