


 |
市場調查報告書
商品編碼
1723659
稀少腎臟疾病市場:各標的適應症,各分子類型,生技藥品類別,各給藥途徑,治療類別,主要各地區,主要醫藥品開發各企業,預測銷售額:2040年為止的產業趨勢與全球預測Rare Kidney Diseases Market by Target Disease Indications, Type of Biologics, Route of Administration, Type of Therapy, Key Geographical Regions, Leading Drug Developers and Sales Forecast: Industry Trends and Global Forecasts, Till 2040 |
||||||
罕見腎臟病市場
2024 年全球罕見腎臟病市場規模為 22 億美元。目前該市場規模為 28 億美元,預計到 2035 年將達到 116 億美元,預測期內複合年增長率為 15.2%。
罕見腎臟病市場機會分佈在以下領域:
目標適應症
- 非典型溶血性尿毒症綜合症
- 法布瑞氏症
- 局部節段性腎絲球硬化症
- 免疫球蛋白A腎病
- 狼瘡性腎炎
- 其他
分子類型
- 生物製劑
- 小分子
生物製劑類型
- 酶
- 激素
- 單株抗體
- 蛋白質
給藥途徑給藥方式
- 靜脈注射
- 口服
- 皮下注射
治療類型
- 單藥治療
- 合併治療
主要地區
- 北美
- 歐洲
- 亞太地區
罕見腎臟病市場:成長與趨勢
腎臟疾病包括多種疾病,這些疾病會阻礙腎臟有效過濾血液中廢物和多餘液體的自然能力。這些疾病也會損害腎臟調節血壓和維持體液平衡的整體功能。腎臟疾病尤其難以診斷,因為它們在早期通常沒有症狀。然而,隨著廢物在體內積聚,可能會出現高血壓、貧血、營養不良和神經系統疾病等症狀。根據美國疾病管制與預防中心的數據,到2024年,美國將有約3,550萬人罹患腎臟疾病,佔總人口的近14%。罕見腎臟疾病是這些疾病中的一個亞類,在全球範圍內僅影響一小部分人。根據 "孤兒藥法案" ,在美國,如果一種疾病影響的人數少於20萬人,則將其歸類為罕見疾病。然而,在歐盟,罕見疾病的定義是每10,000個歐洲人中約有5人受到影響的疾病。
罕見腎臟疾病主要影響腎臟的過濾裝置(稱為腎小球),導致蛋白質物質和血液滲漏到尿液中。這些疾病可能是先天性的、後天性的或遺傳性的,因此很難確定用於診斷和治療的特定生物標記。如果不及時幹預,罕見腎臟疾病往往會導致腎衰竭,需要透析或移植。值得注意的是,至少五分之三的兒童和九分之一的成人腎臟病患者會因罕見慢性腎臟病導致腎衰竭。為了應對這些挑戰,罕見腎臟病的診斷和治療已取得顯著進展。精準醫療,例如基因組定序和個人化治療,使得這些疾病的標靶治療成為可能。此外,大數據和機器學習的整合也為眾多藥物開發商和研究人員提供了幫助,幫助他們改進臨床試驗的患者招募,並識別出用於個人化治療的精準尿液生物標記。
此外,公共和私營部門的大量投資正在加速該領域的研發。目前,藥物開發商已撥出超過120億美元用於罕見腎臟病的研究和治療開發。此外,隨著對高效診斷和治療的日益重視,罕見腎臟病藥物/療法市場有望在未來幾年實現強勁成長,並為利害關係人帶來重大機會。
罕見腎臟病市場:關鍵洞察
本報告深入探討了罕見腎臟病市場的現狀,並識別了該行業的潛在成長機會。報告的主要發現包括:
- 超過 70% 的罕見腎臟病藥物/療法正處於臨床開發階段。值得注意的是,大多數針對免疫球蛋白A腎病和狼瘡性腎炎的藥物/療法正在研究中。
- 過去各利益相關者之間建立的合作夥伴關係數量表明,各方對該領域的興趣日益濃厚;事實上,65% 的交易是在過去三年內達成的。
- 多家投資者已經意識到該領域的機遇,並透過多輪融資投入了大量資金,其中 45% 的投資是透過二次發行進行的。
- 目前,近 40% 的罕見腎臟病藥物正處於臨床開發的 II 期階段。
- 預計到2035年,罕見腎臟病市場的複合年增長率將達到15%,其中北美市場預計將佔據大部分市場佔有率(約70%)。
- 現在,單株抗體壟斷市場做著,尤其是口服給藥2035年之前與佔市場大半部分預料。
罕見腎臟病市場:關鍵細分市場
根據目標適應症,全球罕見腎臟病市場細分為非典型溶血性尿毒症症候群、法布瑞氏症、局部節段性腎絲球硬化症、免疫球蛋白A腎病變、狼瘡性腎炎等。目前,由於患者群體和醫療保健專業人員對該疾病的危害性認識不斷提高,狼瘡性腎炎佔據罕見腎臟疾病市場的大部分佔有率。
依分子類型,全球市場細分為小分子和生物製劑。在這些類型中,小分子市場在當前整體市場中佔有最大佔有率。然而,值得注意的是,生物製劑已成為一種有前景的替代方案,可以靶向與罕見腎臟疾病相關的潛在生物學途徑,因此預計未來幾年將佔據更大的市場佔有率。
依生物製劑類型,全球市場規模可細分為酵素、荷爾蒙、單株抗體和蛋白質。值得注意的是,單株抗體目前佔據市場主導地位。此外,由於其在治療罕見腎臟疾病方面的精準性已被證實,這一趨勢未來不太可能改變。
依給藥途徑,全球市場可細分為靜脈注射、口服和皮下注射。目前,口服給藥途徑預計將佔據罕見腎臟疾病市場的大多數佔有率,因為與其他途徑相比,它是一種非侵入性途徑,並且能夠提高患者的依從性。然而,值得一提的是,預計這一趨勢在預測期內將有所改變,預計未來幾年皮下給藥途徑將佔據整體市場的更大佔有率。
依治療類型,全球罕見腎臟病市場可細分為單藥治療及合併治療。目前,單藥治療佔據整體市場的最大佔有率。然而,在預測期內,聯合療法市場可能會以相對較高的複合年增長率成長。
依主要地區劃分,市場分為北美、歐洲和亞太地區。目前,北美佔據最大市場佔有率。然而,預測期內亞太地區市場預計將以更快的速度成長,因為在中國、日本、韓國和印度等亞洲國家,罕見腎臟病的盛行率正在上升,因此該地區需要更有效的治療管理系統。
報告解答的關鍵問題
- 目前有多少家公司進入該市場?
- 該市場的主要公司
- 可能影響該市場發展的因素
- 當前與未來的市場規模
- 該市場的複合年增長率
- 當前和未來的市場機會可能如何在主要細分市場中分配?
- 市場專利申請趨勢
為何購買此報告?
- 本報告提供全面的市場分析,並針對整體市場和特定細分市場提供詳細的收入預測。這些資訊對於現有的市場領導者和新進入者都極具價值。
- 利害關係人可以利用本報告深入了解市場競爭動態。透過分析競爭格局,企業可以做出明智的決策,優化市場定位並制定有效的市場進入策略。
- 本報告為利害關係人提供了全面的市場概覽,包括關鍵推動因素、阻礙因素和挑戰。這些資訊使利害關係人能夠掌握市場趨勢,並做出基於數據的決策,從而掌握成長前景。
更多優勢
- 免費 Excel 資料包
- 10% 免費內容客製化
- 研究團隊提供詳細的報告講解
- 如果報告超過 6-12 個月,可免費更新報告
本報告提供全球稀少腎臟疾病市場相關調查,提供市場概要,以及各標的適應症,各分子類型,生技藥品類別,各給藥途徑,治療類別,主要各地區,主要醫藥品開發各企業趨勢,及加入此市場的主要企業簡介等資訊。
目錄
章節I:報告概要
第1章 背景
第2章 調查手法
第3章 市場動態
第4章 宏觀經濟指標
章節II:定性性的洞察
第5章 摘要整理
第6章 簡介
- 腎臟疾病概要
- 稀少腎臟疾病治療目標的選擇
- 稀少腎臟疾病領域的技術的進步
- 稀少腎臟疾病領域的最近的趨勢
- 未來展望
章節III:競爭情形
第7章 市場形勢
第8章 企業競爭力分析
章節VI:企業簡介
第9章 稀少腎臟疾病市場:北美為據點的醫藥品·開發治療企業的企業簡介
- 章概要
- Alexion Pharmaceuticals
- Biogen
- NovelMed
- Travere Therapeutics
- Vertex Pharmaceuticals
- Amgen
- Vera Therapeutics
- ZyVersa Therapeutics
第10章 稀少腎臟疾病市場:歐洲為據點的醫藥品·開發治療企業的企業簡介
- 章概要
- Novartis
- Roche
- Advicenne
- Boehringer Ingelheim
- Calliditas Therapeutics
第11章 稀少腎臟疾病市場:亞太地區為據點的醫藥品·開發治療企業的企業簡介
- 章概要
- Jiangsu Hengrui Pharmaceuticals
- Asahi Kasei
章節V:市場趨勢
第12章 夥伴關係和合作
- 夥伴關係模式
- 稀少腎臟疾病的藥/治療方法:夥伴關係聯合
第13章 資金籌措與投資
- 資金籌措模式
- 資金籌措生命週期分析
- 投資案例:風險與回本
- 稀少腎臟疾病的藥/治療方法:資金籌措與投資
- 投資摘要
第14章 臨床試驗分析
- 調查手法主要的參數
- 稀少腎臟疾病的藥/治療方法:臨床試驗分析
第15章 臨床性商業性魅力
- 調查手法主要的參數
- 評分
- 把稀少腎臟疾病作為標的第三階段的藥物/治療方法
第16章 主要意見領袖
第17章 稀少腎臟疾病市場:案例研究
與章節VI:市場預測機會分析
第18章 市場影響分析:促進因素,阻礙因素,機會,課題
- 章概要
- 市場促進因素
- 市場阻礙因素
- 市場機會
- 市場課題
- 結論
第19章 稀少腎臟疾病市場
- 主要的前提調查手法
- 全球稀少腎臟疾病市場:歷史的趨勢與2040年為止的預測
- 主要的市場區隔
第20章 稀少腎臟疾病市場(各標的適應症)
第21章 稀少腎臟疾病市場(各分子類型)
第22章 稀少腎臟疾病市場(生物製藥類別)
第23章 稀少腎臟疾病市場(各給藥途徑)
第24章 稀少腎臟疾病市場(治療類別)
第25章 稀少腎臟疾病市場(主要各地區)
第26章 稀少腎臟疾病市場,醫藥品的銷售額預測
第27章 稀少腎臟疾病市場(主要醫藥品開發各企業)
章節VII:其他的壟斷的洞察
第28章 結論
第29章 來自1次調查的洞察
章節VIII:附錄
第30章 表格形式資料
第31章 企業·團體一覽
RARE KIDNEY DISEASES MARKET
As per Roots Analysis, the global rare kidney diseases market size is valued at USD 2.2 billion in 2024 and is projected to reach USD 2.8 billion in the current year and USD 11. 6 billion by 2035, growing at a CAGR of 15.2% during the forecast period.
The opportunity for rare kidney diseases market has been distributed across the following segments:
Target Disease Indications
- Atypical Hemolytic Uremic Syndrome
- Fabry Disease
- Focal Segmental Glomerulosclerosis
- Immunoglobulin A Nephropathy
- Lupus Nephritis
- Others
Type of Molecule
- Biologics
- Small Molecules
Type of Biologic
- Enzymes
- Hormones
- Monoclonal Antibodies
- Proteins
Route of Administration
- Intravenous
- Oral
- Subcutaneous
Type of Therapy
- Monotherapy
- Combination Therapy
Key Geographical Regions
- North America
- Europe
- Asia-Pacific
RARE KIDNEY DISEASES MARKET: GROWTH AND TRENDS
Kidney diseases include a wide array of conditions that hinder the natural ability of the kidney to efficiently filter waste and excess fluid from the blood. These diseases also compromise the overall function of the kidneys to regulate blood pressure and maintain the overall fluid balance in the body. Notably, in the early stages, kidney diseases often present no symptoms, making the diagnosis challenging. However, as waste accumulates in the body, patients may experience symptoms, such as high blood pressure, anemia, poor nutritional health and nerve damage. According to the US Centers for Disease Control and Prevention, approximately 35.5 million people in the US were estimated to be affected by kidney diseases, in 2024, accounting for nearly 14% of the overall population. A subset of these conditions, rare kidney diseases, affect a smaller fraction of individuals worldwide. Under the Orphan Drug Act, a disease is classified as rare in the US if it affects less than 200,000 people. However, in the European Union, rare diseases are defined as those impacting around 5 per 10,000 Europeans.
Rare kidney diseases primarily affect the kidneys' filtering units (known as glomeruli), leading to the spillage of protein components and blood into the urine. These conditions can either be congenital, acquired or inherited, making it difficult to identify specific biomarkers for diagnosis and treatment. Without timely intervention, rare kidney diseases often lead to kidney failure, necessitating dialysis or transplantation. It is important to mention that kidney failure due to a rare chronic kidney disease has been observed in at least 3 out of 5 children and 1 in 9 adults suffering from kidney diseases. To address these challenges, significant advancements have been made in diagnosing and treating rare kidney diseases. Precision medicines, including genomic sequencing and personalized therapies, have enabled the targeted treatment of these diseases. Additionally, the integration of big data and machine learning has helped several drug developers and researchers by improving patient recruitment for clinical trials and identifying accurate urinary biomarkers for tailored treatment.
Moreover, substantial investment from both public and private sectors accelerates research and development in this domain. Presently, drug developers have secured over USD 12 billion in funding for rare kidney research and treatment development. Further, with a growing focus on efficient diagnosis and treatment, the market for rare kidney disease drugs / therapies is poised for robust growth, presenting significant opportunities for stakeholders in the coming years.
RARE KIDNEY DISEASES MARKET: KEY INSIGHTS
The report delves into the current state of the rare kidney diseases market and identifies potential growth opportunities within the industry. Some key findings from the report include:
- Over 70% of the rare kidney drugs / therapies are in clinical stages of development; notably, most of the drugs / therapies are being investigated for the treatment of immunoglobulin A nephropathy and lupus nephritis.
- The rising interest in this domain is evident from the wide array of partnerships established between various stakeholders in the recent past; in fact, 65% of the total deals were inked in the last three years.
- Several investors, having realized the opportunity within this domain, have invested significant capital across various funding rounds; 45% of the investments in this domain were made through secondary offerings.
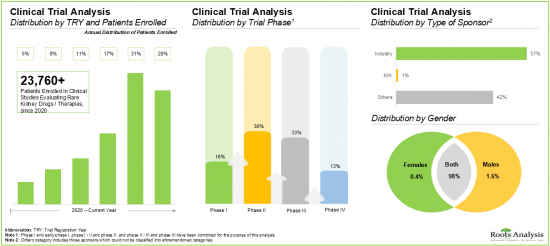
- Nearly 40% of the drugs targeting rare kidney diseases are currently in Phase II of clinical development; notably, around 60% of the trials have been sponsored by industry players.
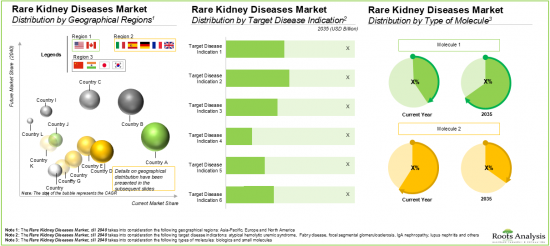
- The rare kidney disease market is likely to grow at an annualized rate (CAGR) of ~15%, till 2035; the majority of the market share (~70%) is expected to be captured by North America, by 2035.
- Currently, the monoclonal antibodies dominate the market; notably, oral route of administration is anticipated to capture the majority share in the market by 2035.
RARE KIDNEY DISEASES MARKET: KEY SEGMENTS
Lupus Nephritis is the Fastest Growing Segment in the Rare Kidney Diseases Market
Based on the type of target disease indication, the global rare kidney disease market is segmented into atypical hemolytic uremic syndrome, Fabry disease, focal segmental glomerulosclerosis, immunoglobulin A nephropathy, lupus nephritis, and others. Currently, the majority share of the rare kidney disease market is captured by lupus nephritis, due to the increasing awareness regarding the adversity of the disease among both patient population and healthcare professionals.
Small Molecules are Likely to Hold the Largest Share of the Rare Kidney Diseases Market During the Forecast Period
Based on the type of molecule, the global market is segmented into small molecules and biologics. Amongst these types, the small molecules segment occupies the largest share of the current overall market. However, it is important to note that biologics are expected to emerge as a promising alternative that can target underlying biological pathways associated with rare kidney disease, therefore, capturing a larger market share in the coming years.
Rare Kidney Diseases Market for Proteins is Likely to Grow at a Relatively Faster Pace During the Forecast Period
Based on the type of biologic, the global market value is segmented across enzymes, hormones, monoclonal antibodies, and proteins. Notably, the monoclonal antibodies segment dominates the current market. Moreover, this trend is unlikely to change in the foreseen future owing to their proven precision in treating rare kidney diseases.
Oral Route of Administration Holds the Largest Share of the Rare Kidney Diseases Market
Based on the route of administration, the global market is segmented across intravenous, oral and subcutaneous routes of administration. Currently, the oral route is expected to hold the majority rare kidney disease market share owing to its non-invasive nature and increased patient compliance as compared to other routes. However, it is worth mentioning that this trend is expected to change during the forecast period, with the subcutaneous route of administration capturing a larger share of the overall market in the coming years.
By Type of Therapy, Monotherapy Segment is Likely to Dominate the Market During the Forecast Period
Based on the type of therapy, the global market for rare kidney diseases is segmented across monotherapy and combination therapy. At present, the monotherapy segment holds the maximum share in the overall market. However, the market for combination therapy is likely to grow at a relatively higher CAGR during the forecast period.
North America Accounts for the Largest Share of the Market
Based on key geographical regions, the market is segmented into North America, Europe, and Asia-Pacific. In the current scenario, North America is likely to capture the largest market share. However, the market in Asia-Pacific is expected to grow at a faster pace during the forecast period owing to the fact that various Asian countries, such as China, Japan, Korea, and India are reporting increasing incidence rates of rare kidney diseases which necessitates more effective treatment management systems in this region.
Example Players in the Rare Kidney Diseases Market
- Alexion Pharmaceuticals
- Amicus Therapeutics
- Apellis Pharmaceuticals
- Aurinia Pharmaceuticals
- GlaxoSmithKline
- Novartis
- Roche
- Travere Therapeutics
- Vera Therapeutics
RARE KIDNEY DISEASES MARKET: RESEARCH COVERAGE
The report on Rare Kidney Diseases Market features insights into various sections, including:
- Market Sizing and Opportunity Analysis: An in-depth analysis of the rare kidney diseases market, focusing on key market segments, including [A] type of disease indication, [B] type of molecule, [C] type of biologic, [D] route of administration, [E] type of therapy, [F] key geographical regions, and [G] key players.
- Market Impact Analysis: A thorough analysis of various factors, such as drivers, restraints, opportunities, and existing challenges that are likely to impact market growth.
- Market Landscape: A comprehensive evaluation of rare kidney diseases drugs / therapies developers, based on several relevant parameters, such as [A] stage of development, [B] target indication, [C] route of administration, [D] type of molecule, [E] type of biologic, [F] dosing frequency, [G] target patient population, and [H] type of therapy.
- Rare Kidney Diseases Drug / Therapies Developer Landscape: The report features a list of leading players engaged in the rare kidney diseases domain, along with analyses based on [A] year of establishment, [B] company size, [C] location of headquarters, and [D] most active players (in terms of number of drugs / therapies developed).
- Company Competitiveness Analysis: An insightful competitiveness analysis of the companies engaged in the rare kidney diseases domain, based on various relevant parameters, such as [A] company strength, [B] portfolio strength, and [C] pipeline diversity.
- Company Profiles: In-depth profiles of key industry players offering rare kidney drugs / therapies across various geographies, focusing on [A] company overviews, [B] drug portfolio, [C] financial information (if available), [D] recent developments and [E] an informed future outlook.
- Partnerships and Collaborations: A detailed analysis of partnerships inked between stakeholders in the rare kidney diseases market, since 2019, based on several relevant parameters, such as [A] year of partnership, [B] type of partnership, [C] target disease indication, [D] type of partner, [E] most active players (in terms of number of partnerships), and [F] geography.
- Funding and Investments Analysis: A detailed analysis of the various funding and investments raised in the rare kidney diseases domain, based on several relevant parameters, such as [A] year of funding, [B] type of funding, [C] amount of funding, [D] target disease indication, [E] geography, and [F] most active players (in terms of number of funding instances).
- Clinical Trial Analysis: An in-depth analysis of completed / ongoing clinical trials related to rare kidney diseases drugs / therapies, based on various relevant parameters, such as [A] trial registration year, [B] trial status, [C] number of patients enrolled, [D] trial phase, [E] study design (type of trial masking, type of intervention model, trial purpose and design allocation), [F] type of sponsor, [G] patient gender, [H] most active sponsor / collaborator (leading industry and non-industry players based on the number of registered trials), and [I] geography.
- Clinical Commercial Attractiveness: A detailed analysis of the clinical and commercial attractiveness for phase III drugs / therapies targeting rare kidney diseases, based on several parameters, such as [A] type of molecule, [B] dosing frequency, [C] route of administration, [D] number of patients enrolled, [E] company size, [F] patient population, and [G] location of clinical trials.
- KOL Analysis: An insightful analysis, highlighting the key opinion leaders investigating the clinical trials related to rare kidney diseases, based on several parameters, such as [A] type of KOL, [B] qualification, [C] type of organization, [D] geographical location of KOLs, [E] target disease indication, and [F] most prominent KOLs (based on our proprietary and third-party scoring criteria).
- Case Study: An insightful case study highlighting the developers engaged in offering kidney care services, along with information on [A] year of establishment, [B] company size, [C] location of headquarters, [D] target indications, [E] benefits offered by the kidney care companies, and [F] recent developments in the domain.
KEY QUESTIONS ANSWERED IN THIS REPORT
- How many companies are currently engaged in this market?
- Which are the leading companies in this market?
- What factors are likely to influence the evolution of this market?
- What is the current and future market size?
- What is the CAGR of this market?
- How is the current and future market opportunity likely to be distributed across key market segments?
- What is the patent filing activity trend in the market?
REASONS TO BUY THIS REPORT
- The report provides a comprehensive market analysis, offering detailed revenue projections of the overall market and its specific sub-segments. This information is valuable to both established market leaders and emerging entrants.
- Stakeholders can leverage the report to gain a deeper understanding of the competitive dynamics within the market. By analyzing the competitive landscape, businesses can make informed decisions to optimize their market positioning and develop effective go-to-market strategies.
- The report offers stakeholders a comprehensive overview of the market, including key drivers, barriers, opportunities, and challenges. This information empowers stakeholders to stay abreast of market trends and make data-driven decisions to capitalize on growth prospects.
ADDITIONAL BENEFITS
- Complimentary Excel Data Packs
- 10% Free Content Customization
- Detailed Report Walkthrough Session with Research Team
- Free Updated report if the report is 6-12 months old or older
TABLE OF CONTENTS
SECTION I: REPORT OVERVIEW
1. BACKGROUND
- 1.1. Context
- 1.2. Project Objectives
2. RESEARCH METHODOLOGY
- 2.1. Chapter Overview
- 2.2. Research Assumptions
- 2.2.1. Market Landscape and Market Trends
- 2.2.2. Market Forecast and Opportunity Analysis
- 2.2.3. Comparative Analysis
- 2.3. Database Building
- 2.3.1. Data Collection
- 2.3.2. Data Validation
- 2.3.3. Data Analysis
- 2.4. Project Methodology
- 2.4.1. Secondary Research
- 2.4.1.1. Annual Reports
- 2.4.1.2. Academic Research Papers
- 2.4.1.3. Company Websites
- 2.4.1.4. Investor Presentations
- 2.4.1.5. Regulatory Filings
- 2.4.1.6. White Papers
- 2.4.1.7. Industry Publications
- 2.4.1.8. Conferences and Seminars
- 2.4.1.9. Government Portals
- 2.4.1.10. Media and Press Releases
- 2.4.1.11. Newsletters
- 2.4.1.12. Industry Databases
- 2.4.1.13. Roots Proprietary Databases
- 2.4.1.14. Paid Databases and Sources
- 2.4.1.15. Social Media Portals
- 2.4.1.16. Other Secondary Sources
- 2.4.2. Primary Research
- 2.4.2.1. Types of Primary Research
- 2.4.2.1.1. Qualitative Research
- 2.4.2.1.2. Quantitative Research
- 2.4.2.1.3. Hybrid Approach
- 2.4.2.2. Advantages of Primary Research
- 2.4.2.3. Techniques for Primary Research
- 2.4.2.3.1. Interviews
- 2.4.2.3.2. Surveys
- 2.4.2.3.3. Focus Groups
- 2.4.2.3.4. Observational Research
- 2.4.2.3.5. Social Media Interactions
- 2.4.2.4. Key Opinion Leaders Considered in Primary Research
- 2.4.2.4.1. Company Executives (CXOs)
- 2.4.2.4.2. Board of Directors
- 2.4.2.4.3. Company Presidents and Vice Presidents
- 2.4.2.4.4. Research and Development Heads
- 2.4.2.4.5. Technical Experts
- 2.4.2.4.6. Subject Matter Experts
- 2.4.2.4.7. Scientists
- 2.4.2.4.8. Doctors and Other Healthcare Providers
- 2.4.2.5. Ethics and Integrity
- 2.4.2.5.1. Research Ethics
- 2.4.2.5.2. Data Integrity
- 2.4.2.1. Types of Primary Research
- 2.4.3. Analytical Tools and Databases
- 2.4.1. Secondary Research
- 2.5. Robust Quality Control
3. MARKET DYNAMICS
- 3.1. Chapter Overview
- 3.2. Forecast Methodology
- 3.2.1. Top-down Approach
- 3.2.2. Bottom-up Approach
- 3.2.3. Hybrid Approach
- 3.3. Market Assessment Framework
- 3.3.1. Total Addressable Market (TAM)
- 3.3.2. Serviceable Addressable Market (SAM)
- 3.3.3. Serviceable Obtainable Market (SOM)
- 3.3.4. Currently Acquired Market (CAM)
- 3.4. Forecasting Tools and Techniques
- 3.4.1. Qualitative Forecasting
- 3.4.2. Correlation
- 3.4.3. Regression
- 3.4.4. Extrapolation
- 3.4.5. Convergence
- 3.4.6. Sensitivity Analysis
- 3.4.7. Scenario Planning
- 3.4.8. Data Visualization
- 3.4.9. Time Series Analysis
- 3.4.10. Forecast Error Analysis
- 3.5. Key Considerations
- 3.5.1. Demographics
- 3.5.2. Government Regulations
- 3.5.3. Reimbursement Scenarios
- 3.5.4. Market Access
- 3.5.5. Supply Chain
- 3.5.6. Industry Consolidation
- 3.5.7. Pandemic / Unforeseen Disruptions Impact
- 3.6. Limitations
4. MACRO-ECONOMIC INDICATORS
- 4.1. Chapter Overview
- 4.2. Market Dynamics
- 4.2.1. Time Period
- 4.2.1.1. Historical Trends
- 4.2.1.2. Current and Forecasted Estimates
- 4.2.2. Currency Coverage
- 4.2.2.1. Major Currencies Affecting the Market
- 4.2.2.2. Factors Affecting Currency Fluctuations on the Industry
- 4.2.2.3. Impact of Currency Fluctuations on the Industry
- 4.2.3. Foreign Currency Exchange Rate
- 4.2.3.1. Impact of Foreign Exchange Rate Volatility on the Market
- 4.2.3.2. Strategies for Mitigating Foreign Exchange Risk
- 4.2.4. Recession
- 4.2.4.1. Assessment of Current Economic Conditions and Potential Impact on the Market
- 4.2.4.2. Historical Analysis of Past Recessions and Lessons Learnt
- 4.2.5. Inflation
- 4.2.5.1. Measurement and Analysis of Inflationary Pressures in the Economy
- 4.2.5.2. Potential Impact of Inflation on the Market Evolution
- 4.2.6. Interest Rates
- 4.2.6.1. Interest Rates and Their Impact on the Market
- 4.2.6.2. Strategies for Managing Interest Rate Risk
- 4.2.7. Commodity Flow Analysis
- 4.2.7.1. Type of Commodity
- 4.2.7.2. Origins and Destinations
- 4.2.7.3. Values and Weights
- 4.2.7.4. Modes of Transportation
- 4.2.8. Global Trade Dynamics
- 4.2.8.1. Import Scenario
- 4.2.8.2. Export Scenario
- 4.2.8.3. Trade Policies
- 4.2.8.4. Strategies for Mitigating the Risks Associated with Trade Barriers
- 4.2.8.5. Impact of Trade Barriers on the Market
- 4.2.9. War Impact Analysis
- 4.2.9.1. Russian-Ukraine War
- 4.2.9.2. Israel-Hamas War
- 4.2.10. COVID Impact / Related Factors
- 4.2.10.1. Global Economic Impact
- 4.2.10.2. Industry-specific Impact
- 4.2.10.3. Government Response and Stimulus Measures
- 4.2.10.4. Future Outlook and Adaptation Strategies
- 4.2.11. Other Indicators
- 4.2.11.1. Fiscal Policy
- 4.2.11.2. Consumer Spending
- 4.2.11.3. Gross Domestic Product
- 4.2.11.4. Employment
- 4.2.11.5. Taxes
- 4.2.11.6. Stock Market Performance
- 4.2.11.7. Cross Border Dynamics
- 4.2.1. Time Period
- 4.3. Conclusion
SECTION II: QUALITATIVE INSIGHTS
5. EXECUTIVE SUMMARY
6. INTRODUCTION
- 6.1. Overview of Kidney Diseases
- 6.1.1. Key Historical Events related to Kidney Diseases
- 6.1.2. Factors Contributing to the Onset of Kidney Diseases
- 6.2. Selection of Therapeutic Targets for Rare Kidney Diseases
- 6.3. Technological Advancements in the Rare Kidney Diseases Domain
- 6.4. Recent Developments in the Rare Kidney Diseases Domain
- 6.5. Future Perspectives
SECTION III: COMPETITIVE LANDSCAPE
7. MARKET LANDSCAPE
- 7.1. Rare Kidney Disease Drugs / Therapies: Market Landscape
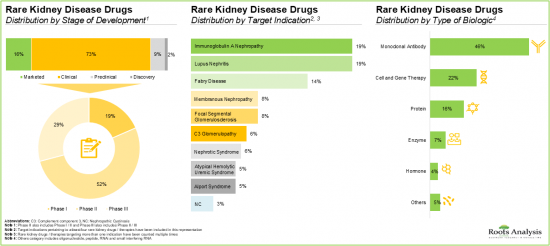
- 7.1.1. Analysis by Stage of Development
- 7.1.2. Analysis by Target Indication
- 7.1.3. Analysis by Route of Administration
- 7.1.4. Analysis by Type of Molecule
- 7.1.5. Analysis by Type of Biologic
- 7.1.6. Analysis by Dosing Frequency
- 7.1.7. Analysis by Target Patient Population
- 7.1.8. Analysis by Type of Therapy
- 7.2. Rare Kidney Disease Drugs / Therapies: Developer Landscape
- 7.2.1. Analysis by Year of Establishment
- 7.2.2. Analysis by Company Size
- 7.2.3. Analysis by Location of Headquarters
- 7.2.4. Analysis by Company Size and Location of Headquarters
- 7.2.5. Most Active Players: Analysis by Number of Drugs / Therapies Developed
8. COMPANY COMPETITIVENESS ANALYSIS
- 8.1 Methodology and Key Parameters
- 8.2. Scoring
- 8.3. Peer Groups
- 8.3.1. Overview of Developers based in North America
- 8.3.1.1. Competitiveness Analysis of Players based in North America
- 8.3.1.2. Leading Players based in North America
- 8.3.2. Overview of Developers based in Europe
- 8.3.2.1. Competitiveness Analysis of Players based in Europe
- 8.3.2.2. Leading Players based in Europe
- 8.3.3. Overview of Developers based in Asia-Pacific and Rest of the World
- 8.3.3.1. Competitiveness Analysis of Players based in Asia-Pacific and Rest of the World
- 8.3.3.2. Leading Players based in Asia-Pacific and Rest of the World
- 8.3.1. Overview of Developers based in North America
SECTION IV: COMPANY PROFILES
9. RARE KIDNEY DISEASE MARKET: COMPANY PROFILES OF DRUG / THERAPY DEVELOPERS BASED IN NORTH AMERICA
- 9.1. Chapter Overview
- 9.2. Alexion Pharmaceuticals
- 9.2.1. Company Details
- 9.2.2. Drug Portfolio
- 9.2.3. Financial Details
- 9.2.4. Recent Developments and Future Outlook
- 9.3. Biogen
- 9.3.1. Company Details
- 9.3.2. Drug Portfolio
- 9.3.3. Financial Details
- 9.3.4. Recent Developments and Future Outlook
- 9.4. NovelMed
- 9.4.1. Company Details
- 9.4.2. Drug Portfolio
- 9.4.3. Recent Developments and Future Outlook
- 9.5. Travere Therapeutics
- 9.5.1. Company Details
- 9.5.2. Drug Portfolio
- 9.5.3. Financial Details
- 9.5.4. Recent Developments and Future Outlook
- 9.6. Vertex Pharmaceuticals
- 9.6.1. Company Details
- 9.6.2. Drug Portfolio
- 9.6.3. Financial Details
- 9.6.4. Recent Developments and Future Outlook
- 9.7. Amgen
- 9.7.1. Company Details
- 9.7.2. Drug Portfolio
- 9.8. Vera Therapeutics
- 9.8.1. Company Details
- 9.8.2. Drug Portfolio
- 9.9. ZyVersa Therapeutics
- 9.9.1. Company Details
- 9.9.2. Drug Portfolio
10. RARE KIDNEY DISEASE MARKET: COMPANY PROFILES OF DRUG / THERAPY DEVELOPERS BASED IN EUROPE
- 10.1. Chapter Overview
- 10.2. Novartis
- 10.2.1. Company Details
- 10.2.2. Drug Portfolio
- 10.2.3. Financial Details
- 10.2.4. Recent Developments and Future Outlook
- 10.3. Roche
- 10.3.1. Company Details
- 10.3.2. Drug Portfolio
- 10.3.3. Financial Details
- 10.3.4. Recent Developments and Future Outlook
- 10.4. Advicenne
- 10.4.1. Company Details
- 10.4.2. Drug Portfolio
- 10.5. Boehringer Ingelheim
- 10.5.1. Company Details
- 10.5.2. Drug Portfolio
- 10.6. Calliditas Therapeutics
- 10.6.1. Company Details
- 10.6.2. Drug Portfolio
11. RARE KIDNEY DISEASE MARKET: COMPANY PROFILES OF DRUG / THERAPY DEVELOPERS BASED IN ASIA-PACIFIC
- 11.1. Chapter Overview
- 11.2. Jiangsu Hengrui Pharmaceuticals
- 11.2.1. Company Details
- 11.2.2. Drug Portfolio
- 11.2.3. Recent Developments and Future Outlook
- 11.2. Asahi Kasei
- 11.2.1. Company Details
- 11.2.2. Drug Portfolio
SECTION V: MARKET TRENDS
12. PARTNERSHIPS AND COLLABORATIONS
- 12.1. Partnership Models
- 12.2. Rare Kidney Disease Drugs / Therapies: Partnerships and Collaborations
- 12.2.1. Analysis by Year of Partnership
- 12.2.2. Analysis by Type of Partnership
- 12.2.3. Analysis by Year and Type of Partnership
- 12.2.4. Analysis by Target Disease Indication
- 12.2.5. Analysis by Type of Partner
- 12.2.6. Most Active Players: Analysis by Number of Partnerships
- 12.2.7. Local and International Deals
- 12.2.8. Intercontinental and Intracontinental Deals
13. FUNDING AND INVESTMENTS
- 13.1. Funding Models
- 13.2. Funding Lifecycle Analysis
- 13.3. Investment Case: Risk and Return
- 13.4. Rare Kidney Disease Drugs / Therapies: Funding and Investments
- 13.4.1. Analysis of Funding Instances by Year of Funding
- 13.4.2. Analysis of Funding Instances by Type of Funding
- 13.4.3. Analysis of Funding Instances by Year and Type of Funding
- 13.4.4. Analysis of Amount Invested by Year of Funding
- 13.4.5. Analysis of Amount Invested by Type of Funding
- 13.4.6. Analysis of Amount Invested by Year and Type of Funding
- 13.4.7. Analysis of Funding Instances by Target Disease Indication
- 13.4.8. Analysis of Funding Instances by Geography (Region)
- 13.4.9. Analysis of Funding Instances by Geography (Country)
- 13.4.10. Most Active Players: Analysis by Number of Funding Instances
- 13.4.11. Most Active Players: Analysis by Amount Invested
- 13.4.12. Leading Investors: Analysis by Number of Funding Instances
- 13.5. Summary of Investments
14. CLINICAL TRIAL ANALYSIS
- 14.1. Methodology and Key Parameters
- 14.2. Rare Kidney Disease Drugs / Therapies: Clinical Trial Analysis
- 14.2.1. Analysis by Trial Registration Year
- 14.2.2. Analysis by Trial Status
- 14.2.3. Analysis by Trial Registration Year and Trial Status
- 14.2.4. Analysis by Trial Registration Year and Patients Enrolled
- 14.2.5. Analysis by Trial Status and Patients Enrolled
- 14.2.6. Analysis by Trial Phase
- 14.2.7. Analysis by Patients Enrolled and Trial Phase
- 14.2.8. Analysis by Study Design
- 14.2.9. Analysis by Type of Sponsor
- 14.2.10. Analysis by Patient Gender
- 14.2.11. Most Active Industry Players: Analysis by Number of Trials
- 14.2.12. Most Active Non-Industry Players: Analysis by Number of Trials
- 14.2.13. Analysis by Geography
- 14.2.13.1. Analysis by Trial Status, Trial Phase and Geography
- 14.2.13.2. Analysis by Trial Status and Geography
- 14.2.14. Geographical Distribution of Trials and Number of Patients Enrolled
- 14.2.14.1. Clinical Trials in North America: Key Insights
- 14.2.14.2. Clinical Trials in Europe: Key Insights
- 14.2.14.3. Clinical Trials in Asia-Pacific: Key Insights
- 14.2.14.4. Clinical Trials in Rest of the World: Key Insights
15. CLINICAL COMMERCIAL ATTRACTIVENESS
- 15.1. Methodology and Key Parameters
- 15.2. Scoring
- 15.3. Phase III Drugs / Therapies Targeting Rare Kidney Diseases
16. KEY OPINION LEADERS
- 16.1. Methodology and Key Parameters
- 16.2. Rare Kidney Disease Drugs / Therapies: Key Opinion Leaders
- 16.2.1. Analysis by Type of Key Opinion Leader
- 16.2.2. Analysis by Qualification
- 16.2.3. Analysis by Type of Organization
- 16.2.4. Analysis by Target Disease Indication
- 16.2.5. Analysis by Region of Key Opinion Leaders
- 16.3. Scoring Criteria
- 16.3.1. Most Prominent Key Opinion Leaders
- 16.3.2. Benchmarking: Roots Analysis' Assessment vs Third Party Scores
17. RARE KIDNEY DISEASE MARKET: CASE STUDY
- 17.1. Methodology
- 17.2. Rare Kidney Disease Market: List of Kidney Care Companies
- 17.3. Benefits Offered by Kidney Care Companies
- 17.4. Recent Developments
SECTION VI: MARKET FORECAST AND OPPORTUNITY ANALYSIS
18. MARKET IMPACT ANALYSIS: DRIVERS, RESTRAINTS, OPPORTUNITIES AND CHALLENGES
- 18.1. Chapter Overview
- 18.2. Market Drivers
- 18.3. Market Restraints
- 18.4. Market Opportunities
- 18.5. Market Challenges
- 18.6. Conclusion
19. RARE KIDNEY DISEASE MARKET
- 19.1. Key Assumptions and Methodology
- 19.2. Global Rare Kidney Disease Market: Historical Trends and Forecasted Estimates, till 2040
- 19.2.1. Comparison with Previous Edition
- 19.2.2. Multivariate Scenario Analysis
- 19.2.2.1. Conservative Scenario
- 19.2.2.2. Optimistic Scenario
- 19.3. Key Market Segmentations
20. RARE KIDNEY DISEASE MARKET, BY TARGET DISEASE INDICATION
- 20.1. Rare Kidney Disease Market: Distribution by Target Disease Indication
- 20.1.1. Rare Kidney Disease Market for Lupus Nephritis: Historical Trends and Forecasted Estimates, till 2040
- 20.1.2. Rare Kidney Disease Market for Immunoglobulin A Nephropathy: Historical Trends and Forecasted Estimates, till 2040
- 20.1.3. Rare Kidney Disease Market for Fabry Disease: Historical Trends and Forecasted Estimates, till 2040
- 20.1.4. Rare Kidney Disease Market for Atypical Hemolytic Uremic Syndrome: Historical Trends and Forecasted Estimates, till 2040
- 20.1.5. Rare Kidney Disease Market for Focal Segmental Glomerulosclerosis: Historical Trends and Forecasted Estimates, till 2040
- 20.1.6. Rare Kidney Disease Market for Others: Historical Trends and Forecasted Estimates, till 2040
21. RARE KIDNEY DISEASE MARKET, BY TYPE OF MOLECULE
- 21.1. Rare Kidney Disease Market: Distribution by Type of Molecule
- 21.1.1. Rare Kidney Disease Market for Small Molecules: Historical Trends and Forecasted Estimates, till 2040
- 21.1.2. Rare Kidney Disease Market for Biologics: Historical Trends and Forecasted Estimates, till 2040
22. RARE KIDNEY DISEASE MARKET, BY TYPE OF BIOLOGIC
- 22.1. Rare Kidney Disease Market: Distribution by Type of Biologic
- 22.1.1. Rare Kidney Disease Market for Monoclonal Antibodies: Historical Trends and Forecasted Estimates, till 2040
- 22.1.2. Rare Kidney Disease Market for Enzymes: Historical Trends and Forecasted Estimates, till 2040
- 22.1.3. Rare Kidney Disease Market for Proteins: Historical Trends and Forecasted Estimates, till 2040
- 22.1.4. Rare Kidney Disease Market for Hormones: Historical Trends and Forecasted Estimates, till 2040
23. RARE KIDNEY DISEASE MARKET, BY ROUTE OF ADMINISTRATION
- 23.1. Rare Kidney Disease Market: Distribution by Route of Administration
- 23.1.1. Rare Kidney Disease Market for Oral Route: Historical Trends and Forecasted Estimates, till 2040
- 23.1.2. Rare Kidney Disease Market for Intravenous Route: Historical Trends and Forecasted Estimates, till 2040
- 23.1.3. Rare Kidney Disease Market for Subcutaneous Route: Historical Trends and Forecasted Estimates, till 2040
24. RARE KIDNEY DISEASE MARKET, BY TYPE OF THERAPY
- 24.1. Rare Kidney Disease Market: Distribution by Type of Therapy
- 24.1.1. Rare Kidney Disease Market for Monotherapy: Historical Trends and Forecasted Estimates, till 2040
- 24.1.2. Rare Kidney Disease Market for Combination Therapy: Historical Trends and Forecasted Estimates, till 2040
25. RARE KIDNEY DISEASE MARKET, BY KEY GEOGRAPHICAL REGIONS
- 25.1. Rare Kidney Disease Market: Distribution by Key Geographical Regions
- 25.1.1. Rare Kidney Disease Market in North America: Historical Trends and Forecasted Estimates, till 2040
- 25.1.1.1. Rare Kidney Disease Market in the US: Historical Trends and Forecasted Estimates, till 2040
- 25.1.1.2. Rare Kidney Disease Market in Canada: Historical Trends and Forecasted Estimates, till 2040
- 25.1.2. Rare Kidney Disease Market in Europe: Historical Trends and Forecasted Estimates, till 2040
- 25.1.2.1. Rare Kidney Disease Market in Germany: Historical Trends and Forecasted Estimates, till 2040
- 25.1.2.2. Rare Kidney Disease Market in UK: Historical Trends and Forecasted Estimates, till 2040
- 25.1.2.3. Rare Kidney Disease Market in Spain: Historical Trends and Forecasted Estimates, till 2040
- 25.1.2.4. Rare Kidney Disease Market in France: Historical Trends and Forecasted Estimates, till 2040
- 25.1.2.5. Rare Kidney Disease Market in the Italy: Historical Trends and Forecasted Estimates, till 2040
- 25.1.3. Rare Kidney Disease Market in Asia-Pacific: Historical Trends and Forecasted Estimates, till 2040
- 25.1.3.1. Rare Kidney Disease Market in China: Historical Trends and Forecasted Estimates, till 2040
- 25.1.3.2. Rare Kidney Disease Market in India: Historical Trends and Forecasted Estimates, till 2040
- 25.1.3.3. Rare Kidney Disease Market in South Korea: Historical Trends and Forecasted Estimates, till 2040
- 25.1.3.4. Rare Kidney Disease Market in Japan: Historical Trends and Forecasted Estimates, till 2040
- 25.1.3.5. Rare Kidney Disease Market in Australia: Historical Trends and Forecasted Estimates, till 2040
- 25.1.3.6. Rare Kidney Disease Market in Taiwan: Historical Trends and Forecasted Estimates, till 2040
- 25.1.1. Rare Kidney Disease Market in North America: Historical Trends and Forecasted Estimates, till 2040
26. RARE KIDNEY DISEASE MARKET, SALES FORECAST OF DRUGS
- 26.1. Approved Rare Kidney Disease Drugs / Therapies: Sales Forecast
- 26.1.1. Benlysta(R): Sales Forecast
- 26.1.2. Elfabrio(R): Sales Forecast
- 26.1.3. FILSPARI(R): Sales Forecast
- 26.1.4. Galafold(R): Sales Forecast
- 26.1.5. LUPKYNIS(R): Sales Forecast
- 26.1.6. Sibnayal(R): Sales Forecast
- 26.1.7. Tarpeyo(R): Sales Forecast
- 26.1.8. TERLIVAZ(R): Sales Forecast
- 26.1.9. ULTOMIRIS(R): Sales Forecast
- 26.2. Phase III Rare Kidney Disease Drugs / Therapies: Sales Forecast
- 26.2.1. ALPN-303 (Immunoglobulin A Nephropathy): Sales Forecast
- 26.2.2. APL-2 (C3 Glomerulopathy): Sales Forecast
- 26.2.3. APL-2 (Membranous Nephropathy): Sales Forecast
- 26.2.4. Atacicept (Immunoglobulin A Nephropathy): Sales Forecast
- 26.2.5. Atacicept (Lupus Nephritis): Sales Forecast
- 26.2.6. Atrasentan (Immunoglobulin A Nephropathy): Sales Forecast
- 26.2.7. Crovalimab (Atypical Hemolytic Uremic Syndrome): Sales Forecast
- 26.2.8. FILSPARI(R) (Focal Segmental Glomerulosclerosis): Sales Forecast
- 26.2.9. Ianalumab (Lupus Nephritis): Sales Forecast
- 26.2.10. Iptacopan (Atypical Hemolytic Uremic Syndrome): Sales Forecast
- 26.2.11. Iptacopan (C3 Glomerulopathy): Sales Forecast
- 26.2.12. Iptacopan (Immunoglobulin A Nephropathy): Sales Forecast
- 26.2.13. Lucerastat (Fabry Disease): Sales Forecast
- 26.2.14. MIL62 (Membranous Nephropathy): Sales Forecast
- 26.2.15. Obinutuzumab (Nephrotic Syndrome): Sales Forecast
- 26.2.16. Obinutuzumab (Membranous Nephropathy): Sales Forecast
- 26.2.17. Obinutuzumab (Lupus Nephritis): Sales Forecast
- 26.2.18. Repagermanium (Focal Segmental Glomerulosclerosis): Sales Forecast
- 26.2.19. Saphnelo(TM) (Lupus Nephritis): Sales Forecast
- 26.2.20. Sibeprenlimab (Immunoglobulin A Nephropathy): Sales Forecast
- 26.2.21. SNP-ACTH (Membranous Nephropathy): Sales Forecast
- 26.2.22. Telitacicept (Immunoglobulin A Nephropathy): Sales Forecast
- 26.2.23. Tolvaptan (Autosomal Recessive Polycystic Kidney Disease): Sales Forecast
- 26.2.24. ULTOMIRIS(R) (Immunoglobulin A Nephropathy): Sales Forecast
- 26.2.25. Venglustat (Fabry Disease): Sales Forecast
- 26.2.26. Zigakibart (Immunoglobulin A Nephropathy): Sales Forecast
27. RARE KIDNEY DISEASE MARKET, BY LEADING DRUG DEVELOPERS
SECTION VII: OTHER EXCLUSIVE INSIGHTS
28. CONCLUDING INSIGHTS
29. INSIGHTS FROM PRIMARY RESEARCH
SECTION VIII: APPENDICES
30. TABULATED DATA
31. LIST OF COMPANIES AND ORGANIZATIONS
List of Tables
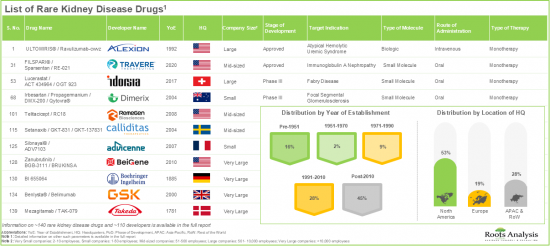
- Table 7.1 List of Rare Kidney Disease Drugs / Therapies
- Table 7.2 List of Rare Kidney Disease Drug / Therapy Developers
- Table 9.1 Alexion Pharmaceuticals: Drug Portfolio
- Table 9.2 Biogen: Drug Portfolio
- Table 9.3 NovelMed: Drug Portfolio
- Table 9.4 Travere Therapeutics: Drug Portfolio
- Table 9.5 Vertex Pharmaceuticals: Drug Portfolio
- Table 9.6 Amgen: Drug Portfolio
- Table 9.7 Vera Therapeutics: Drug Portfolio
- Table 9.8 ZyVersa Therapeutics: Drug Portfolio
- Table 10.1 Novartis: Drug Portfolio
- Table 10.2 Roche: Drug Portfolio
- Table 10.3 Advicenne: Drug Portfolio
- Table 10.4 Boehringer Ingelheim: Drug Portfolio
- Table 10.5 Calliditas Therapeutics: Drug Portfolio
- Table 11.1 Jiangsu Hengrui Pharmaceuticals: Drug Portfolio
- Table 11.2 Asahi Kasei: Drug Portfolio
- Table 12.1 Rare Kidney Disease Drugs / Therapies: List of Partnerships and Collaborations, since 2019
- Table 13.1 Rare Kidney Disease Drugs / Therapies: List of Funding and Investments, since 2019
- Table 14.1. Rare Kidney Disease Drugs / Therapies: List of Clinical Trials, since 2019
- Table 16.1. Rare Kidney Disease Drugs / Therapies: List of Key Opinion Leaders
- Table 17.1 Rare Kidney Disease Market: List of Kidney Care Companies
- Table 19.1 Rare Kidney Disease Therapies: List of Forecasted Therapies
- Table 30.1 Rare Kidney Disease Drugs / Therapies: Distribution by Stage of Development
- Table 30.2 Rare Kidney Disease Drugs / Therapies: Distribution by Target Indication
- Table 30.3 Rare Kidney Disease Drugs / Therapies: Distribution by Route of Administration
- Table 30.4 Rare Kidney Disease Drugs / Therapies: Distribution by Type of Molecule
- Table 30.5 Rare Kidney Disease Drugs / Therapies: Distribution by Type of Biologic
- Table 30.6 Rare Kidney Disease Drugs / Therapies: Distribution by Dosing Frequency
- Table 30.7 Rare Kidney Disease Drugs / Therapies: Distribution by Target Patient Population
- Table 30.8 Rare Kidney Disease Drugs / Therapies: Distribution by Type of Therapy
- Table 30.9 Rare Kidney Disease Drug / Therapy Developers: Distribution by Year of Establishment
- Table 30.10 Rare Kidney Disease Drug / Therapy Developers: Distribution by Company Size
- Table 30.11 Rare Kidney Disease Drug / Therapy Developers: Distribution by Location of Headquarters
- Table 30.12 Rare Kidney Disease Drug / Therapy Developers: Distribution by Company Size and Location of Headquarters
- Table 30.13 Most Active Players: Analysis by Number of Drugs / Therapies Developed
- Table 30.14 Rare Kidney Disease Drug / Therapies Developers based in North America: Distribution by Company Size
- Table 30.15 Rare Kidney Disease Drug / Therapies Developers based in North America: Distribution by Stage of Development
- Table 30.16 Rare Kidney Disease Drug / Therapies Developers based in North America: Distribution by Type of Molecule
- Table 30.17 Rare Kidney Disease Drug / Therapies Developers based in Europe: Distribution by Company Size
- Table 30.18 Rare Kidney Disease Drug / Therapies Developers based in Europe: Distribution by Type of Molecule
- Table 30.19 Rare Kidney Disease Drug / Therapies Developers based in Europe: Distribution by Route of Administration
- Table 30.20 Rare Kidney Disease Drug / Therapies Developers based in Asia-Pacific and Rest of the World: Distribution by Company Size
- Table 30.21 Rare Kidney Disease Drug / Therapies Developers based in Asia-Pacific and Rest of the World: Distribution by Stage of Development
- Table 30.22 Rare Kidney Disease Drug / Therapies Developers based in Asia-Pacific and Rest of the World: Distribution by Type of Molecule
- Table 30.23 Alexion Pharmaceuticals: Annual Revenues, since FY 2021 (USD Billion)
- Table 30.24 Biogen: Annual Revenues, since FY 2021 (USD Billion)
- Table 30.25 Travere Therapeutics: Annual Revenues, since FY 2021 (USD Million)
- Table 30.26 Vertex Pharmaceuticals: Annual Revenues, since FY 2021 (USD Billion)
- Table 30.27 Novartis: Annual Revenues, since FY 2021 (USD Billion)
- Table 30.28 Roche: Annual Revenues, since FY 2021 (CHF Billion)
- Table 30.29 Partnerships and Collaborations: Distribution by Year of Partnership
- Table 30.30 Partnerships and Collaborations: Distribution by Type of Partnership
- Table 30.31 Partnerships and Collaborations: Distribution by Year and Type of Partnership
- Table 30.32 Partnerships and Collaborations: Distribution by Target Disease Indication
- Table 30.33 Partnerships and Collaborations: Distribution by Type of Partner
- Table 30.34 Most Active Players: Distribution by Number of Partnerships
- Table 30.35 Partnerships and Collaborations: Local and International Deals
- Table 30.36 Partnerships and Collaborations: Intercontinental and Intracontinental Deals
- Table 30.37 Funding and Investments: Distribution of Funding Instances by Year of Funding
- Table 30.38 Funding and Investments: Distribution of Funding Instances by Type of Funding
- Table 30.39 Funding and Investments: Distribution of Funding Instances by Year and Type of Funding
- Table 30.40 Funding and Investments: Distribution of Amount Invested by Year of Funding
- Table 30.41 Funding and Investments: Distribution of Amount Invested by Type of Funding
- Table 30.42 Funding and Investments: Distribution of Amount Invested by Year and Type of Funding
- Table 30.43 Funding and Investments: Distribution of Funding Instances by Target Disease Indication
- Table 30.44 Funding and Investments: Distribution of Funding Instances by Geography (Region)
- Table 30.45 Funding and Investments: Distribution of Funding Instances by Geography (Country)
- Table 30.46 Most Active Players: Distribution by Number of Instances
- Table 30.47 Most Active Players: Distribution by Amount Invested
- Table 30.48 Leading Investors: Distribution by Number of Funding Instances
- Table 30.49 Funding and Investments: Summary
- Table 30.50 Clinical Trial Analysis: Distribution by Trial Registration Year
- Table 30.51 Clinical Trial Analysis: Distribution by Trial Status
- Table 30.52 Clinical Trial Analysis: Distribution by Trial Registration Year and Trial Status
- Table 30.53 Clinical Trial Analysis: Distribution by Trial Registration Year and Patients Enrolled
- Table 30.54 Clinical Trial Analysis: Distribution by Trial Status and Patients Enrolled
- Table 30.55 Clinical Trial Analysis: Distribution by Trial Phase
- Table 30.56 Clinical Trial Analysis: Distribution by Patients Enrolled and Trial Phase
- Table 30.57 Clinical Trial Analysis: Distribution by Study Design
- Table 30.58 Clinical Trial Analysis: Distribution by Type of Sponsor
- Table 30.59 Clinical Trial Analysis: Distribution by Patient Gender
- Table 30.60 Most Active Industry Players: Distribution by Number of Trials
- Table 30.61 Most Active Non-Industry Players: Distribution by Number of Trials
- Table 30.62 Distribution by Trial Status, Trial Phase and Geography
- Table 30.63 Distribution of Clinical Trials by Trial Status and Geography
- Table 30.64 Distribution of Patients Enrolled by Trial Status and Geography
- Table 30.65 Clinical Trials in North America: Key Insights
- Table 30.66 Clinical Trials in Europe: Key Insights
- Table 30.67 Clinical Trials in Asia-Pacific: Key Insights
- Table 30.68 Clinical Trials in Rest of the World: Key Insights
- Table 30.69 Rare Kidney Disease Drugs / Therapies KOL Analysis: Distribution by Type of KOL
- Table 30.70 Rare Kidney Disease Drugs / Therapies KOL Analysis: Distribution by Qualification
- Table 30.71 Rare Kidney Disease Drugs / Therapies KOL Analysis: Distribution by Type of Organization
- Table 30.72 Rare Kidney Disease Drugs / Therapies KOL Analysis: Distribution by Target Disease Indication
- Table 30.73 Rare Kidney Disease Drugs / Therapies KOL Analysis: Distribution by Geographical Location
- Table 30.74 Benchmarking: Roots Analysis' Assessment vs Third Party Scores
- Table 30.75 Rare Kidney Disease Market, Historical Trends and Forecasted Estimates, till 2040 (USD Billion)
- Table 30.76 Global Rare Kidney Disease Market, Historical Trends and Forecasted Estimates, till 2040: Conservative Scenario (USD Billion)
- Table 30.77 Global Rare Kidney Disease Market, Historical Trends and Forecasted Estimates, till 2040: Optimistic Scenario (USD Billion)
- Table 30.78 Rare Kidney Disease Market: Distribution by Target Disease Indication
- Table 30.79 Rare Kidney Disease Market for Lupus Nephritis: Historical Trends and Forecasted Estimates, till 2040 (USD Million)
- Table 30.80 Rare Kidney Disease Market for Immunoglobulin A Nephropathy: Historical Trends and Forecasted Estimates, till 2040 (USD Million)
- Table 30.81 Rare Kidney Disease Market for Fabry Disease: Historical Trends and Forecasted Estimates, till 2040 (USD Million)
- Table 30.82 Rare Kidney Disease Market for Atypical Hemolytic Uremic Syndrome: Historical Trends and Forecasted Estimates, till 2040 (USD Million)
- Table 30.83 Rare Kidney Disease Market for Focal Segmental Glomerulosclerosis: Historical Trends and Forecasted Estimates, till 2040 (USD Million)
- Table 30.84 Rare Kidney Disease Market for Others: Historical Trends and Forecasted Estimates, till 2040 (USD Million)
- Table 30.85 Rare Kidney Disease Market: Distribution by Type of Molecule
- Table 30.86 Rare Kidney Disease Market for Small Molecules: Historical Trends and Forecasted Estimates, till 2040 (USD Million)
- Table 30.87 Rare Kidney Disease Market for Biologics: Historical Trends and Forecasted Estimates, till 2040 (USD Million)
- Table 30.88 Rare Kidney Disease Market: Distribution by Type of Biologic
- Table 30.89 Rare Kidney Disease Market for Monoclonal Antibodies: Historical Trends and Forecasted Estimates, till 2040 (USD Million)
- Table 30.90 Rare Kidney Disease Market for Enzymes: Historical Trends and Forecasted Estimates, till 2040 (USD Million)
- Table 30.91 Rare Kidney Disease Market for Proteins: Historical Trends and Forecasted Estimates, till 2040 (USD Million)
- Table 30.92 Rare Kidney Disease Market for Hormones: Historical Trends and Forecasted Estimates, till 2040 (USD Million)
- Table 30.93 Rare Kidney Disease Market: Distribution by Route of Administration
- Table 30.94 Rare Kidney Disease Market for Oral Route: Historical Trends and Forecasted Estimates, till 2040 (USD Million)
- Table 30.95 Rare Kidney Disease Market for Intravenous Route: Historical Trends and Forecasted Estimates, till 2040 (USD Million)
- Table 30.96 Rare Kidney Disease Market for Subcutaneous Route: Historical Trends and Forecasted Estimates, till 2040 (USD Million)
- Table 30.97 Rare Kidney Disease Market: Distribution by Type of Therapy
- Table 30.98 Rare Kidney Disease Market for Monotherapy: Historical Trends and Forecasted Estimates, till 2040 (USD Million)
- Table 30.99 Rare Kidney Disease Market for Combination Therapy: Historical Trends and Forecasted Estimates, till 2040 (USD Million)
- Table 30.100 Rare Kidney Disease Market: Distribution by Key Geographical Regions
- Table 30.101 Rare Kidney Disease Market in North America: Historical Trends and Forecasted Estimates, till 2040 (USD Million)
- Table 30.102 Rare Kidney Disease Market in the US: Historical Trends and Forecasted Estimates, till 2040 (USD Million)
- Table 30.103 Rare Kidney Disease Market in Canada: Historical Trends and Forecasted Estimates, till 2040 (USD Million)
- Table 30.104 Rare Kidney Disease Market in Europe: Historical Trends and Forecasted Estimates, till 2040 (USD Million)
- Table 30.105 Rare Kidney Disease Market in Germany: Historical Trends and Forecasted Estimates, till 2040 (USD Million)
- Table 30.106 Rare Kidney Disease Market in UK: Historical Trends and Forecasted Estimates, till 2040 (USD Million)
- Table 30.107 Rare Kidney Disease Market in Spain: Historical Trends and Forecasted Estimates, till 2040 (USD Million)
- Table 30.108 Rare Kidney Disease Market in France: Historical Trends and Forecasted Estimates, till 2040 (USD Million)
- Table 30.109 Rare Kidney Disease Market in Italy: Historical Trends and Forecasted Estimates, till 2040 (USD Million)
- Table 30.110 Rare Kidney Disease Market in Asia-Pacific: Historical Trends and Forecasted Estimates, till 2040 (USD Million)
- Table 30.111 Rare Kidney Disease Market in China: Historical Trends and Forecasted Estimates, till 2040 (USD Million)
- Table 30.112 Rare Kidney Disease Market in India: Historical Trends and Forecasted Estimates, till 2040 (USD Million)
- Table 30.113 Rare Kidney Disease Market in South Korea: Historical Trends and Forecasted Estimates, till 2040 (USD Million)
- Table 30.114 Rare Kidney Disease Market in Japan: Historical Trends and Forecasted Estimates, till 2040 (USD Million)
- Table 30.115 Rare Kidney Disease Market in Australia: Historical Trends and Forecasted Estimates, till 2040 (USD Million)
- Table 30.116 Rare Kidney Disease Market in Taiwan: Historical Trends and Forecasted Estimates, till 2040 (USD Million)
- Table 30.117 Benlysta(R) (Lupus Nephritis): Sales Forecast (USD Million)
- Table 30.118 Elfabrio(R) (Fabry Disease): Sales Forecast (USD Million)
- Table 30.119 FILSPARI(R) (Immunoglobulin A Nephropathy): Sales Forecast (USD Million)
- Table 30.120 FABHALTA(R) (Immunoglobulin A Nephropathy): Sales Forecast (USD Million)
- Table 30.121 Galafold(R) (Fabry Disease): Sales Forecast (USD Million)
- Table 30.122 LUPKYNIS(R) (Lupus Nephritis): Sales Forecast (USD Million)
- Table 30.123 Sibnayal(R) (Distal Renal Tubular Acidosis): Sales Forecast (USD Million)
- Table 30.124 Tarpeyo(R) (Immunoglobulin A Nephropathy): Sales Forecast (USD Million)
- Table 30.125 TERLIVAZ(R) (Hepatorenal Syndrome): Sales Forecast (USD Million)
- Table 30.126 ULTOMIRIS(R) (Atypical Hemolytic Uremic Syndrome): Sales Forecast (USD Million)
- Table 30.127 ALPN-303 (Immunoglobulin A Nephropathy): Sales Forecast (USD Million)
- Table 30.128 APL-2 (C3 Glomerulopathy): Sales Forecast (USD Million)
- Table 30.129 APL-2 (Membranous Nephropathy): Sales Forecast (USD Million)
- Table 30.130 Atacicept (Immunoglobulin A Nephropathy): Sales Forecast (USD Million)
- Table 30.131 Atacicept (Lupus Nephritis): Sales Forecast (USD Million)
- Table 30.132 Atrasentan (Immunoglobulin A Nephropathy): Sales Forecast (USD Million)
- Table 30.133 Crovalimab (Atypical Hemolytic Uremic Syndrome): Sales Forecast (USD Million)
- Table 30.134 FILSPARI(R) (Focal Segmental Glomerulosclerosis): Sales Forecast (USD Million)
- Table 30.135 Ianalumab (Lupus Nephritis): Sales Forecast (USD Million)
- Table 30.136 Iptacopan (Atypical Hemolytic Uremic Syndrome): Sales Forecast (USD Million)
- Table 30.137 Iptacopan (C3 Glomerulopathy): Sales Forecast (USD Million)
- Table 30.138 Lucerastat (Fabry Disease): Sales Forecast (USD Million)
- Table 30.139 MIL62 (Membranous Nephropathy): Sales Forecast (USD Million)
- Table 30.140 Obinutuzumab (Nephrotic Syndrome): Sales Forecast (USD Million)
- Table 30.141 Obinutuzumab (Membranous Nephropathy): Sales Forecast (USD Million)
- Table 30.142 Obinutuzumab (Lupus Nephritis): Sales Forecast (USD Million)
- Table 30.143 Repagermanium (Focal Segmental Glomerulosclerosis): Sales Forecast (USD Million)
- Table 30.144 Saphnelo(TM) (Lupus Nephritis): Sales Forecast (USD Million)
- Table 30.145 Sibeprenlimab (Immunoglobulin A Nephropathy): Sales Forecast (USD Million)
- Table 30.146 SNP-ACTH (Membranous Nephropathy): Sales Forecast (USD Million)
- Table 30.147 Telitacicept (Immunoglobulin A Nephropathy): Sales Forecast (USD Million)
- Table 30.148 Tolvaptan (Autosomal Recessive Polycystic Kidney Disease): Sales Forecast (USD Million)
- Table 30.149 ULTOMIRIS(R) (Immunoglobulin A Nephropathy): Sales Forecast (USD Million)
- Table 30.150 Venglustat (Fabry Disease): Sales Forecast (USD Million)
- Table 30.151 Zigakibart (Immunoglobulin A Nephropathy): Sales Forecast (USD Million)
- Table 30.152 Rare Kidney Disease Market: Distribution by Leading Players, 2025 (based on revenues generated) (USD Billion)
- Table 30.153 Rare Kidney Disease Market: Distribution by Leading Players, 2035 (based on revenues generated) (USD Billion)
 腎臟病治療市場規模、佔有率和成長分析:按疾病類型、藥物類別、給藥途徑、最終用戶和地區分類-2026-2033年產業預測
 罕見腎臟病市場分析及預測(至2035年):按類型、產品類型、服務、技術、組件、應用、最終用戶、設備、流程和解決方案分類
 2026-2034年全球罕見腎臟病治療市場規模、佔有率、趨勢和成長分析報告
 末期腎功能衰竭治療市場按治療類型、最終用戶和分銷管道分類,全球預測(2026-2032年)
 常染色體顯性多囊性腎病變(ADPKD):市場展望、流行病學、競爭格局、市場預測報告(2025-2035年)原發性膜性腎臟病(PMN):市場展望、流行病學、競爭格局、市場預測報告(2025-2035年)
 常染色體顯性多囊性腎病變市場 - 全球及區域 - 分析與預測(2025-2035)