


|
市場調查報告書
商品編碼
1881278
能源與永續發展追蹤報告 - 電信業者(2025):與 Teral Research 合作進行的最新研究 - 2024 年電信業者的能源消耗量保持穩定,但由於採用再生能源和範圍 3 減排措施,溫室氣體排放量持續下降Energy & Sustainability Tracker - Telcos, 2025: New Joint Study with Teral Research - Telco Energy Use Flatlined in 2024, but GHG Emissions Fell Again Due to Renewables and Scope 3 Efforts |
|||||||
氣候變遷正日益成為一個嚴峻的問題,所有產業都必須應對這項挑戰。資訊通信技術 (ICT) 產業也不例外。網路營運商消耗大量能源,碳足跡龐大。雖然 ICT 的成長主要由超大規模企業投資建置用於雲端運算和人工智慧的資料中心所驅動,但電信業者面臨更大的能源挑戰。 2024 年,電信業者的能源消耗量為 340.6 太瓦時 (TWh),即 340,572 吉瓦時 (GWh),是網路規模營運商能源消耗量的兩倍多。由於再生能源採用率低,電信業者的碳足跡也高出數倍。電信業者為提升網路營運的永續性所做的努力至關重要。
經濟因素也同樣重要。電信業者平均將營運支出的 4-5% 用於能源,部分業者的能源支出甚至超過 10%。這些成本的波動性是一個主要問題。自然災害、戰爭和貿易限制都會影響碳基能源的價格。氣候變遷本身也會因極端天氣增加和人口遷移而增加對進口化石燃料的依賴風險。相較之下,本地風能、太陽能和水力發電等再生能源的價格往往更加穩定。因此,向碳中和轉型可以穩定電信業者的平均成本模式。
視覺效果
本報告對電信業的能源使用和永續性進行了詳細評估。報告分析了66家電信業者的能源消耗、再生能源使用和排放量,這些業者約佔全球市場佔有率的85%。報告考察了整個全球電信業,並提供了所有公司的能源使用、效率和排放量指標。報告還包含排名,重點介紹了行業領導者、近期取得改進的公司以及落後者(這些落後者通常需要供應商的支持來提高效率和可再生能源組合)。
報告也根據所有66家電信業者的ESG報告,提供了他們的能源使用情況以及範圍1和範圍2的排放數據。其中 50 家業者揭露了足夠的範圍 3 數據,從而可以進行價值鏈分析。此外,32 家公司公佈了流量數據,從而可以分析諸如單位能耗傳輸量等指標。
本分析是 MTN Consulting 為期五年的電信業者能源使用研究的延伸。它基於其專有的電信財務追蹤器,該追蹤器包含截至 2025 年 6 月的市場數據。本報告補充了新收集的財務數據,包括 2019 年至 2024 年所有 66 家公司的淨資產、廠房和設備。
MTN Consulting 與 Teral Research 合作
本報告是 MTN Consulting 與 Teral Research (TR) 合資成立的新服務 "電信能源與永續發展 (TES)" 的首份成果。
目標機構:
|
|
目錄
第 1 章概述
第二章分析
第三章全球市場成果
第四章:公司業績
第五章:排名
第六章:原始資料
第七章:關於我們
Why this report
Climate change is worsening, and every sector must help meet this challenge. The ICT sector is no exception. Within ICT, network operators consume enormous amounts of energy and have a massive carbon footprint. While the growth in ICT comes from webscale operators (aka hyperscalers) investing in data centers for cloud and AI, the telco sector remains a larger energy problem. In 2024, telcos consumed 340.6 Terawatt hours (TWh) of energy, or 340,572 GWh. That's more than double that of webscale. The telco carbon footprint is also multiple times larger, due to a weaker adoption rate of renewables. For the networking business to improve its sustainability, the telco sector needs the most attention.
Economics also matter. Telcos spend an average of 4-5% of their operating expenses on energy, with some spending over 10%. The volatility of these costs is a primary concern. Natural disasters, war, and trade restrictions can all impact the price of carbon-based energy. Climate change itself, by intensifying extreme weather and causing population displacement, will make reliance on imported carbon sources even riskier. In contrast, renewable energy from local wind, solar, or hydro sources tends to have more stable prices. The march toward carbon neutrality could therefore also stabilize the cost model for the average telco.
VISUALS
Report overview
This report provides a detailed assessment of energy usage and sustainability in the telecommunications industry. We analyze energy consumption, renewable use, and emissions for 66 telcos representing about 85% of the global market. We examine the global industry and present metrics on usage, efficiency, and emissions for all companies. The report includes rankings to highlight leaders and recent improvers, as well as laggards, who often need supplier help to boost efficiency and renewability.
For all 66 telcos, we present data on energy use and Scope 1 and 2 emissions, based on their ESG reports. A subset of 50 companies also report enough Scope 3 data to allow for a value chain analysis. A subset of 32 publish traffic data, which lets us analyze traffic carried per unit of energy consumed and similar metrics.
This analysis extends MTN Consulting's research into network operator energy use, which began five years ago. The study relies on our proprietary telco financial tracker, with market data through June 2025. It is supplemented by new financial data gathered for this report, including Net PP&E for all 66 telcos from 2019 to 2024.
Scope and limitations
This report analyzes telecom operators, or telcos. These companies provide access-based services directly to end users, based on ownership of spectrum or regulator-issued licenses. This includes fixed, mobile, cable TV, and satellite providers. Our sample of 66 telcos is large and representative across all regions and segments. We are confident this is the best resource available for tracking energy use in the telco industry.
The telco business model has evolved, but most moves outside the core market have been reversed or failed to scale, as seen with AT&T's acquisition and subsequent spinoff of Time Warner. Some telcos are part of larger corporate groups and own infrastructure beyond telecom networks, like data centers or retail shops. However, almost all energy a telco consumes is tied directly to its network infrastructure, usually 80-90% of the total. For a mobile operator, the RAN alone is often 50-60% or more of total energy use. Data centers typically account for less than 10% of consumption, though this can reach 20-30% and may climb as Telco AI deployments mature.
Our database focuses on pure telcos or the telco division of a larger entity. In a few cases, like Softbank and Comcast, we must use corporate-level energy data because that is all they report. However, we only include financial metrics for their telco operations. Consequently, metrics like energy used per unit of revenue may be slightly overstated for these two companies.
Data and methodology
For the 66 telcos in this report, we present financial metrics alongside energy-related indicators: total energy and electricity consumption, renewable energy share, and greenhouse gas emissions by type. Data covers 2019-2024.
Compiling a consistent dataset was challenging. Unlike financial reporting, energy disclosures lack clear standards. Companies vary widely in what they report, and ESG data are not always audited. We reviewed dozens of sustainability reports, relying on verified data where possible and estimating where necessary to create comparable time series. We believe this is the most objective and comprehensive review of its kind.
Financial data is sourced from our latest Telco Tracker, supplemented with newly collected Net PP&E data. Energy and emissions figures are generally "as reported," but we made estimates in some cases. For instance, some companies do not report full historical Scope 3 data. We have energy and Scope 1-2 data for all 66 telcos. Scope 3 data is available for 50, and traffic data for 32.
A company can claim renewable electricity use when it (1) generates renewable power on-site; (2) purchases renewable electricity from the grid and retains the associated renewable energy certificates (RECs); (3) owns off-site renewable generation and retires the RECs; or (4) signs purchased power agreements (PPAs) with third-party suppliers of green power, and then also transfer the RECs.
When companies update their historical data, we modify our database to reflect this, as updates usually stem from improved methodologies. We do not restate data if it would change the reported scope.
A note on public vs. private companies
In telecom, nearly all major companies are public and now issue some form of ESG report. The quality and transparency vary, but few sizable telcos report no energy data. Our experience in reviewing hundreds of these reports helps us judge data credibility and make necessary estimates.
One caveat: our focus on public companies introduces a small reporting bias. Public companies face greater pressure to use renewables and commit to emissions reductions. The companies we do not track, which are often private, likely have weaker environmental records. Altice Europe and BSNL are examples. There is a minor issue with Scope 3 emissions as well: the companies that do not publish a full set of reliable scope 3 stats may be less environmentally friendly than the average. However, when we estimate global Scope 3 totals, we assume missing companies have the same average footprint as those included. This means we are likely slightly underestimating the telecom industry's environmental problem.
MTN Consulting Partnership with Teral Research
This report is the kickoff product for a new service called Telecom Energy & Sustainability (TES). TES is a collaboration between MTNC and Teral Research (TR).
Organizations covered:
|
|
Table of Contents
1. Overview
2. Analysis
3. Global results
4. Company results
5. Rankings
6. Raw data
7. About
List of Figures and Charts
Global, and for each of 66 companies:
- Revenues ($M) and YoY % growth
- Capex ($M) and Capex/Revenue ratio
- Net PP&E ($M) and YoY % growth
- Capex and Net PP&E growth
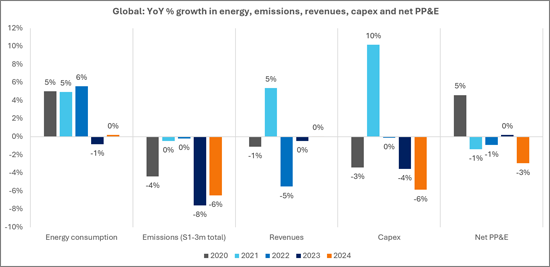
- YoY % growth in energy, emissions, revenues, capex and net PP&E
- Correlation between financial, energy input, and emissions output metrics, 2019-24
- Energy consumption in GWh and electricity's share of total energy, 2019-24
- YoY growth rates in electric use vs. total energy consumption
- Energy intensity vs. electric intensity (MWh per $1M in revenues), 2019-24
- Energy intensity, Net PP&E basis
- Renewable energy consumption in GWh and % total
- Carbon footprint by emissions type (market-based), millions of metric tons of CO2-equivalent
- Market-based vs. location-based carbon footprint (S1-2-3 total), millions of metric tons of CO2-equivalent
- Scope 3 emissions as % of S1-2-3 total, market-based vs. location-based
- Emissions intensity in MT CO2-equivalent per $M of revenue
- Emissions intensity in MT CO2-equivalent per $M of Net PP&E
Additional charts for each company:
- Company vs. global average: Energy intensity in MWh per $M of revenue
- Company vs. global average: Energy intensity in MWh per $M of revenue
- Company vs. global average: S1-S3m emissions intensity in MT CO2-equivalent per $M of revenue
- Company vs. global average: Renewable energy as % total consumption
Individual charts ranking all telcos by the following key metrics that we track:
- Capex ($M)
- Net PP&E ($M)
- Revenues ($M)
- Electricity consumption
- Energy consumption
- Renewable energy consumption (MWh)
- % renewable energy
- Capex/Revenue
- Electric as % total energy
- Scope 3 as % of total S1-3 emissions
- YoY % change in energy consumption
- Electricity intensity (MWh per $M in revenue)
- Energy intensity (MWh per $M in revenue)
- Energy intensity of fixed asset base (MWh per $1M in Net PP&E)
- Revenue from 1MWh electricity used ($)
- Revenue from 1MWh energy used ($)
- Emissions intensity: S1-2m per $M in Net PP&E
- Emissions intensity: S1-2m per $M in revenue
- Emissions intensity: S1-3m per $M in Net PP&E
- Emissions intensity: S1-3m per $M in revenue
- S1
- S2l
- S2m
- S1-2l
- S1-2m
- S3
- S1-3m
 永續發展和能源管理軟體市場:按軟體、最終用途、模組和地區分類
 能源管理軟體市場預測-全球分析(按組件、部署類型、企業規模、應用、最終用戶和地區分類)——2034年
 永續發展與能源管理軟體市場:2026-2032年全球市場預測(按軟體類型、技術、部署模式、應用程式、企業規模和最終用戶分類)
 2026年全球永續發展與能源管理軟體市場報告能源網路安全市場:依設備類型、安全類型和地區分類能源管理軟體市場:按組件、應用、部署類型和最終用戶產業分類-2026-2032年全球預測
 日本能源管理軟體市場規模、佔有率、趨勢及預測(依軟體、解決方案、最終用戶產業及地區分類),2026-2034年
 能源管理軟體市場-全球產業規模、佔有率、趨勢、機會及預測(按軟體、解決方案、最終用戶、地區和競爭格局分類,2021-2031年)
 建築及工業能源管理軟體
 能源管理軟體市場(2025-2029)