


|
市場調查報告書
商品編碼
1856787
全球電信營運商市場追蹤報告(2025年第二季):電信收入預計成長4.6%,但資本支出增加顯示營運商將重點放在獲利能力上Global Telco Market Tracker, 2Q25: Capex Pullback Persists even as Revenues Surge 4.6% - Telco Revenues Surge 4.6% in 2Q25, Capex Restraint Signals Focus on Profitability |
|||||||
價格
本報告對全球電信網路營運商(NPO)產業進行了詳細分析,涵蓋了140家營運商從2011年第一季到2025年第二季的業績數據。報告重點關注最新季度(2025年第二季)的趨勢,並涵蓋了收入、勞動力成本、資本支出、營運支出和獲利能力等關鍵指標。
視覺
主要調查結果
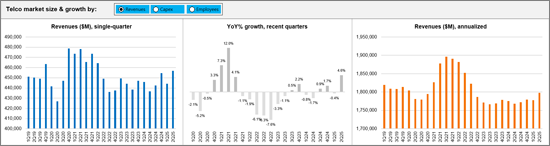
- 2025年第二季全球營運商營收年增4.6%,達到4,568億美元,主要得益於主要市場的全面復甦。以年計算,營收年增1.7%,達到1.8兆美元。
- 2025年第二季資本支出(CAPEX)較去年同期下降2.1%,至675億美元。以年計算,營收下降2.6%至2,929億美元,為2011年以來的最低12個月總額,也是2013年以來的最低資本密集度。儘管營運商的技術投資正逐步從資本支出轉向軟體和服務(這些通常計入營運支出),但總體而言,營運商仍然高度重視成本控制。
- 2025年第二季度,勞動成本年減1.3%至2,581億美元,產業員工總數降至436萬人。勞動成本佔2025年第二季年度營運支出(不包括折舊和攤提)的21.7%,略低於2024年第二季的22.2%。
- 在最近的年度期間,獲利能力指標較去年同期略有改善,EBITDA利潤率為33.8%。這表明在持續的成本壓力下,營運效率保持穩定。息稅前利潤率也略有成長,從2024年第二季的14.9%增至截至2025年6月的財年(前12個月)的15.5%。
- 依地區劃分,亞洲在2025年第二季持續維持領先地位,佔全球電信總營收的36.8%,略高於美洲的36.3%。同時,美洲在資本支出方面超過了其他所有地區,這主要得益於AT&T和Verizon擴大了網路投資。
通訊業者
|
|
地區填補
|
|
|
|
目錄
第1章 報告亮點
第2章 摘要
第3章 市場概要
第4章 分析
第5章 主要統計:~2025年第2季
第6章 勞動統計
第7章 業者排行榜
第8章 企業的詳細分析
第9章 企業基準
第10章 各國詳細分析
第11章 企業·各國詳細分析
第12章 各地區的詳細分析
第13章 原始數據
第14章 用戶·流量
第15章 匯率
第16章 調查手法·調查範圍
第17章 關於本公司
Product Code: GNI-27102025-1
This report delivers a detailed analysis of the global telecommunications network operator (telco) industry, drilling down into performance for 140 telcos from 1Q11 through 2Q25. It captures revenue, labor, capex, opex, and profitability data with a focus on the most recent quarter (2Q25).
VISUALS
Key findings:
- Global telco revenues climbed 4.6% year-over-year (YoY) in 2Q25 to reach $456.8 billion (B), supported by broad-based recovery across major markets. On an annualized 2Q25 basis, revenues grew 1.7% YoY to $1.8 trillion (T). Airtel (20.0%), Etisalat (18.7%), SoftBank (7.3%), Deutsche Telekom (4.6%), and China Unicom (3.7%) led growth in the annualized 2Q25 period, while Vodafone (-11.6%) and Orange (-7.1%) declined sharply.
- Capex declined 2.1% YoY in 2Q25 to $67.5B, while the annualized total fell 2.6% to $292.9B. That's the lowest 12-month total since 2011, and the lowest capital intensity since 2013. China Mobile remained the largest investor with $24.4B in annualized capex (+7.8% YoY) in 2Q25, while America Movil (-24.5%), China Telecom (-22.9%), and China Unicom (-17.7%) made significant cutbacks. Telco tech spending continues to shift modestly towards software and services, which may be recorded as opex rather than capex, but telcos remain vigilant cost cutters across the board.
- Labor costs fell 1.3% YoY to $258.1B in the annualized 2Q25 period, with telco headcount shrinking to 4.36 million. Labor represented 21.7% of opex (excluding D&A) for the annualized 2Q25 period, down a bit from 22.2% in 2Q24.
- Profitability margin inched higher in the latest annualized period from a year ago, with EBITDA at 33.8%, suggesting stable operational efficiency despite cost pressures. EBIT margin also edged up a bit, from 14.9% in 2Q24 to 15.5% for the 12 months ended June 2025.
- Regionally, Asia maintained its lead with 36.8% of global telco revenues in 2Q25, slightly ahead of the Americas (36.3%). On the capex spending front, the Americas outspent all other regions, boosted by network spending from AT&T and Verizon.
Operator coverage:
|
|
Regional coverage:
|
|
|
|
Table of Contents
1. Report Highlights
2. Summary
3. Market snapshot
4. Analysis
5. Key stats through 2Q25
6. Labor stats
7. Operator rankings
8. Company drilldown
9. Company benchmarking
10. Country breakouts
11. Country breakouts by company
12. Regional breakouts
13. Raw Data
14. Subs & traffic
15. Exchange rates
16. Methodology & Scope
17. About
List of Figures and Charts
- 1. TNO market size & growth by: Revenues, Capex, Employees - 1Q19-2Q25
- 2. Regional trends by: Revenues, Capex - 1Q19-2Q25
- 3. Opex & Cost trends
- 4. Labor cost trends: 1Q20-2Q25
- 5. Profitability margin trends: 1Q20-2Q25
- 6. Spending (opex, labor costs, capex): annualized and quarterly trend
- 7. Workforce & productivity trends: 1Q14-2Q25
- 8. Operator rankings by revenue and capex: latest single-quarter and annualized periods
- 9. Top 20 TNOs by capital intensity: latest single-quarter and annualized periods
- 10. Top 20 TNOs by employee base: latest single-quarter
- 11. Company Drilldown: YoY growth in single quarter revenues
- 12. Company Drilldown: Revenue and revenue split, single quarter and annualized 1Q16-2Q25
- 13. Company Drilldown: Capex and capital intensity (annualized), 1Q16-2Q25
- 14. Company Drilldown: Revenue split by country, 2Q25
- 15. Company Drilldown: Costs and Profitability, 1Q16-2Q25 ($ Mn)
- 16. Company Drilldown: Labor costs, per employee and % opex trends, 1Q16-2Q25
- 17. Company Drilldown, Cash & debt levels (2011-24)
- 18. Company Drilldown: Software as % of total capex
- 19. Company Drilldown: Software & spectrum spend
- 20. Company Drilldown: Total M&A, spectrum and capex (excl. spectrum)
- 21. Country Breakouts: Revenue and Capex, Market Share, and Capital Intensity
02-2729-4219
+886-2-2729-4219
 資料貨幣化市場規模、佔有率和成長分析(按公司規模、方法論、產業和地區分類)-2026年至2033年產業預測
 2025年全球影片貨幣化平台市場報告
 全球貨幣化平台市場:全球預測(2025-2030 年)
 資料貨幣化市場預測至2032年:按組件、方法、部署類型、資料類型、應用程式、最終用戶和地區分類的全球分析資料貨幣化平台市場預測至2032年:按組件、貨幣化方式、組織規模、技術、最終用戶和地區分類的全球分析
 數據貨幣化:全球市場佔有率和排名、總收入和需求預測(2025-2031年)去中心化資料收益平台市場預測(至 2032 年):按組件、資料類型、收益模型、應用、最終用戶和地區進行的全球分析
 收益化平台:全球市場佔有率(2024年)
 資料貨幣化市場:按最終用戶產業、部署模式、資料類型、應用程式、定價模式、組織規模和資料來源分類 - 全球預測,2025-2032 年通訊業者資料收益市場按服務類型、部署模式、定價模式、客戶類型和垂直產業分類-2025-2032 年全球預測
▼