


|
市場調查報告書
商品編碼
1831005
能源與永續發展追蹤報告:網路規模與人工智慧運算(2025)-2024年能源消耗將成長22%,成長速度是營收成長的兩倍多,而排放量將連續第二年下降。Energy & Sustainability Tracker - Webscale & AI Compute, 2025: Energy Consumption Grows 22% in 2024, Over 2x Faster than Revenues, but Emissions Fall for Second Straight Year |
|||||||
人工智慧革命已經到來,到2025年,其發展動能將擴展到主流市場。但這場革命需要前所未有的電力消耗。本報告全面分析了網路規模和人工智慧運算產業的能源使用情況,並對這場變革的核心參與者進行了評估。本報告利用專有的超大規模財務追蹤器,擴展了現有的電信業者能源永續性分析,涵蓋截至 2025 年 6 月的市場數據。
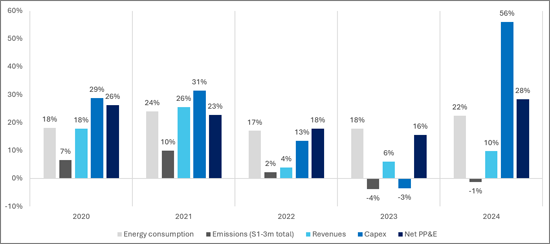
視覺
超大規模(全球):
能源、排放、收入、資本支出和淨固定資產的年增長
超大規模產業定義
超大規模產業包括擁有並經營大型(超大規模)資料中心和海底光纜網路的互聯網、軟體和服務公司。MTN顧問公司於2017年開始進行分析時,這些公司建置超大規模資料中心的主要原因是支援龐大的客戶群(例如騰訊的微信)、提供雲端服務(例如亞馬遜AWS)以及運作內部營運和研發。然而,在過去三年中,這些公司開始建造規模更大、更複雜的資料中心,專門用於人工智慧訓練和推理。
範圍和覆蓋範圍
本報告分析了全球20家領先的超大規模公司,並列出了財務指標(收入、資本支出、淨固定資產及設備)和能源相關指標(能源和電力總消耗量、可再生能源佔比和溫室氣體排放量)。數據涵蓋2019年至2024年,分析採用了突顯能源使用和永續發展趨勢的衍生指標。
本研究僅限於已上市且擁有經審計財務報表及透明商業模式的公司。人工智慧投資熱潮催生了許多新玩家,包括提供GPU租賃服務的新型雲端服務供應商和專注於低成本電力的公司。然而,這些公司大多缺乏成熟的商業模式,其長期生存能力尚不明朗。一些重要的私人公司(例如馬斯克的xAI)也不在本研究的範圍內。
雖然本報告並未涵蓋全球所有資料中心,但本研究中包含的上市超大規模資料中心公司佔了全球超大規模容量的大部分,因此被認為是影響市場未來的關鍵參與者。雖然一些重要的私人運營商和中立運營商提供託管服務,許多小型設施也滿足特定政府機構和企業的需求,但本研究重點關注主要的市場領導者。
人工智慧持續成長的能源需求
數據顯示,該產業正在經歷快速轉型。光是2024年,網路規模化產業的能源消耗量就將達到190.8太瓦時(TWh),比前一年驚人地成長了22%。自2019年以來,能源消耗量的複合年增長率(CAGR)為19.9%,遠超產業整體預期。這一增長與人工智慧(AI)的蓬勃發展密切相關。
數據清晰地表明,人工智慧投資正在顯著增加網路規模化企業的能源消耗強度。 2019年,整個產業的能源消耗量為每百萬美元收入51.7兆瓦時(MWh),到2024年底將上升至每百萬美元收入71.5兆瓦時。 2024年,能源消耗強度將加速成長,能源消耗成長將是營收成長的兩倍多。資料中心佔能源消耗的85%至90%,而且這一比例還在上升。特別是Meta,其資料中心消耗的能源佔總能源消耗的97%以上。
策略轉型:電力保障-垂直整合
面對如此強勁的需求,該產業目前正經歷結構性轉型。能源已成為業務連續性的關鍵要素,促使人工智慧開發商和資料中心營運商投資建造自有發電設施,從而實現垂直整合。例如:
- 亞馬遜:投資 5 億美元建造小型模組化核反應堆,並收購了毗鄰核電廠的資料中心用地。
- Fermi REIT:在德州啟動了一個人工智慧資料中心和能源綜合體,目標是發電量高達 11 吉瓦。
- Prologis:從物流地產轉型,為人工智慧專用資料中心確保超過 3 吉瓦的電力供應。
儘管許多此類交易都優先考慮無碳能源,但本報告警告稱,週期性投資結構和市場泡沫存在風險。報告特別指出,目前的情況與2000年代初期的網路泡沫有相似之處。
永續發展聚焦:兩個指標所揭示的現實
儘管能源消耗正在快速增長,但該報告描繪了一幅更為複雜卻也令人鼓舞的可持續發展圖景。網路產業在再生能源應用方面處於領先地位,預計到2024年,其能源消耗的84.3%將來自再生能源。這比2019年的56.3%有了顯著成長,並且遠遠超過電信業(約22-23%)。
這項努力已取得了顯著的環境成效。溫室氣體排放量(範圍 1、範圍 2(市場型)、範圍 3)連續第二年下降,從 2022 年的峰值 2.36 億公噸(二氧化碳當量)降至 2024 年的 2.241 億公噸。
然而,該報告提醒人們不要過於自信。雖然範圍 1 和範圍 2 的排放量通常備受關注,但它們僅僅反映了部分情況。範圍 3(來自整個價值鏈的間接排放)更為重要。範圍 3 的排放量佔產業碳足跡的大部分。忽視這些排放的公司低估了其環境影響的真實程度。即使像蘋果這樣的公司完全使用再生能源運營,每年售出的數億台設備仍然會消耗全球電網的電力。因此,全面了解排放情況至關重要,而本報告提供了全面的評估,以幫助企業做到這一點。
目標組織
|
|
|
目錄
第1章 概要
第2章 分析
第3章 全球結果
第4章 企業業績
第5章 排行榜
第6章 原始數據
第7章
The AI revolution is here, but its engine is running on an unprecedented amount of power. As artificial intelligence explodes into the mainstream in 2025, the focus intensifies on the energy-hungry data centers that power it. This report, "Energy & Sustainability Tracker: Webscale & AI Compute, 2025," from MTN Consulting, provides a comprehensive assessment of energy usage within the webscale and AI compute industry, analyzing the key operators at the heart of this transformation. Our analysis extends MTN Consulting's established research into network operator energy and sustainability, and leverages our proprietary webscale financial tracker covering market data through June 2025.
VISUALS
Webscale(global):
YoY% growth in energy, emissions, revenues, capex and net PP&E
The Webscale Sector Defined
The "webscale" sector comprises Internet, Software & Services companies that own and operate large (hyperscale) data centers and submarine cable networks. When we began coverage in 2017, these operators built hyperscale data centers for three primary purposes: supporting massive customer bases (Tencent's WeChat), delivering cloud services to end users (Amazon's AWS), and running internal operations and research. Over the past three years, webscale operators have increasingly built larger, more sophisticated data centers specifically for AI training and inference, what we term "AI Compute."
Scope and Coverage
This report analyzes 20 leading webscalers, presenting financial metrics (revenues, capex, and net PP&E) alongside energy-related indicators: total energy and electricity consumption, renewable energy share, and greenhouse gas emissions (Scopes 1, 2, both location- and market-based, and 3). Data cover 2019-2024, supplemented by derived metrics that illuminate energy use and sustainability trends.
Our focus is on publicly held companies with audited financial statements and transparent business models. The recent AI investment boom has produced a surge of new entrants: some renting GPU capacity ("neocloud" providers), others chasing low-cost energy or niche segments. Many of these firms lack proven business models and may not survive long. A few significant private players, such as Elon Musk's xAI, also fall outside this report's scope.
While we don't capture every data center worldwide, the public webscalers analyzed here account for the vast majority of global hyperscale capacity, and they are the players most likely to shape the market's future direction. Important private and carrier-neutral providers supply colocation services, and many smaller facilities serve specific government and corporate needs, but our coverage focuses on the dominant market leaders.
Data Quality and Methodology
Compiling a consistent dataset was a challenge. This is not the kind of exercise you can outsource to an AI. Financial reporting follows clear standards; energy and environmental disclosures do not. Companies vary widely in what they report, and ESG data are not always audited. MTN Consulting reviewed over 150 sustainability reports, relying on verified data whenever possible and estimating where necessary to create comparable, credible time series. We believe this is the most objective and comprehensive review of energy and sustainability practices in the webscale/hyperscale and AI Compute markets available today.
One important caveat: our focus on publicly traded companies introduces a reporting bias. Public companies face greater public pressure and are more likely to use renewable energy and commit to aggressive GHG emissions reduction programs. The "go green" push is not universal; private companies often take shortcuts and avoid disclosure. The companies we don't track likely have weaker environmental records than these public webscalers.
The Unstoppable Energy Demand of AI
The data reveals a sector in the throes of rapid transformation. In 2024 alone, the webscale sector consumed 190.8 TWh of energy, a staggering 22% year-over-year increase. Since 2019, energy use has grown at a compound annual growth rate (CAGR) of 19.9%, far outpacing broader industry estimates. This growth is intrinsically linked to the AI boom.
The evidence is clear that AI investment is making webscalers significantly more energy-intensive. In 2019, the sector consumed 51.7 megawatt-hours (MWh) per $1 million in revenue. By the end of 2024, that figure had risen to 71.5 MWh per $1 million. Growth in energy intensity accelerated in 2024, as energy consumption grew at over twice the speed of revenues. This energy is overwhelmingly consumed by data centers, which account for 85-90% of total webscale energy use. That figure continues to climb, driven by companies like Meta, which consumes over 97% of its total energy in data centers.
A Strategic Shift: Vertical Integration for Power Security
Faced with this demand, the industry is undergoing a fundamental shift. Energy has become so critical that we are witnessing vertical integration, with AI developers and data center owners investing directly in energy generation. A small sample of such moves:
- Amazon's $500M investment in small modular nuclear reactors and its strategic purchase of a data center site near a nuclear power plant.
- Fermi REIT's launch of a flagship AI data center and energy complex in Texas, designed to supply up to 11 GW.
- Prologis's pivot from logistics real estate to securing over 3 GW of power for specialized AI data centers.
While many of these deals prioritize carbon-free energy, the report sounds a note of caution on the circular investment dynamics and the potential risks of a market bubble, drawing parallels to the dot-com era.
Sustainability in the Spotlight: A Tale of Two Metrics
Despite soaring energy consumption, the report uncovers a more nuanced and promising story on sustainability. The webscale sector is leading the charge in renewable energy adoption. In 2024, a remarkable 84.3% of webscale energy came from renewable sources, a dramatic increase from 56.3% in 2019 and far exceeding other sectors like telecom (approx. 22-23%).
This commitment is driving tangible environmental progress. For the second consecutive year, total greenhouse gas emissions (Scopes 1, 2-market-based, and 3) have fallen, reaching 224.1 million metric tons of CO2-equivalent in 2024, down from a peak of 236.0 million in 2022.
However, the report issues a critical warning against complacency. It emphasizes that the commonly cited Scope 1 and 2 emissions tell only part of the story. The far more significant Scope 3 emissions, i.e. the indirect emissions from a company's value chain, comprise the vast majority of the sector's total carbon footprint. Companies that downplay these emissions are ignoring the true scale of their environmental impact. For instance, a company like Apple may run its operations on 100% renewables, but the hundreds of millions of devices it sells annually draw power from grids worldwide. A full accounting is essential, and this report provides it.
Who Leads and Who Lags? Exclusive Company Rankings
This tracker goes beyond sector-level analysis to deliver granular company rankings on key performance indicators, enabling you to benchmark players and identify leaders and laggards.
- Renewable Energy Adoption: Amazon, Microsoft, Meta, and Alphabet all achieved 98% or higher in 2024, while Chinese webscalers Alibaba, Tencent, and Baidu ranked lowest; some of these, however, are making rapid progress.
- Energy Intensity: Microsoft and Meta are among the most energy-intensive companies, a direct result of their massive AI compute investments. In contrast, device-centric companies like Xiaomi and Apple have the lowest intensity.
- Total Carbon Footprint: Amazon is the standout outlier, accounting for over 30% of the entire sector's emissions at over 68 million metric tons in 2024. While its renewable commitment is strong, its Scope 3 emissions are massive, and the report details its controversial departure from a UN-backed climate initiative.
Why You Need This Report
This report delivers actionable intelligence unavailable elsewhere. Investors can evaluate AI infrastructure opportunities with confidence. Policy makers can address energy grid capacity challenges with hard data. Industry participants can benchmark their sustainability performance against peers. The report provides detailed company-by-company metrics spanning six years, proprietary analysis of energy intensity trends, and clear rankings across renewable adoption and emissions. You'll gain the competitive advantage needed to make informed decisions in the rapidly evolving AI compute landscape. This is the definitive resource for understanding the intersection of artificial intelligence, energy consumption, and environmental impact.
Organizations covered:
|
|
|
Table of Contents
1. Overview
2. Analysis
3. Global results
4. Company results
5. Rankings
6. Raw data
7. About
List of Figures and Charts
Global, and for each of 20 companies:
- Revenues ($M) and YoY % growth
- Capex ($M) and Capex/Revenue ratio
- Net PP&E ($M) and YoY % growth
- Capex and Net PP&E growth
- YoY % growth in energy, emissions, revenues, capex and net PP&E
- Correlation between financial, energy input, and emissions output metrics, 2019-24
- Energy consumption in GWh and electricity's share of total energy, 2019-24
- YoY growth rates in electric use vs. total energy consumption
- Energy intensity vs. electric intensity (MWh per $1M in revenues), 2019-24
- Energy intensity, Net PP&E basis
- Renewable energy consumption in GWh and % total
- Carbon footprint by emissions type (market-based), millions of metric tons of CO2-equivalent
- Market-based vs. location-based carbon footprint (S1-2-3 total), millions of metric tons of CO2-equivalent
- Scope 3 emissions as % of S1-2-3 total, market-based vs. location-based
- Emissions intensity in MT CO2-equivalent per $M of revenue
- Emissions intensity in MT CO2-equivalent per $M of Net PP&E
Additional charts for each company:
- Company vs. global average: Energy intensity in MWh per $M of revenue
- Company vs. global average: Energy intensity in MWh per $M of revenue
- Company vs. global average: S1-S3m emissions intensity in MT CO2-equivalent per $M of revenue
- Company vs. global average: Renewable energy as % total consumption
Individual charts ranking all webscalers by the following key metrics that we track:
- Capex ($M)
- Net PP&E ($M)
- Revenues ($M)
- Electricity consumption
- Energy consumption
- Renewable energy consumption (MWh)
- % renewable energy
- Capex/Revenue
- Electric as % total energy
- Scope 3 as % of total S1-3 emissions
- YoY % change in energy consumption
- Electricity intensity (MWh per $M in revenue)
- Energy intensity (MWh per $M in revenue)
- Energy intensity of fixed asset base (MWh per $1M in Net PP&E)
- Revenue from 1MWh electricity used ($)
- Revenue from 1MWh energy used ($)
- Emissions intensity: S1-2m per $M in Net PP&E
- Emissions intensity: S1-2m per $M in revenue
- Emissions intensity: S1-3m per $M in Net PP&E
- Emissions intensity: S1-3m per $M in revenue
- S1
- S2l
- S2m
- S1-2l
- S1-2m
- S3
- S1-3m
 永續性和能源管理軟體市場(按軟體類型、技術、部署模型、應用、公司規模和最終用戶分類)—全球預測 2025-2032
 2025年永續性與能源管理軟體全球市場報告
 按設備類型、安全類型和地區分類的能源網路安全市場
 能源管理軟體市場(2025-2029)永續能源管理軟體市場預測至 2032 年:按組件、部署類型、組織規模、模組、最終用戶和地區進行的全球分析能源管理軟體市場(按組件、應用、部署模式和最終用戶產業)—2025 年至 2030 年全球預測
 商業大樓用HVAC最佳化能源管理軟體的全球市場 - 市場規模,競爭情形(2024年~2029年)
 全球永續性與能源管理軟體市場
 全球永續能源管理軟體市場 - 全球產業分析、規模、份額、成長、趨勢、預測 (2031) - 按軟體、按最終用途、按模組、按地區