


 |
市場調查報告書
商品編碼
1892159
全球腫瘤影像人工智慧市場(2025-2032):規模、組成及成長趨勢Global Oncology Imaging AI Market Pulse 2025-2032 Size, Mix and Momentum |
||||||
全球腫瘤影像人工智慧市場預計將從2023年的6.047億美元成長到2032年的77.4億美元(複合年增長率32.7%)。這使得腫瘤領域成為醫學影像人工智慧領域成長最快的類別之一,也是企業買家未來人工智慧預算分配方向的重要指標。
概述
"全球腫瘤影像人工智慧市場(2025-2032):規模、組成及成長趨勢" 是由Marketstrat提供的關於癌症影像診斷人工智慧的全球市場規模和預測報告。 我們涵蓋了按地區、影像方式(CT、乳房X光攝影/DBT、MRI、PET/核子醫學、超音波)、臨床應用領域、腫瘤位置、治療路徑階段、最終用戶環境和收入模式劃分的需求趨勢。
本報告非常適合那些希望獲得清晰、量化的全球視角,而無需閱讀數百頁的大型展望報告的人士。它能夠快速解答以下問題,並提供決策層面的答案:
- 目前全球AI癌症影像市場的規模有多大?到2032年,其規模將成長多少?
- 支出將集中在哪些領域( "大市場" )?
- 預計未來哪些領域將帶來收入成長( "快速成長領域" 和 "成長貢獻者" )?
- 獲利模式將如何演變(軟體、服務或雲端/按使用量付費)?
市場規模並非取決於掃描器的數量,而是取決於設備的數量。預計市場將以32.7%的複合年增長率成長,從2023年的6.47億美元成長到2032年的77.4億美元,主要成長動力來自設備安裝率的提高和工作流程的實施。
主要市場趨勢(正在發生的變化)
1. 從 "單一功能人工智慧" 到全流程應用
腫瘤影像人工智慧正從單一任務的電腦輔助診斷(CAD)轉向全流程工作流程,包括篩檢、檢測、分期、治療計劃(包括放射治療)、治療反應評估和追蹤。標準化測量是該領域臨床和經濟方面的必要條件。
2.篩檢項目支持可預測的 AI 工作負載
乳癌篩檢(乳房X光攝影/數位乳房斷層合成)和低劑量CT肺癌篩檢的規模不斷擴大和產業化,對 AI 的需求也隨之增長,以支持分流、品質保證 (QA)、二次會診和大規模項目運營。
3. 測量級量化成為價值核心
在MRI(前列腺/肝臟)、CT(肺部病變)和PET/核醫學(治療性診斷)領域,成長的重點在於量化、分析和結構化報告工具,這些工具能夠提高癌症影像診斷的可重複性和運作可擴展性。
4. MRI 與 PET/核醫高端市場(高 ARPU 領域)的擴張
MRI 是成長最快的主要影像模式,而 PET/核醫正逐漸成為一個高價值的細分市場,這得益於治療性影像(包括診療一體化)的擴展,從而推動了對定量和劑量學導向型人工智慧的需求。
5. 獲利模式轉向軟體 + 使用量 + 生命週期服務
雖然軟體仍然是核心收入驅動因素,但雲端/基於使用量的付費模式(PPU)將在高容量工作流程(篩檢點、遠端放射學和企業多站點網路)中加速發展。隨著驗證、監控和治理需求的成長,服務也將隨之擴展。
競爭格局概述(商業現實,而非市場佔有率)
本報告聚焦於市場格局的劃分方式,而非各供應商的市佔率。 本報告重點介紹各細分市場的贏家以及影響定價權的商業基本面:
- 高容量模式和篩選通道中 OEM 捆綁銷售和 "預設附加" 的經濟效益
- 整合醫療網絡 (IDN) 和癌症網絡中的企業合約和治理要求
- 市場/平台分銷降低了多供應商環境下的採用門檻
- 遠距放射學和集中式閱片中心推動了基於使用量的定價和標準化品質保證 (QA)
以下公司/產業被提及(但未進行詳細介紹):Aidoc、AIQ Solutions、Annalise.ai、Arterys、Bayer、Blackford、Calantic、Canon Medical、CARPL.ai、DeepHealth、Deepwise、Densitas、EXINI Diagnostics、Fujifilm、GE Lantheus、Lunit、Median Technologies、MIM Software、邁瑞醫療、Mirada Medical、MVision AI、Nuance、Oxipit、Perspectum、飛利浦、平安醫療、Quibim、Qure.ai、Rad AI、RadNet、RaySearch、Riverin、ScreenPoint、Sectra、Segami、西門子醫療、Subtle Medical、Riverin、ScreenPoint、Sectra、Segami、西門子醫療、Subtle Medical.
範例洞察與圖表(可引用內容)
本報告提供讀者以下問題的即時答案:
- 與全球平均值相比,哪些地區在特定治療方式和治療路徑階段的代表性過高或過低?
- 依治療方式、腫瘤部位、治療路徑階段及收入來源劃分,哪些地區帶來的增量收入最大?
- 哪些腫瘤部位和影像方式的組合帶來了最大的增量收入(例如,乳癌 X 光/DR、肺癌 CT、攝護腺 MRI)?
- 雲端/隨選付費模式在哪些方面比傳統授權協議更具結構性優勢?
本報告包含 41 個圖表和 36 個表格,可用於規劃文件、投資概覽和市場推廣策略優先排序。
目錄
- 摘要整理,重點介紹全球市場規模、成長與最重要的市場變化。
- 研究方法概述(範圍定義、細分指南和預測架構)。
- 全球市場分析(2023-2032)依下列區域劃分:
- 按區域和特定國家劃分的分析。
- 治療模式構成及成長貢獻。
- 臨床應用組成及成長趨勢。
- 腫瘤部位組成及成長貢獻。
- 收入來源(硬體、軟體、服務)。 (雲端/PPU)
- 最終使用者組織(IDN/AMC、癌症中心、社區健康組織、遠距放射學)
- 依治療路徑階段劃分的趨勢(篩檢→治療計畫/放射治療→治療反應評估/追蹤)
- 構成和動量矩陣及交叉表(例如,地區 x 模式、腫瘤位置 x 模式、治療路徑階段 x 收入來源)
本報告的意義
"全球腫瘤人工智慧成像市場趨勢(2025-2032)" 報告旨在為需要準確市場規模預測和可操作的市場細分的團隊提供幫助。以下是實際決策所需的各種因素的組合:
- 產品組合與路線圖決策:哪些模式和腫瘤部位值得持續投資?
- 市場進入與部署順序:從哪裡入手(大型市場),又該選擇性地投資於哪些市場(成長型市場)?
- 商業策略:收入模式將如何演變(授權、服務或使用量)?哪些市場的價格會下降,哪些市場的價格會保持穩定?
- 投資人與盡職調查流程:哪些成長故事是基於全球市場組成/動能模式而非軼事?
目錄
第 0 部分 - 如何掌握全球市場脈動
第 1 部分 - 全球市場概覽(2023-2032 年)
第 2 部分 - 摘要整理
第 3 部分 - 研究方法
第 4 部分 - 全球腫瘤影像人工智慧市場
- 全球市場概覽
- 腫瘤影像人工智慧:從利基應用到企業平台
- 為何應用加速成長
- 區域成長概覽(2023-2032 年)
- 對供應商的策略啟示
- 市場動能與展望
- 腫瘤影像人工智慧:從利基應用到企業平台
- 全球市場預測區域(2023-2032 年)
- 按國家/地區和最終用戶組織劃分的全球市場
- 按國家/地區和應用劃分的預估(2023 年,百萬美元)
- 按國家/地區和應用劃分的預測(2032 年)
- 亮點(2032 年國家/地區格局與全球組成)
- 到 2023 年將發生哪些變化(方向)
- 成長最快的領域(百萬美元成長,2023-2032 年)
- 意義(商業策略)
- 值得關注的訊號
- 以治療方式劃分的全球市場
- 亮點
- 全球市場(依治療方式)(2023-2032 年)
- 影響
- 市場數學與擴散模式
- 2032 年組成與關鍵成長點鏡頭
- 市佔率變化及美元走勢(2023-2032 年)
- 競爭格局 - 依成像方式劃分
- 影像方式細分(腫瘤領域)
- CT
- X光/DR(包括乳房X光攝影)
- MRI
- PET/核子醫學
- 超音波
- 供應商策略要點(腫瘤領域)
- 值得關注的訊號(2025-2027 年)
- 全球市場依臨床應用劃分
- 亮點
- 全球市場依臨床應用劃分(2023-2032 年)
- 有哪些變化?
- 按應用領域劃分的關鍵成長點
- 推動成長的人員(2023 年至 2032 年成長情形)
- 意義
- 依臨床應用劃分的競爭格局
- 依臨床應用深度分析
- 檢測與診斷
- 量化與分析
- 工作流程與協調
- 報告與溝通
- 影像重建與擷取
- 供應商策略要點
- 值得關注的訊號(2025-2027 年)
- 依腫瘤部位劃分的全球市場
- 亮點
- 變化趨勢(組合動態)
- 依腫瘤部位劃分的全球市場(2023-2032 年)
- 依腫瘤部位劃分的成長視角
- 意義分析
- 到 2032 年會發生哪些變化
- 商業啟示
- 依腫瘤部位劃分的競爭格局
- 依腫瘤部位劃分的詳細分析
- 乳癌
- 肺癌/胸腔癌
- 攝護腺癌
- 大腸直腸癌
- 肝癌
- 神經腫瘤
- 婦科腫瘤
- 頭頸癌
- 其他(稀有)
- 策略啟示
- 值得關注的訊號(2025-2027)
- 全球市場依收入來源劃分
- 亮點
- 正在發生什麼變化?
- 全球市場依收入來源劃分(2023-2032)
- 成長視角 - 按收入來源劃分
- 成長貢獻(2023-2032 年美元走勢)
- 意義
- 依收入來源劃分的詳細分析
- 硬體
- 軟體
- 服務
- 雲端/PPU
- 競爭格局 - 依收入來源劃分
- 值得關注的訊號(2025-2027)
- 全球市場依最終用途紙巾類型劃分
- 亮點
- 正在發生什麼變化?
- 以最終用途組織類型劃分的全球市場(2023-2032 年)
- 按應用劃分的成長視角
- 成長貢獻(2023-2032 年美元強度)
- 意義解讀
- 深度分析
- 學術機構/整合交付網路 (IDN)
- 綜合癌症中心
- 社區醫院與診斷影像中心
- 遠端放射診斷服務供應商
- 以最終用途劃分的競爭格局
- 值得關注的訊號(2025-2027 年)
- 按人工智慧技術劃分的全球市場
- 亮點
- 正在發生哪些變化?
- 全球人工智慧技術市場概況(2023-2032 年)
- 成長視角 - 人工智慧技術
- 誰在推動成長(美元走強,2023-2032 年)
- 這意味著什麼?
- 人工智慧技術深度分析(腫瘤學視角)
- 人工智慧技術競爭格局
- 值得關注的訊號(2025-2027 年)
- 全球市場依治療階段劃分
- 亮點
- 正在發生哪些變化?
- 依路徑階段劃分的全球市場(2023-2032 年)
- 成長視角 - 依路徑階段劃分
- 誰會推動成長(美元強弱 2023-2032 年)
- 這意味著什麼
- 競爭格局 - 依路徑階段劃分
- 重要訊號(2025-2027 年)
- 如何解讀 "組合與動量" 矩陣
- 地域組合與動量 - 全球腫瘤影像人工智慧
- 高階主管要點
- 按地區和模式劃分的行銷
- 按地區和模式劃分的全球市場(2020-2023 年)
- 按地區和模式劃分的全球市場(至 2032 年)
- 正在發生哪些變化? (混合型,2032 年超額/不足指數)
- 誰在推動成長? (2023 年至 2032 年的成長)
- 這意味著什麼?
- 按地區和收入來源劃分的市場
- 全球市場按地區和收入來源劃分,截至 2023 年
- 全球市場按地區和收入來源劃分,截至 2032 年
- 正在發生哪些變化? (混合型,2032 年超額/不足指數)
- 誰在推動成長?
- 這意味著什麼?
- 按地區和臨床應用劃分的市場
- 2023年至2025年全球市場按地區和臨床應用劃分
- 2032年至2035年全球市場按地區和臨床應用劃分
- 市場變化趨勢(2032年超額/不足指數)
- 誰在推動成長?
- 意義
- 競爭格局概覽(示意圖)
- 疾病驅動型需求地圖 - 全球腫瘤影像人工智慧
- 高階主管要點
- 腫瘤位置 x 影像方式
- 2023 年至 2035 年全球腫瘤位置 x 影像方式市場
- 2032 年全球腫瘤部位與影像方式市場
- 變化趨勢(2032 年組成及全球市場)
- 誰將推動成長(2023 年至 2032 年美元升值)
- 這意味著什麼?
- 腫瘤部位與臨床應用
- 依腫瘤部位和臨床應用劃分的全球市場,2023-2032 年
- 變動趨勢(2032 年組成及全球)
- 按腫瘤部位和臨床應用劃分的全球市場,2032-2032 年
- 誰將推動成長(2023 年至 2032 年美元走強)
- 這意味著什麼
- 腫瘤部位 x 收入來源
- 依腫瘤部位和收入來源劃分的全球市場,2023-2032 年
- 依腫瘤部位和收入來源劃分的全球市場,2032-2032 年
- 變化趨勢(2032 年與全球比例比較)
- 誰將推動成長(2023 年至 2032 年美元走強)
- 這意味著什麼意義
- 競爭格局概覽(腫瘤領域)
- 值得關注的訊號
- 工作流程經濟學 - 全球腫瘤影像人工智慧
- 影像模式 x 收入來源
- 2023 年全球市場:依收入來源劃分的影像模式
- 依收入來源劃分的全球市場(依影像模式)
- 亮點
- 變動趨勢(組合及超額/不足指數)
- 誰將推動成長(2023 年至 2032 年美元走勢)
- 意義(商業策略)
- 競爭視角(案例)
- 按收入來源劃分的臨床應用
- 亮點(2032 年趨勢)
- 2023-2032 年按收入來源劃分的全球市場(按臨床應用)年份
- 按臨床應用和收入來源劃分的全球市場(2023-2032 年)
- 變化趨勢(2023-2032 年)
- 成長驅動因素(2023 年至 2032 年美元成長)
- 意義解讀(按應用劃分的商業策略)
- 競爭格局分析(僅供參考,並非詳盡無遺)
- 獲得核准的定價模式(買家青睞的定價)
- 值得關注的訊號
- 風險與注意事項
- 影像模式 x 收入來源
- 路徑階段經濟學 - 全球腫瘤影像人工智慧
- 路徑階段 x 收入來源
- 亮點
- 以路徑階段 x 收入來源劃分的全球市場(截至 2023 年)
- 以路徑階段 x 收入來源劃分的全球市場(截至 2023 年) 2032 年)
- 變動之處(組合與全球)
- 誰在推動成長(2023-2032 年美元走強)
- 意義何在(商業策略)
- 競爭視角(參考)
- 值得關注的訊號
- 路徑階段 x 模式 - 各階段的趨勢及其原因
- 路徑階段 x 全球市場(依模式劃分,截至 2023 年)
- 路徑階段 x 全球市場(依模式劃分,截至 2032 年)
- 亮點(2032 年模式與全球組合比較)
- 美元趨勢(2023-2032 年)
- 各階段的解讀(2032 年各階段股票)
- 影響(商業考量)
- 競爭視角(範例,非實際資料)綜合)
- 值得關注的訊號
- 路徑階段 x 臨床應用:工作量如何影響支出
- 按路徑階段和臨床應用劃分的全球市場(截至 2023 年)
- 按路徑階段和臨床應用劃分的全球市場(截至 2032 年)
- 亮點(2032 年模式與全球組成比較)
- 美元趨勢(2023-2032 年)
- 意義(商業策略)
- 競爭視角(參考)
- 值得關注的訊號
- 路徑階段 x 最終用途:誰在購買什麼以及成長集中在哪些地區
- 全球情勢(2032 年最終用途組成)
- 按路徑階段和最終用途劃分的全球市場(2020-2023 年)
- 2032 年全球市場:依路徑階段與最終用途
- 亮點(2032 年模式與全球組成)
- 成長貢獻者(2023 年至 2032 年美元成長)
- 這意味著什麼(階段性商業策略)
- 競爭視角(僅供參考,並非詳盡無遺)
- 值得關注的訊號
- 路徑階段 x 人工智慧技術如何改變癌症治療路徑的能力組合
- 全球科技構成
- 路徑階段 x 人工智慧技術全球市場年度 - 2023 年
- 路徑階段 x 人工智慧技術全球市場年度 - 2032 年
- 亮點(2032 年模式與全球組成)
- 美元趨勢(2023-2032 年)
- 這意味著什麼(商業策略)
- 競爭視角(指南)
- 值得關注的訊號觀看
- 路徑階段 x 收入來源
The global Oncology Imaging AI market is forecast to grow from US$604.7M in 2023 to US$7.74B by 2032 (32.7% CAGR)-making oncology one of the fastest-scaling categories inside medical imaging AI and a leading indicator for where enterprise buyers will place their next AI budgets.
Overview
Global Oncology Imaging AI Market Pulse 2025-2032: Size, Mix & Momentum is Marketstrat's world-market sizing and forecasting report for AI in cancer imaging-covering how demand is shifting across regions, modalities (CT, mammography/DBT, MRI, PET/Nuclear, ultrasound), clinical applications, tumor sites, care pathway stages, end-use settings, and revenue models.
This Pulse is built for teams who want a clean, quantitative global view-without needing to navigate a full multi-hundred-page Horizon program. It delivers a fast, decision-grade answer to:
- How big is the global oncology imaging AI market today-and where will it be by 2032?
- Where is the mix of spend concentrated (the "big pools")?
- Where will incremental dollars accrue (the "fast pools" and "growth contribution" lanes)?
- How do monetization models shift (software vs services vs cloud/usage-based)?
Market expands from US$604.7M (2023) to US$7.74B (2032) at a 32.7% CAGR, driven primarily by attach-rate expansion and workflow adoption, not scanner unit growth.
Key Market Trends (what's changing)
1. From "point AI" to pathway adoption
Oncology imaging AI is shifting from single-task CAD toward pathway-wide workflows-screening, detection, staging, treatment planning (including RT), response assessment, and surveillance-where standardized measurement becomes a clinical and economic requirement.
2. Screening programs anchor predictable AI volumes
Breast screening (mammography/DBT) and LDCT lung screening continue to expand and industrialize, increasing demand for AI that supports triage, QA, second reads, and program operations at scale.
3. Measurement-grade quantification becomes the value center
Across MRI (prostate/liver), CT (lung pathways), and PET/Nuclear (theranostics), growth increasingly concentrates in quantification, analytics, and structured reporting-tools that make cancer imaging more reproducible and operationally scalable.
4. Premium pools rise in MRI and PET/Nuclear (high ARPU lanes)
MRI is the fastest-growing major modality, and PET/Nuclear grows as a high-value niche as therapy-linked imaging (including theranostics) expands demand for quantification and dosimetry-oriented AI.
5. Monetization shifts toward software + usage + lifecycle services
Software remains the core revenue engine, while cloud/usage-based (PPU) models accelerate in high-volume workflows (screening hubs, teleradiology, and enterprise multi-site networks). Services expand alongside validation, monitoring, and governance requirements.
Competitive Snapshot (commercial reality, not market shares)
This Global Pulse focuses on how the market is captured-not vendor-by-vendor market shares. The report highlights the commercial rails that shape winners and pricing power across segments:
- OEM bundling and "default attach" economics in high-volume modalities and screening lanes
- Enterprise contracting and governance requirements in IDNs and cancer networks
- Marketplace/platform distribution that reduces deployment friction for multi-vendor portfolios
- Teleradiology and centralized reading hubs as catalysts for usage-based pricing and standardized QA
The following companies/divisions have been mentioned (not profiled): Aidoc; AIQ Solutions; Annalise.ai; Arterys; Bayer; Blackford; Calantic; Canon Medical; CARPL.ai; DeepHealth; Deepwise; Densitas; EXINI Diagnostics; Fujifilm; GE HealthCare; Hermes Medical Solutions; Hologic; Imbio; Incepto; Kheiron; Koios Medical; Lantheus; Lunit; Median Technologies; MIM Software; Mindray; Mirada Medical; MVision AI; Nuance; Oxipit; Perspectum; Philips; Ping An Healthcare; Quibim; Qure.ai; Rad AI; RadNet; RaySearch; Riverain; ScreenPoint; Sectra; Segami; Siemens Healthineers; Subtle Medical; Tempus; TheraPanacea; United Imaging; Vara; Varian
Sample Insights & Figures (what you'll be able to cite)
Inside this report, readers gain immediate answers to questions such as:
- Which regions are over- or under-indexed in specific modalities or pathway stages versus the global mix?
- Where is the largest dollar lift coming from-by modality, tumor site, pathway stage, and revenue stream?
- Which tumor-site x modality combinations create the most incremental dollars (e.g., breast x X-ray/DR, lung x CT, prostate x MRI)?
- Where are cloud/PPU models structurally advantaged versus traditional licensing?
This Pulse includes 41 figures and 36 tables, structured to be reusable in planning decks, investment briefs, and GTM prioritization.
What's Inside
- Executive Summary focused on global size, growth, and the few mix shifts that matter most
- Condensed Research Methodology (scope definition, segmentation compass, and forecast architecture)
- World Market Analysis (2023-2032) across:
- Region and selected country views
- Modality mix and growth contribution
- Clinical application mix and momentum
- Tumor-site mix and growth contribution
- Revenue streams (hardware, software, services, cloud/PPU)
- End-use organizations (IDNs/AMCs, cancer centers, community providers, teleradiology)
- Pathway stage dynamics (screening -> treatment planning/RT -> response/surveillance)
- Mix & Momentum matrices and cross-tabs (e.g., region x modality, tumor site x modality, pathway stage x revenue stream)
Why This Report
Global Oncology Imaging AI Market Pulse 2025-2032 is built for teams that need high-confidence sizing plus practical segmentation-the combination required to make real decisions:
- Portfolio and roadmap decisions: Which modalities and tumor sites are worth sustained investment?
- Market entry and sequencing: Where do you start (big pools) vs where do you place selective bets (fast pools)?
- Commercial strategy: How will revenue models evolve (license vs service vs usage), and where will pricing compress vs hold?
- Investor and diligence workflows: Which growth narratives are supported by global mix/momentum patterns rather than anecdote?
TABLE OF CONTENTS
SECTION 0 - HOW TO USE THIS GLOBAL MARKET PULSE
SECTION 1 - GOBAL MARKET SNAPSHOT (2023-2032)
SECTION 2 - EXECUTIVE SUMMARY
SECTION 3 - RESEARCH METHODOLOGY
SECTION 4 - WORLD MARKET FOR ONCOLOGY IMAGING AI
- 4.1 WORLD MARKET OVERVIEW
- Oncology Imaging AI: From Niche App to Enterprise Platform
- Why Adoption is Accelerating
- Regional Growth Snapshot (2023 -> 2032)
- Strategic Implications for Vendors
- Market Momentum & Outlook
- Oncology Imaging AI: From Niche App to Enterprise Platform
- 4.2 WORLD MARKET FORECAST BY REGION (2023-2032)
- 4.3 WORLD MARKET BY COUNTRY x END-USE ORG
- Estimate by Country x End-Use (USD Mill, 2023)
- Forecast by Country x End-Use (2032)
- Highlights (2032 Country Pattern vs World Mix)
- What's Shifting vs 2023 (Directional)
- Top Growth Cells (US$ M Lift, 2023->2032)
- What This Means (Commercial Playbook)
- Signals to Watch
- 4.4 WORLD MARKET BY MODALITY
- Highlights
- World Market by Modality (2023-32)
- Implications
- Market Math & Diffusion Pattern
- 2032 Mix and Key Growth Lenses
- Share Shift and Dollar Lift (2023 -> 2032)
- Competitive Landscape - by Modality
- Modality Deep-Dives (Oncology-specific)
- CT
- X-ray/DR (incl. Mammography)
- MRI
- PET/Nuclear
- Ultrasound
- Strategic Takeaways for Vendors (Oncology-specific)
- Signals to Watch (2025-2027)
- 4.5 WORLD MARKET BY CLINICAL APPLICATION
- Highlights
- World Market by Clinical Application (2023-32)
- What's Shifting
- Key Growth Lenses by Application
- Who Contributes the Growth (2023->2032 lift)
- What This Means
- Competitive Landscape - by Clinical Application
- Deep Dives by Clinical Application
- Detection & Diagnosis
- Quantification & Analytics
- Workflow & Orchestration
- Reporting & Communication
- Image Reconstruction & Acquisition
- Strategic Takeaways for Vendors
- Signals to Watch (2025-2027)
- 4.6 WORLD MARKET BY TUMOR SITE
- Highlights
- What's Shifting (Mix Dynamics)
- World Market by Tumor Site (2023-32)
- Growth Lenses - by Tumor Site
- What This Means
- What Shifts Through 2032
- Commercial Takeaways
- Competitive Landscape - by Tumor Site
- Deep Dives by Tumor Site
- Breast
- Lung/Chest
- Prostate
- Colorectal
- Liver
- Neuro-Oncology
- Gynecologic
- Head & Neck
- Other (Rare)
- Strategic Takeaways
- Signals to Watch (2025-2027)
- 4.7 WORLD MARKET BY REVENUE STREAM
- Highlights
- What's Shifting
- World Market by Revenue Stream (2023-32)
- Growth Lenses - by Revenue Stream
- Who Contributes the Growth (2023->2032 Dollar Lift)
- What This Means
- Deep Dives by Revenue Stream
- Hardware
- Software
- Service
- Cloud/PPU
- Competitive Landscape - by Revenue Stream
- Signals to Watch (2025-2027)
- 4.8 WORLD MARKET BY END-USE ORGANIZATION TYPE
- Highlights
- What's Shifting
- World Market by End-Use Organization (2023-32)
- Growth Lenses by End-use
- Who Contributes the Growth (2023->2032 Dollar Lift)
- What this Means
- Deep Dives
- Academic/IDNs
- Comprehensive Cancer Centers
- Community Hospitals & Imaging Centers
- Teleradiology Providers
- Competitive Landscape - by End-Use
- Signals to Watch (2025-2027)
- 4.9 WORLD MARKET BY AI TECHNOLOGY
- Highlights
- What's Shifting
- World Market by AI Technology (2023-32)
- Growth Lenses - by AI Technology
- Who Contributes the Growth (2023->2032 Dollar Lift)
- What This Means
- Deep Dives by AI Technology (Oncology Lens)
- Competitive Landscape - by AI Technology
- Signals to Watch (2025-2027)
- 4.10 WORLD MARKET BY PATHWAY STAGE
- Highlights
- What's Shifting
- World Market by Pathway Stage (2023-32)
- Growth Lenses - by Pathway Stage
- Who Contributes the Growth (2023->2032 Dollar Lift)
- What This Means
- Competitive Landscape - by Pathway Stage
- Signals to Watch (2025-2027)
- HOW TO INTERPRET "MIX & MOMENTUM" MATRICES
- 4.11 REGIONAL MIX & MOMENTUM - WORLD ONCOLOGY IMAGING AI
- Executive Takeaways
- Marke by Region x Modality
- World Market by Region x Modality - 2023
- World Market by Region x Modality - 2032
- What's Shifting (Mix, 2032 Over/Under-index)
- Who Contributes the Growth (2023->2032 Lift)
- What This Means
- Market by Region x Revenue Stream
- World Market by Region x Revenue Stream - 2023
- World Market by Region x Revenue Stream - 2032
- What's Shifting (Mix, 2032 Over/Under Index)
- Who Contributes the Growth
- What This Means
- Market by Region x Clinical Application
- World Market by Region x Clinical Application - 2023
- World Market by Region x Clinical Application - 2032
- What's Shifting (Mix, 2032 Over/Under Index)
- Who Contributes the Growth
- What this Means
- Competitive Snapshots (Illustrative)
- 4.12 DISEASE-DRIVEN DEMAND MAP - WORLD ONCOLOGY IMAGING AI
- Executive Takeaways
- Tumor Site x Modality
- World Market by Tumor Site x Modality - 2023
- World Market by Tumor Site x Modality - 2032
- What's Shifting (2032 Mix vs Global)
- Who Contributes the Growth (2023->2032 Dollar Lift)
- What This Means
- Tumor Site x Clinical Application
- World Market by Tumor Site x Clinical Application - 2023
- What's Shifting (2032 Mix vs Global)
- World Market by Tumor Site x Clinical Application - 2032
- Who Contributes the Growth (2023->2032 Dollar Lift)
- What this means
- Tumor Site x Revenue Stream
- World Market by Tumor Site x Revenue Stream - 2023
- World Market by Tumor Site x Revenue Stream - 2032
- What's Shifting (2032 mix vs global)
- Who Contributes the Growth (2023->2032 Dollar lift)
- What This Means
- Competitive Snapshot (Illustrative, Oncology-focused)
- Signals to Watch
- 4.13 WORKFLOW ECONOMICS - WORLD ONCOLOGY IMAGING AI
- Modality x Revenue Stream
- World Market by Modality x Revenue Stream - 2023
- World Market by Modality x Revenue Stream - 20232
- Highlights
- What's Shifting (Mix & Over/Under-Index)
- Who Contributes the Growth (2023->2032 Dollar Lift)
- What This Means (Commercial Playbook)
- Competitive Lens (Illustrative)
- Clinical Application x Revenue Stream
- Highlights (2032 Pattern)
- World Market by Clinical Application x Revenue Stream - 2023
- World Market by Clinical Application x Revenue Stream - 2032
- What's Shifting (2023 -> 2032)
- Who Contributes the Growth (US$ M lift, 2023->2032)
- What This Means (Commercial Playbook by Application)
- Competitive Lens (Indicative, Non-exhaustive)
- Pricing Archetypes That Clear Approvals (What Buyers Say "Yes" to)
- Signals to Watch
- Risks & Watchouts
- Modality x Revenue Stream
- 4.14 PATHWAY STAGE ECONOMICS - WORLD ONCOLOGY IMAGING AI
- Pathway Stage x Revenue Stream
- Highlights
- World Market by Pathway Stage x Revenue Stream - 2023
- World Market by Pathway Stage x Revenue Stream - 2032
- What's Shifting (Mix vs Global)
- Who Contributes the Growth (2023 -> 2032 Dollar Lift)
- What This Means (Commercial Playbook)
- Competitive Lens (Indicative)
- Signals to Watch
- Pathway Stage x Modality - Where Each Stage Leans and Why
- World Market by Pathway Stage x Modality - 2023
- World Market by Pathway Stage x Modality - 2032
- Highlights (2032 Pattern vs World Mix)
- Where the Dollars Moved (2023 -> 2032)
- Stage-specific Readouts (2032 Shares Inside Each Stage)
- What This Means (Commercial Takeaways)
- Competitive Lens (Illustrative, not Exhaustive)
- Signals to Watch
- Pathway Stage x Clinical Application - How Workloads Drive Spend
- World Market by Pathway Stage x Clinical Application - 2023
- World Market by Pathway Stage x Clinical Application - 2032
- Highlights (2032 Pattern vs World Mix)
- Where the Dollars Moved (2023 -> 2032)
- What This Means (Commercial Playbook)
- Competitive Lens (Indicative)
- Signals to Watch
- Pathway Stage x End-use - Who Buys What, and Where Growth Concentrates
- World Context (2032 End-use Mix)
- World Market by Pathway Stage x End-use - 2023
- World Market by Pathway Stage x End-use - 2032
- Highlights (2032 Pattern vs Global Mix)
- Who Contributes the Growth (US$ M lift 2023->2032)
- What This Means (Commercial Playbook by Stage)
- Competitive Lens (Indicative, Non-exhaustive)
- Signals to Watch
- Pathway Stage x AI Technology - How Capability Mix Shifts Across the Cancer Pathway
- World Tech Mix
- World Market for Pathway Stage x AI Technology - 2023
- World Market for Pathway Stage x AI Technology - 2032
- Highlights (2032 Pattern vs Global Mix)
- Where the Dollars Moved (2023 -> 2032)
- What This Means (Commercial Playbook)
- Competitive Lens (indicative)
- Signals to Watch
- Pathway Stage x Revenue Stream
List of Tables
- Table 1: World Market for AI in Oncology Imaging by Region (2023-2032, USD Million)
- Table 2: World Market for Oncology Imaging AI by Country x End-Use Org (2023)
- Table 3: World Market for Oncology Imaging AI by Country x End-Use Org (2032)
- Table 4: World Market for Oncology Imaging AI by Modality (USD Mill, 2023-32)
- Table 5: World Market for Oncology Imaging AI by Clinical Application (USD Mill, 2023-32)
- Table 6: World Market for Oncology Imaging AI by Tumor Site (USD Mill, 2023-32)
- Table 7: World Market for Oncology Imaging AI by Revenue Stream (USD Mill, 2023-32)
- Table 8: World Market for Oncology Imaging AI by End-Use Org (USD Mill, 2023-32)
- Table 9: World Market for Oncology Imaging AI by Technology (USD Mill, 2023-32)
- Table 10: World Market for Oncology Imaging AI by Pathway Stage (USD Mill, 2023-32)
- Table 11: World Market for Oncology Imaging AI by Region x Modality (USD Mill, 2023)
- Table 12: World Market for Oncology Imaging AI by Region x Modality (USD Mill, 2032)
- Table 13: World Market for Oncology Imaging AI by Region x Revenue Stream (USD Mill, 2023)
- Table 14: World Market for Oncology Imaging AI by Region x Revenue Stream (USD Mill, 2032)
- Table 15: World Market for Oncology Imaging AI by Region x Clinical Application (USD Mill, 2023)
- Table 16: World Market for Oncology Imaging AI by Region x Clinical Application (USD Mill, 2032)
- Table 17: World Market for Oncology Imaging AI by Tumor Site x Modality (USD Mill, 2023)
- Table 18: World Market for Oncology Imaging AI by Tumor Site x Modality (USD Mill, 2032)
- Table 19: World Market for Oncology Imaging AI by Tumor Site x Clinical Application (USD Mill, 2023)
- Table 20: World Market for Oncology Imaging AI by Tumor Site x Clinical Application (USD Mill, 2032)
- Table 21: World Market for Oncology Imaging AI by Tumor Site x Revenue Stream (USD Mill, 2023)
- Table 22: World Market for Oncology Imaging AI by Tumor Site x Revenue Stream (USD Mill, 2032)
- Table 23: World Market for Oncology Imaging AI by Modality x Revenue Stream (2023)
- Table 24: World Market for Oncology Imaging AI by Modality X Revenue Stream (2032)
- Table 25: World Market for Oncology Imaging AI by Clinical Application x Revenue Stream (2023)
- Table 26: World Market for Oncology Imaging AI by Clinical Application x Revenue Stream (2032)
- Table 27: World Market for Oncology Imaging AI - By Pathway Stage X Revenue Stream (USD Mill, 2023)
- Table 28: World Market for Oncology Imaging AI - By Pathway Stage X Revenue Stream (USD Mill, 2032)
- Table 29: World Market for Oncology Imaging AI - By Pathway Stage X Modality (USD Mill, 2023)
- Table 30: World Market for Oncology Imaging AI - By Pathway Stage X Modality (USD Mill, 2032)
- Table 31: World Market for Oncology Imaging AI by Pathway Stage x Clinical Application (USD Mill, 2023)
- Table 32: World Market for Oncology Imaging AI by Pathway Stage x Clinical Application (USD Mill, 2032)
- Table 33: World Market for Oncology Imaging AI by Pathway Stage x End-use Org (USD Mill, 2023)
- Table 34: World Market for Oncology Imaging AI by Pathway Stage x End-use Org (USD Mill, 2032)
- Table 35: World Market for Oncology Imaging AI by Pathway Stage x AI Technology (USD Mill, 2023)
- Table 36: World Market for Oncology Imaging AI by Pathway Stage x AI Technology (USD Mill, 2032)
List of Figures
- Figure 1: Global Oncology Imaging AI - Country x End-Use Org (2032 Market Size and Index vs. Global Mix)
- Figure 2: Global Oncology Imaging AI - Country x End-Use (Dollar Lift 2023 to 2032)
- Figure 3: Global Oncology Imaging AI Market by Modality: 2023 vs. 2
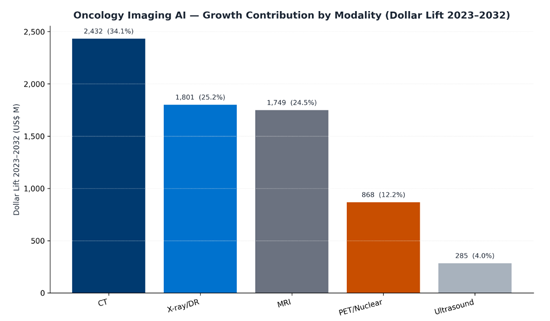
- Figure 4: Global Oncology Imaging AI Growth Contribution by Modality: Dollar Lift 2023 to 2
- Figure 5: Global Oncology Imaging AI Market by Clinical Application: 2023 vs. 2
- Figure 6: Global Oncology Imaging AI Growth Contribution by Clinical Application: Dollar Lift 2023 to 2
- Figure 7: Global Oncology Imaging AI Growth Contribution by Tumor Site: Dollar Lift 2023 to 2
- Figure 8: Global Oncology Imaging AI Growth Contribution by Tumor Site: Dollar Lift 2023 to 2
- Figure 9: Global Oncology Imaging Growth Contribution by Revenue Stream: Dollar Lift 2023 to 2
- Figure 10: Global Oncology Imaging Market by End-Use Org: 2023 vs. 2
- Figure 11: Global Oncology Imaging Growth Contribution by End-Use Org: Dollar Lift 2023 to 2
- Figure 12: Global Oncology Imaging Market by AI Technology: 2023 vs. 2
- Figure 13: World Market for Oncology Imaging AI by Technology (USD Mill, 2023-32)
- Figure 14: Global Oncology Imaging Market by Pathway Stage: 2023 vs. 2
- Figure 15: Global Oncology Imaging AI Growth Contribution by Pathway Stage: Dollar Lift 2023 to 2
- Figure 16: Global Oncology Imaging AI - Region x Modality (2032 Market Size and Index vs. Global Mix)
- Figure 17: Global Oncology Imaging AI - Region x Modality (Dollar Lift 2023 vs 2032)
- Figure 18: Global Oncology Imaging AI - Region x Revenue Stream (2032 Market Size and Index vs. Global Mix)
- Figure 19: Global Oncology Imaging AI - Region x Revenue Stream (Dollar Lift 2023 to 2032)
- Figure 20: World Market for Oncology Imaging AI by Region x Clinical Application (USD Mill, 2032)
- Figure 21: Global Oncology Imaging AI - Region x Clinical Application (Dollar Lift 2023 to 2032)
- Figure 22: Global Oncology Imaging AI - Tumor Site x Modality (2032 Market Size and Index vs. Global Mix)
- Figure 23: Global Oncology Imaging AI - Tumor Site x Modality (Dollar Lift 2023 to 2032)
- Figure 24: Global Oncology Imaging AI - Tumor Site x Clinical Application (2032 Market Size and Index vs. Global Mix)
- Figure 25: Global Oncology Imaging AI - Tumor Site x Clinical Application (Dollar Lift 2023 to 2032)
- Figure 26: Global Oncology Imaging AI - Tumor Site x Revenue Stream (2032 Market Size and Index vs. Global Mix)
- Figure 27: Global Oncology Imaging AI - Tumor Site x Revenue Stream (Dollar Lift 2023 to 2032)
- Figure 28: Global Oncology Imaging AI - Modality x Revenue Stream (2032 Market Size and Index vs. Global Mix)
- Figure 29: Global Oncology Imaging AI - Modality x Revenue Stream (Dollar Lift 2023 to 2032)
- Figure 30: Global Oncology Imaging AI - Clinical Application x Revenue Stream (2032 Market Size and Index vs. Global Mix)
- Figure 31: Global Oncology Imaging AI - Clinical Application x Revenue Stream (Dollar Lift 2023 to 2032)
- Figure 32: Global Oncology Imaging AI - Pathway Stage x Revenue Stream (2032 Market Size and Index vs. Global Mix)
- Figure 33: Global Oncology Imaging AI - Pathway Stage x Revenue Stream (Dollar Lift 2023 to 2032)
- Figure 34: Global Oncology Imaging AI - Pathway Stage x Modality (2032 Market Size and Index vs. Global Mix)
- Figure 35: Global Oncology Imaging AI - Pathway Stage x Modality (2032 Market Size and Index vs. Global Mix)
- Figure 36: Global Oncology Imaging AI - Pathway Stage x Clinical Application (2032 Market Size and Index vs. Global Mix)
- Figure 37: Global Oncology Imaging AI - Pathway Stage x Clinical Application (Dollar Lift 2023 to 2032)
- Figure 38: World Market for Oncology Imaging AI by Pathway Stage x End-use Org (2032 Market Size and Index vs. Global Mix)
- Figure 39: Global Oncology Imaging AI - Pathway Stage x End-Use (Dollar Lift 2023 to 2032)
- Figure 40: World Market for Oncology Imaging AI by Pathway Stage x AI Technology (2032 Over/Under Mix)
- Figure 41: World Market for Oncology Imaging AI by Pathway Stage x AI Technology (USD Mill, 2032)
 人工智慧(AI)在磁振造影(MRI)領域的市場-策略分析與預測(2026-2031)
 AI for MRI 市場 - 全球產業規模、佔有率、趨勢、機會及預測(按臨床應用、產品類型、技術、部署類型、最終用途、地區和競爭格局分類,2021-2031 年)
 2026-2032年全球慢性腦血管疾病人工智慧醫學影像軟體市場預測(按模式、部署類型、組件、應用和最終用戶分類)人工智慧賦能的X光診斷成像市場(按產品類型、解決方案類型、成像方式、人工智慧功能、應用、最終用戶和部署模式分類),全球預測(2026-2032年)人工智慧醫學影像軟體市場-肺炎診斷(按模式、部署類型、應用程式和最終用戶分類)-2026-2032年全球預測人工智慧醫療圖像軟體市場(心電圖方向):按產品類型、部署格式、成像方式、應用領域和最終用戶分類 - 全球預測(2026-2032年)人工智慧(AI)心血管疾病醫學影像軟體市場:按技術、影像方式、部署類型、應用和最終用戶分類-2026年至2032年全球預測基於CT影像的肺炎分流和評估軟體市場:按組件、部署類型、定價模式、應用和最終用戶分類 - 全球預測(2026-2032年)急性腦血管疾病的AI醫療圖像軟體市場:按組件、模式、部署模式、應用和最終用戶分類,全球預測(2026-2032年)腦血管疾病人工智慧醫學影像軟體市場:按組件、模式、部署類型、演算法、應用和最終用戶分類 - 全球預測(2026-2032 年)