


 |
市場調查報告書
商品編碼
2163589
節能建築:市場佔有率分析、行業趨勢和統計數據以及成長預測(2026-2031 年)Energy Efficient Building - Market Share Analysis, Industry Trends & Statistics, Growth Forecasts (2026 - 2031) |
||||||

※ 本網頁內容可能與最新版本有所差異。詳細情況請與我們聯繫。
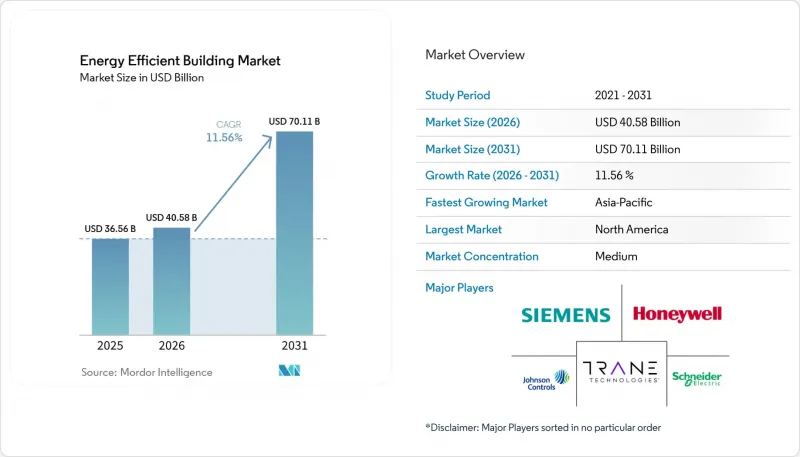
根據 Mordor Intelligence 預測,節能建築市場規模將從 2025 年的 365.6 億美元成長到 2026 年的 405.8 億美元,然後在 2031 年達到 701.1 億美元,2026 年至 2031 年的複合年成長率為 11.56%。
全球節能建築市場趨勢及洞察
更嚴格的建築能源法規和性能標準
《2027年國際節能規範》已最終定稿,預定2026年12月1日發布。該規範針對住宅的規定將所有氣候區的能源效率閾值降低了1分。規範也強制要求在空調空間內安裝風管系統。這些規定將促進採用該規範的項目中隔熱材料、氣密產品以及機械通風和回收系統的使用。修訂後的歐盟《建築能效指令》要求成員國制定非住宅建築的最低能源效率標準。這些規定將性能目標轉化為採購要求,從而有利於節能建築市場的發展。
中國的「十五」規劃要求所有新建都市區建築採用綠色建築標準,並支持建築整合太陽能(BIPV)系統。印度正逐步推行大規模商業和住宅建築的星級評定。這些變化使得主要建築區域的建築規範修訂週期更加協調一致。北美、歐洲、中國和印度的通用趨勢正在推動高效設備和控制系統規範的持續發展。新建建築創造了最初的需求基礎,而日益嚴格的基準值也促使那些不再符合區域要求的建築物維修。隨著合規要求從建築圍護結構和機械設備擴展到能源監測,節能建築市場正在不斷擴大。
能源價格上漲和需求/成本風險
能源成本的變化正在改變建築維修的經濟效益。參與需量反應計畫的商業建築每年可透過適度降低負荷和20至50小時的調度時間獲得8,000至45,000美元的收入。這筆收入是節能減排帶來的收益的補充。對於擁有多處物業並集中管理營運團隊的業主而言,這一點尤其重要。併網建築還可以根據季節性需求,每千瓦容量產生80至225美元的收入。這些收入使得控制系統、自動化和能源管理系統對財務團隊變得更加關鍵。
在投資決策中,能源價格波動與平均能源價格同等重要。採用分時電價或容量電價的建築與採用固定固定費率的建築面臨的營運風險不同。這種差異會影響哪些資產在維修資金方面獲得優先考慮。透過使用 OpenADR 閘道器,建築可以實現需量反應響應自動化,無需人工干預。能源管理系統可將電費降低 7% 至 27%,具體降幅取決於資產類型和可用測量數據的詳細程度。當公用事業獎勵和企業減排目標在同一專案上保持一致時,節能建築市場將展現出更廣泛的商業機會。
維修投資初期成本高,投資回收期長。
資金籌集困難仍然是商業和工業建築全面維修的主要障礙。這些項目需要在實現營運成本降低效益之前投入資金。老舊設施可能需要同時更換或整合多個舊有系統,這增加了專案的複雜性,也使得分階段投資變得困難。儘管業主意識到營運需求,但推遲維修會對節能建築市場產生影響。在涉及暖通空調、控制系統、建築圍護結構和能源管理系統等多個面向的專案中,資金籌措條件往往是關鍵因素。
美國第179D條稅收抵免政策將不再適用於2026年6月30日或之後開工的項目。此前,符合該抵免條件的項目必須比ASHRAE 90.1基準值降低至少25%的能源使用強度。取消這項抵免政策將降低符合資格的商業項目的成本節約效益。能源績效合約(ESPC)允許承包商轉移初始風險,以換取有保障的節能效果。雖然這些合約對聯邦和公共部門業主很有用,但它們的前提是能源服務公司(ESCO)市場成熟且擁有可靠的交易對象。在資金籌措結構有限的地區,節能建築市場將持續受到限制。
細分市場分析
截至2025年,商業建築佔節能建築市場佔有率的41.5%。辦公大樓、零售店和醫療機構面臨著集中的能源成本和日益嚴格的資訊揭露要求。此外,非住宅建築的最低性能標準也給這一領域帶來了直接的合規壓力。 LEED v5和BREEAM v7的認證提高了可衡量的建築性能在商業專案規劃中的重要性。商業建築業主通常管理多項資產,這促使他們採用集中式能源管理和可重複的維修方案。商業建築節能市場規模的擴大得益於對控制系統、冷暖氣空調(HVAC)升級、照明、通風和監控系統的投入。
工業建築的維修重點各不相同。製程熱整合、壓縮空氣效率和屋頂太陽能發電是關鍵的改進領域。當工業建築業主面臨資金預算限制時,能源效率績效合約的使用日益增加。如果承包商保證節能效果,這些合約可以為投資提供途徑。工業項目通常需要更緊密地協調能源效率維修和運作計劃。這可能會導致更長的實施週期,但也推動了對性能驗證和管理服務的需求。績效合約透過降低整體設施維修的初始資金門檻,使節能建築業受益。
預計到2031年,住宅建築市場將以12.7%的複合年成長率成長。這一成長主要受建築規範修訂、電氣化獎勵以及超低能耗住宅要求等因素的推動。中國的「十五」規劃大力推動超低能耗建築建設,其T/CABEE 107-2025標準已於2025年8月生效。該標準提高了對隔熱、氣密性和機械通風的要求。印度提案的大型建築星級評定體係可能會增加一二線城市對玻璃、隔熱材料和暖通空調設備的需求。隨著住宅需求的成長,節能建築市場將擁有更大的新建基礎,而不僅僅依賴商業設施的維修。
區域分析
到2025年,北美將佔據節能建築市場32.3%的佔有率。美國擁有大規模正在進行能源管理系統(EMS)和照明昇級的商業建築。此外,美國還擁有成熟的能源服務公司(ESCO)生態系統,為聯邦政府、公共機構和地方政府建築提供績效合約支援。企業淨零排放承諾正在推動對符合LEED和能源之星標準的專案的需求。在加拿大,除了努力達到省級能源標準外,還有大量老舊商業建築需要對其外圍護結構和暖通空調系統維修。在墨西哥,商業建築活動蓬勃發展,並且由於製造業投資的增加,其重要性日益凸顯。
由於第179D條將於2026年6月30日之後到期,一些建築工程可能會在資格失效前提前動工。這可能導致公共部門的性能合約活動在短期內增加。歐洲是第二大區域市場,這得益於《歐洲能源性能條例》(EPBD)針對非住宅建築所製定的最低性能標準。德國和法國是該地區最大的國內市場。波蘭擁有大量維修不佳的商業和住宅建築,吸引了投資者的目光。義大利和西班牙受益於維修計畫和國家獎勵,但自2022年以來,俄羅斯在歐洲綠色建築生態系統中的作用一直在下降。
預計到2031年,亞太地區的年複合成長率將達到14.1%。中國正在強制推行都市區新建築的綠色建築標準,並支持光伏建築整合(BIPV)。印度提案的大型建築節能星級(BEE STAR)評級框架預計將擴大旨在符合監管要求的維修和規範制定活動。日本和韓國正穩步推進先進的暖通空調(冷暖氣空調)和智慧控制系統。隨著都市化進程的加快,印尼、越南和泰國的重要性日益凸顯。南美洲以巴西和智利為主導,但資金籌措缺口和獎勵錯配仍是阻礙因素。沙烏地阿拉伯和阿拉伯聯合大公國正透過國家層級的脫碳議程支持中東和非洲的成長,其中南非和摩洛哥作為區域應用中心發揮關鍵作用。
其他好處:
- Excel格式的市場預測(ME)表
- 3個月的分析師支持
目錄
第1章:引言
- 研究假設和市場定義
- 調查範圍
第2章:調查方法
第3章執行摘要
第4章 市場狀況
- 市場概覽
- 市場促進因素
- 更嚴格的建築能效和性能標準
- 能源價格上漲和需求/成本風險
- 企業脫碳和綠建築認證的要求
- 公共獎勵促進能源效率維修和電氣化
- 利用現有建築數據進行基於人工智慧的缺陷檢測
- 透過柔軟性產生收入的併網建築
- 市場限制因素
- 維修初期成本高,投資回收期長。
- 業主和租戶之間的獎勵不匹配
- 傳統建築管理系統之間的互通性差距
- 熟練的建築控制系統整合商短缺
- 供應鏈分析
- 波特五力分析
- 科技趨勢
- 監理情勢
- 投資分析
第5章 市場規模與成長預測
- 依建築類型
- 住宅
- 商業的
- 產業
- 依組件類型
- 通風系統
- 照明技術
- 能源管理系統
- 建築控制系統
- 其他
- 透過技術
- 硬體
- 軟體
- 服務
- 按地區
- 北美洲
- 美國
- 加拿大
- 墨西哥
- 歐洲
- 德國
- 法國
- 義大利
- 西班牙
- 英國
- 波蘭
- 俄羅斯
- 其他歐洲國家
- 亞太地區
- 中國
- 印度
- 日本
- 韓國
- 澳洲
- 印尼
- 越南
- 泰國
- 其他亞太國家
- 南美洲
- 巴西
- 阿根廷
- 智利
- 其他南美國家
- 中東和非洲
- 沙烏地阿拉伯
- 阿拉伯聯合大公國
- 埃及
- 南非
- 摩洛哥
- 其他中東和非洲國家
- 北美洲
第6章 競爭情勢
- 市場集中度
- 策略趨勢
- 市佔率分析
- 公司簡介
- Johnson Controls
- Honeywell International Inc.
- Siemens AG
- Schneider Electric SE
- ABB Ltd
- Carrier Global Corporation
- Trane Technologies plc
- Daikin Industries, Ltd.
- Signify NV
- ROCKWOOL A/S
- Saint-Gobain SA
- Kingspan Group plc
- Owens Corning
- BASF SE
- Covestro AG
- The Dow Chemical Company
- Mitsubishi Electric Corporation
- Azbil Corporation
- Ameresco, Inc.
- GridPoint, Inc.
- KMC Controls, Inc.
第7章 市場機會與未來展望
According to Mordor Intelligence, the energy efficient building market size is expected to grow from USD 36.56 billion in 2025 to USD 40.58 billion in 2026 and is forecast to reach USD 70.11 billion by 2031 at 11.56% CAGR over 2026-2031.
Global Energy Efficient Building Market Trends and Insights
Stricter Building Energy Codes and Performance Standards
The 2027 International Energy Conservation Code is final, with publication targeted for December 1, 2026. Its residential provisions reduce Energy Rating Index thresholds by 1 point in every climate zone. The code also requires duct systems to be located in conditioned space. These provisions increase the use of insulation, air-sealing products, and mechanical ventilation recovery systems in projects that adopt the code. The revised EU Energy Performance of Buildings Directive requires member states to establish minimum energy performance standards for non-residential buildings. The energy-efficient building market benefits when these rules turn performance targets into procurement requirements.
China's 15th Five-Year Plan requires all new urban buildings to implement green building standards and supports building-integrated photovoltaics. India is advancing mandatory star ratings for large commercial and residential buildings. These changes bring code cycles in major construction regions closer together. A common direction across North America, Europe, China, and India supports continued specifications for efficient equipment and controls. New construction creates an early demand base, while tightening thresholds also encourage upgrades to buildings that no longer meet local requirements. The energy efficient building market gains breadth as compliance needs extend across building envelopes, mechanical systems, and energy monitoring.
Rising Energy Prices and Demand-Cost Exposure
Energy costs are changing the financial case for building upgrades. Commercial buildings participating in demand-response programs can receive USD 8,000 to USD 45,000 in annual revenue for modest curtailable loads and 20 to 50 dispatch hours. This revenue supplements the savings from lower energy use. It is especially relevant to real estate owners with several sites and centralized operating teams. Grid-interactive buildings can also receive USD 80 to USD 225 per kilowatt of capacity each season. These returns make controls, automation, and energy management systems more relevant to finance teams.
Energy price volatility has become as important as average energy prices for investment decisions. Buildings exposed to time-of-use tariffs and capacity charges have a different operating risk than buildings with flat tariffs. This difference can change which assets receive retrofit funding first. OpenADR gateways allow buildings to automate demand-response actions without relying on manual intervention. Energy management systems can reduce electricity billing costs by 7% to 27%, depending on asset type and available metering detail. The energy-efficient building market has a wider opportunity where utility incentives and corporate emissions commitments support the same project.
High Upfront Cost and Long Retrofit Payback Periods
Capital availability remains a primary barrier to comprehensive retrofits in commercial and industrial buildings. These projects require spending before operating savings can be realized. Older facilities may need several legacy systems to be replaced or integrated at once. This raises project complexity and makes phased investment harder. The energy-efficient building market is affected when owners postpone upgrades despite recognizing the operating need. Financing conditions are often decisive for projects involving HVAC, controls, building envelopes, and energy management systems together.
The U.S. Section 179D deduction is unavailable for projects that begin construction after June 30, 2026. The deduction had required a 25% or greater reduction in energy use intensity against an ASHRAE 90.1 baseline. Its removal reduces a cost offset for qualifying commercial projects. Energy Savings Performance Contracts can shift upfront risk to a contractor in exchange for guaranteed savings. These contracts are useful to federal and institutional owners, but they depend on mature ESCO markets and creditworthy counterparties. The energy-efficient building market will remain constrained in regions where these financing structures are limited.
Other drivers and restraints analyzed in the detailed report include:
- Corporate Decarbonization and Green Building Certification Requirements
- AI-Enabled Fault Detection from Existing Building Data
- Split Incentives Between Building Owners and Tenants
For complete list of drivers and restraints, kindly check the Table Of Contents.
Segment Analysis
Commercial buildings held 41.5% of the energy-efficient building market share in 2025. Office, retail, and healthcare buildings face concentrated energy costs and growing disclosure requirements. The segment also faces direct compliance pressure from minimum performance standards for non-residential buildings. LEED v5 and BREEAM Version 7 increase the importance of measurable building performance in commercial project planning. Commercial owners commonly manage multiple assets, which supports centralized energy management and repeatable retrofit programs. The energy-efficient building market size for commercial buildings is supported by spending on controls, HVAC upgrades, lighting, ventilation, and monitoring systems.
Industrial buildings have different retrofit priorities. Process heat integration, compressed-air efficiency, and rooftop solar are important improvement areas. Energy Savings Performance Contracts are gaining use where industrial owners have constrained capital budgets. These contracts can provide a route to investment when the contractor guarantees savings outcomes. Industrial projects often require closer coordination between energy upgrades and operating schedules. This can extend implementation timelines, but it also supports demand for commissioning and managed services. The energy efficient building industry benefits when performance contracts reduce the initial financial barrier to broader facility upgrades.
Residential buildings are forecast to grow at a 12.7% CAGR through 2031. Mandatory code cycles, electrification incentives, and ultra-low-energy housing requirements support this growth. China's 15th Five-Year Plan promotes ultra-low-energy building construction, and its T/CABEE 107-2025 standard took effect in August 2025. The standard raises requirements for insulation, air sealing, and mechanical ventilation. India's proposed large-building star-rating system could increase demand for glazing, insulation, and HVAC equipment in Tier 1 and Tier 2 cities. Residential demand gives the energy efficient building market a larger new-construction base, rather than relying solely on commercial retrofits.
Complete Report Scope:
- By Building Type
- Residential
- Commercial
- Industrial
- By Component Type
- Ventilation Systems
- Lighting Technologies
- Energy Management Systems
- Building Controls
- Others
- By Technology
- Hardware
- Software
- Services
- By Geography
- North America
- United States
- Canada
- Mexico
- Europe
- Germany
- France
- Italy
- Spain
- United Kingdom
- Poland
- Russia
- Rest of Europe
- Asia-Pacific
- China
- India
- Japan
- South Korea
- Australia
- Indonesia
- Vietnam
- Thailand
- Rest of Asia-Pacific
- South America
- Brazil
- Argentina
- Chile
- Rest of South America
- Middle East and Africa
- Saudi Arabia
- United Arab Emirates
- Egypt
- South Africa
- Morocco
- Rest of Middle East and Africa
- North America
Geography Analysis
North America held 32.3% of the energy-efficient building market share in 2025. The United States has a large commercial building base undergoing EMS and lighting upgrades. It also has a mature ESCO ecosystem that supports performance contracts in federal, institutional, and municipal buildings. Corporate net-zero commitments add to demand for LEED and ENERGY STAR-aligned projects. Canada adds provincial energy-code activity and an older commercial building stock that requires envelope and HVAC upgrades. Mexico is gaining relevance as manufacturing investment increases commercial construction activity.
The Section 179D sunset after June 30, 2026, may bring forward some construction starts before eligibility ends. This can create a near-term increase in public-sector performance-contract activity. Europe is the second-largest regional market, supported by the EPBD's minimum performance standards for non-residential buildings. Germany and France are the largest national markets in the region. Poland has an under-retrofitted commercial and residential building stock that attracts investment interest. Italy and Spain are benefiting from renovation programs and national incentives, while Russia's role in the European green building ecosystem has declined since 2022.
Asia-Pacific is forecast to grow at a 14.1% CAGR through 2031. China requires green building standards for new urban construction and supports building-integrated photovoltaics. India's proposed BEE star-rating framework for large buildings could expand compliance-led retrofit and specification activity. Japan and South Korea contribute steady spending on advanced HVAC and smart controls. Indonesia, Vietnam, and Thailand are gaining importance as urbanization increases. South America is led by Brazil and Chile, while financing gaps and split incentives remain constraints. Saudi Arabia and the United Arab Emirates support growth in the Middle East and Africa through national decarbonization agendas, with South Africa and Morocco acting as regional adoption hubs.
- Johnson Controls
- Honeywell International Inc.
- Siemens AG
- Schneider Electric SE
- ABB Ltd
- Carrier Global Corporation
- Trane Technologies plc
- Daikin Industries, Ltd.
- Signify N.V.
- ROCKWOOL A/S
- Saint-Gobain S.A.
- Kingspan Group plc
- Owens Corning
- BASF SE
- Covestro AG
- The Dow Chemical Company
- Mitsubishi Electric Corporation
- Azbil Corporation
- Ameresco, Inc.
- GridPoint, Inc.
- KMC Controls, Inc.
Additional Benefits:
- The market estimate (ME) sheet in Excel format
- 3 months of analyst support
TABLE OF CONTENTS
1 INTRODUCTION
- 1.1 Study Assumptions and Market Definition
- 1.2 Scope of the Study
2 RESEARCH METHODOLOGY
3 EXECUTIVE SUMMARY
4 MARKET LANDSCAPE
- 4.1 Market Overview
- 4.2 Market Drivers
- 4.2.1 Stricter Building Energy Codes and Performance Standards
- 4.2.2 Rising Energy Prices and Demand-Cost Exposure
- 4.2.3 Corporate Decarbonization and Green-Building Certification Requirements
- 4.2.4 Public Incentives for Energy-Efficient Retrofits and Electrification
- 4.2.5 AI-Enabled Fault Detection from Existing Building Data
- 4.2.6 Grid-Interactive Buildings for Flexibility Revenue
- 4.3 Market Restraints
- 4.3.1 High Upfront Cost and Long Retrofit Payback Periods
- 4.3.2 Split Incentives Between Building Owners and Tenants
- 4.3.3 Interoperability Gaps Across Legacy Building Systems
- 4.3.4 Shortage of Skilled Building-Controls Integrators
- 4.4 Supply-Chain Analysis
- 4.5 Porter's Five Forces Analysis
- 4.5.1 Bargaining Power of Suppliers
- 4.5.2 Bargaining Power of Buyers
- 4.5.3 Threat of New Entrants
- 4.5.4 Threat of Substitutes
- 4.5.5 Competitive Rivalry
- 4.6 Technology Outlook
- 4.7 Regulatory Landscape
- 4.8 Investment Analysis
5 MARKET SIZE AND GROWTH FORECASTS
- 5.1 By Building Type
- 5.1.1 Residential
- 5.1.2 Commercial
- 5.1.3 Industrial
- 5.2 By Component Type
- 5.2.1 Ventilation Systems
- 5.2.2 Lighting Technologies
- 5.2.3 Energy Management Systems
- 5.2.4 Building Controls
- 5.2.5 Others
- 5.3 By Technology
- 5.3.1 Hardware
- 5.3.2 Software
- 5.3.3 Services
- 5.4 By Geography
- 5.4.1 North America
- 5.4.1.1 United States
- 5.4.1.2 Canada
- 5.4.1.3 Mexico
- 5.4.2 Europe
- 5.4.2.1 Germany
- 5.4.2.2 France
- 5.4.2.3 Italy
- 5.4.2.4 Spain
- 5.4.2.5 United Kingdom
- 5.4.2.6 Poland
- 5.4.2.7 Russia
- 5.4.2.8 Rest of Europe
- 5.4.3 Asia-Pacific
- 5.4.3.1 China
- 5.4.3.2 India
- 5.4.3.3 Japan
- 5.4.3.4 South Korea
- 5.4.3.5 Australia
- 5.4.3.6 Indonesia
- 5.4.3.7 Vietnam
- 5.4.3.8 Thailand
- 5.4.3.9 Rest of Asia-Pacific
- 5.4.4 South America
- 5.4.4.1 Brazil
- 5.4.4.2 Argentina
- 5.4.4.3 Chile
- 5.4.4.4 Rest of South America
- 5.4.5 Middle East and Africa
- 5.4.5.1 Saudi Arabia
- 5.4.5.2 United Arab Emirates
- 5.4.5.3 Egypt
- 5.4.5.4 South Africa
- 5.4.5.5 Morocco
- 5.4.5.6 Rest of Middle East and Africa
- 5.4.1 North America
6 COMPETITIVE LANDSCAPE
- 6.1 Market Concentration
- 6.2 Strategic Moves
- 6.3 Market Share Analysis
- 6.4 Company Profiles (includes Global Level Overview, Market Level Overview, Core Segments, Financials as available, Strategic Information, Market Rank/Share, Products and Services, Recent Developments)
- 6.4.1 Johnson Controls
- 6.4.2 Honeywell International Inc.
- 6.4.3 Siemens AG
- 6.4.4 Schneider Electric SE
- 6.4.5 ABB Ltd
- 6.4.6 Carrier Global Corporation
- 6.4.7 Trane Technologies plc
- 6.4.8 Daikin Industries, Ltd.
- 6.4.9 Signify N.V.
- 6.4.10 ROCKWOOL A/S
- 6.4.11 Saint-Gobain S.A.
- 6.4.12 Kingspan Group plc
- 6.4.13 Owens Corning
- 6.4.14 BASF SE
- 6.4.15 Covestro AG
- 6.4.16 The Dow Chemical Company
- 6.4.17 Mitsubishi Electric Corporation
- 6.4.18 Azbil Corporation
- 6.4.19 Ameresco, Inc.
- 6.4.20 GridPoint, Inc.
- 6.4.21 KMC Controls, Inc.


