

 |
市場調查報告書
商品編碼
2155565
日本城市物流:市場佔有率分析、產業趨勢與統計及成長預測(2026-2031)Japan Urban Logistics - Market Share Analysis, Industry Trends & Statistics, Growth Forecasts (2026 - 2031) |
||||||

※ 本網頁內容可能與最新版本有所差異。詳細情況請與我們聯繫。
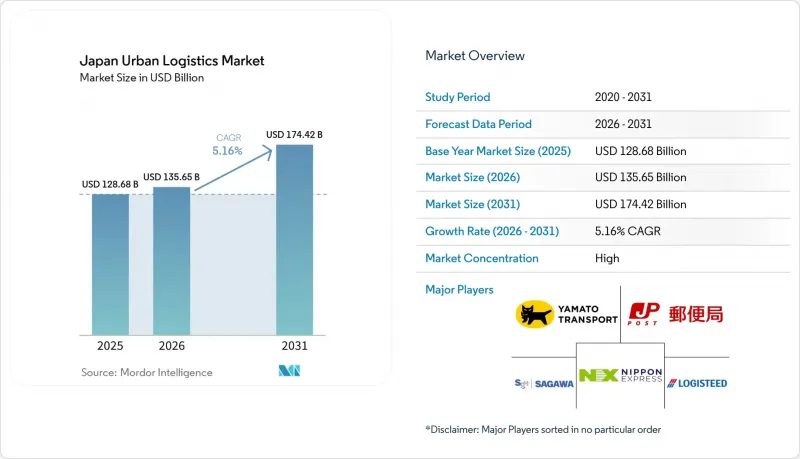
據 Mordor Intelligence 稱,2025 年日本城市物流市場規模為 1286.8 億美元,預計到 2031 年將達到 1744.2 億美元,而 2026 年為 1356.5 億美元,預測期內(2026-2031 年)的複合年成長率為 5.16%。
電子商務需求、司機短缺以及公共部門對物流設施的投資正在改變都市區物流網路的設計方式。本報告按服務類型(運輸服務、履約服務等)、配送速度(即時達/即時達、隔日達等)、客戶類型(B2B、B2C、C2C)、終端用戶行業(電子商務/零售、食品飲料及其他)以及城市(東京、橫濱、大阪、名古屋及其他)進行細分。市場預測以美元計價。
日本城市物流市場的趨勢與洞察
電子商務和全通路訂單的成長
隨著庫存更靠近都市區消費者,電子商務和全通路零售正在重塑日本的城市物流市場。 「暗店」和「門市出貨」模式縮短了配送距離,也提高了對快速訂單處理的需求。這種轉變正在縮小人口密集地區零售庫存和物流庫存之間的差距。此外,跨境電商進口需要在門戶地區設立保稅倉庫並辦理清履約手續。由於經銷商將揀貨、包裝和出貨外包以應對不斷成長的訂單量和更廣泛的產品線,物流服務商從中受益。這種情況有利於提供一體化履約和配送服務(而非僅提供小包裹運輸)的服務商。
自動化和自主配送可節省勞力
隨著2024年4月實施的勞動法修正案限制加班,節約勞動力的技術已成為日本城市物流市場的實際必需品。運輸公司需要在減少司機運作時間的同時,維持其服務範圍。 2025年8月,大和運輸在東京啟動了一項公寓大樓配送機器人試點計畫。這些機器人可以自動進出電梯,透過自動上鎖的入口,並可進行有人駕駛和無人駕駛的配送。該公司計劃在2026年底前全面推廣。自動化、路線最佳化、宅配櫃和本地履約等措施可以減輕因人手短缺而給司機帶來的負擔。擁有足夠財力實施這些系統的公司,相比那些無力進行同等升級的小規模運輸公司,可以獲得成本優勢。
司機短缺和加班限制
日本修訂後的勞動法引入了每年960小時的加班時間限制,這限制了司機的工作時間,而此前司機的工作時間一直被用來維持運輸能力。這項規定對全國的運輸企業都產生了影響,尤其是在東京都會區、大阪和名古屋的主要路線上。這將改變托運人的成本結構和可用的運輸能力。運輸業者不能再像規定實施前那樣,透過延長工作時間來應對運輸量的波動。集中裝載、最佳化路線設計和自動化將有助於彌補運輸能力的損失。日本的城市物流市場正在不斷調整,因為它必須同時兼顧法規合規和服務可靠性。
細分市場分析
到2025年,運輸服務將佔日本城市物流市場佔有率的58.72%,成為該市場中最大的業務部門。由於人口密度高,緊湊型配送區域內的「最後一公里」配送十分頻繁。所有實體訂單仍需在倉庫與客戶或營業場所之間進行運輸,因此運輸仍發揮著至關重要的作用。營運商正利用路線密度來提高車輛利用率,並確保在擁擠的大都市地區保持覆蓋。該板塊也持續面臨許多挑戰,例如如何確保司機安全以及如何限制加班。這些壓力進一步凸顯了路線規劃、運能共用以及倉庫與配送團隊之間更協調的交接的重要性。
日本城市物流市場的履約服務預計到2031年將以7.08%的複合年成長率成長。隨著產品線的擴展,跨境庫存和退貨管理難度日益增加,企業紛紛轉向外包揀貨、包裝和出貨業務。倉庫和城市儲存設施透過將暢銷產品更靠近需求點,構成了配送網路的下一層。位置城市附近的多層設施可滿足對配送時限要求較高的電商訂單。此外,當退貨需要進行檢驗、重新入庫和再次銷售時,逆向物流和附加價值服務也變得越來越重要。所有這些因素共同作用,進一步提升了履約能力對那些尋求超越簡單運輸利潤的企業的重要性。
預計到2025年,標準配送將佔日本城市物流市場規模的74.11%,證實了定時路線和集中配送在日本城市物流市場仍佔據核心地位。許多B2B貨物和對時間要求不高的消費者訂單仍然透過定時配送的方式進行運輸。標準服務有助於承運商整合小包裹並控制營運成本。當客戶不需要即時送達時,標準服務也提供了可靠的選擇。即使更快捷的服務不斷擴展,這種配送模式仍將保持其重要性。其龐大的規模為現有網路提供了堅實的基礎,以便部署更多專業化的服務。
預計到2031年,即時和當日送達服務將以6.25%的複合年成長率成長。這一成長主要得益於消費者習慣於本地履約、生鮮食品訂購以及在國內電商平台快速獲取商品的體驗。隔日達和預約送達仍然是那些希望柔軟性安排配送時間但又不想支付即時服務高昂費用的消費者的重要選擇。為了適應不同的配送速度,承運商需要管理不同的路線模式和庫存佈局。在需求旺盛地區附近建立微型倉配中心的業者能夠更有效地回應快速訂單。因此,日本的城市物流市場正在向一種結合了能夠處理大批量訂單的標準服務和精準快速響應能力的配送模式轉型。
其他好處:
- Excel格式的市場預測(ME)表
- 3個月的分析師支持
目錄
第1章:引言
- 研究假設和市場定義
- 調查範圍
第2章:調查方法
第3章執行摘要
第4章 市場狀況
- 市場概況及城市物流的重要性
- 市場促進因素
- 透過電子商務和全通路通路實現訂單成長
- 自動化和自主配送可節省勞力
- 政府主導的物流基礎設施現代化
- 為因應人口老化,優先考慮醫療保健和便利性的配送服務。
- 門市出貨及周邊地區的履約密度
- 都市區住宅機器人「搬運工」和儲物櫃的普及
- 市場限制因素
- 促進要素短缺和加班限制
- 人事費用、燃料成本、房地產成本和車輛擁有成本不斷上漲。
- 高密度都市區。
- 分散式退貨和配送方式選擇的經濟學
- 產業法規結構
- 價值鍊和分銷管道的結構分析
- 城市物流技術的大趨勢和結構性變化
- 波特五力分析
- 成本結構分析
- 城市基礎設施評估
- 永續性和綠色物流
- 地緣政治事件對供應鏈變化的影響
第5章 市場規模及成長預測(價值,2026-2031 年)
- 按服務類型
- 交通運輸服務
- 倉儲和城市儲存服務
- 履約服務
- 逆向物流服務
- 加值物流(VAL)服務
- 配送速度
- 即時出貨及當日送達
- 隔日送達
- 預定交付
- 標準配送
- 依客戶類型
- 企業對企業 (B2B) 交易
- B2C(Business-to-Consumer)
- 個人對個人(C2C)交易
- 按最終用途行業分類
- 電子商務與零售
- 食品/飲料
- 醫療和藥品
- 家用電子產品
- 時尚與服裝
- 汽車零件
- 工業和製造業
- 其他
- 按城市
- 東京
- 橫濱
- 大阪
- 名古屋
- 札幌
- 福岡
- 川崎
- Kobe
- 京都市
- 其他城市
第6章 競爭情勢
- 市場集中度
- 關鍵策略趨勢
- 市佔率分析
- 公司簡介
- Yamato Transport Co., Ltd.
- Sagawa Express Co., Ltd.
- Japan Post Transport Co., Ltd.
- NIPPON EXPRESS HOLDINGS, INC.
- LOGISTEED, Ltd.
- Seino Transportation Co., Ltd.
- Yusen Logistics Co., Ltd.
- Kintetsu World Express, Inc.
- SBS Holdings, Inc.
- DHL Group
- FedEx Corporation
- United Parcel Service, Inc.
- AZ-COM MARUWA Holdings Inc.
- SENKO Group Holdings Co., Ltd.
- Mitsubishi Logistics Corporation
- Sankyu Inc.
- Mitsui-Soko Holdings Co., Ltd.
- MARUBENI LOGISTICS CORPORATION
- ITOCHU LOGISTICS CORPORATION
- Yamatane Corporation
- The Sumitomo Warehouse Co., Ltd.
第7章 市場機會與未來展望
According to Mordor Intelligence, the Japan urban logistics market size was valued at USD 128.68 billion in 2025 and is estimated to grow from USD 135.65 billion in 2026 to reach USD 174.42 billion by 2031, at a CAGR of 5.16% during the forecast period (2026-2031).
E-commerce demand, constrained driver availability, and public investment in logistics facilities are changing how urban distribution networks are designed. This report is Segmented by Service Type (Transportation Services, Fulfillment Services, and More), by Delivery Speed (Instant and Same-Day Delivery, Next-Day Delivery, and More), by Customer Type (B2B, B2C, and C2C), by End-Use Industry (E-Commerce and Retail, Food and Beverage, and More), and by City (Tokyo, Yokohama, Osaka, Nagoya, and More). The Market Forecasts are Provided in Terms of Value (USD).
Japan Urban Logistics Market Trends and Insights
E-Commerce and Omnichannel Order Growth
E-commerce and omnichannel retail are reshaping the Japan urban logistics market because inventories now sit closer to urban consumers. Dark stores and ship-from-store models shorten delivery distances and raise the need for rapid order processing. The change reduces the separation between retail inventory and distribution inventory in dense areas. Cross-border inbound e-commerce also requires bonded warehousing and customs processing at gateway locations. Fulfillment providers benefit when merchants outsource picking, packing, and shipping to manage greater order volumes and broader product ranges. These conditions favor operators that offer connected fulfillment and transportation services instead of parcel movement alone.
Labor-Saving Automation and Autonomous Delivery
The April 2024 overtime limit of labour law reforms has made labor-saving technology a practical requirement for the Japan urban logistics market. Carriers need to preserve service coverage while operating with fewer available driver hours. Yamato Transport began a condominium delivery-robot demonstration in Tokyo during August 2025, using a robot that could navigate elevators, auto-lock entrances, and attended or unattended deliveries. The company targeted full-scale deployment by the end of 2026. Automation, route optimization, parcel lockers, and neighborhood fulfillment can reduce pressure on driver capacity. Operators with the capital to deploy these systems can create cost advantages over smaller carriers that cannot fund comparable upgrades.
Driver Shortages and Overtime Restrictions
The 960-hour annual overtime cap introduced in Japan's labour law reform limits the driver hours previously used to sustain transport capacity. The restriction affects carriers across Japan and is especially relevant on the Greater Tokyo, Osaka, and Nagoya corridors. It changes both the cost structure and the delivery capacity available to shippers. Carriers cannot depend on extended working hours to absorb volume fluctuations as they did before the rule took effect. Collaborative loading, improved route design, and automation can help replace lost capacity. The Japan urban logistics market faces a continuing adjustment because compliance and service reliability need to be managed at the same time.
Other drivers and restraints analyzed in the detailed report include:
- Government-Led Logistics Infrastructure Modernization
- Aging-Related Healthcare and Convenience Deliveries
- Rising Labor, Fuel, Real Estate, and Fleet Costs
For complete list of drivers and restraints, kindly check the Table Of Contents.
Segment Analysis
Transportation services held 58.72% of the Japan urban logistics market share in 2025, making them the largest activity within the Japan urban logistics market. High population density creates frequent last-mile movements within compact delivery areas. Transportation remains essential because every physical order still requires movement between a facility and a customer or business site. Operators use route density to improve vehicle utilization and maintain coverage across crowded urban catchments. The segment also remains exposed to driver availability and overtime restrictions. These pressures increase the value of route planning, shared capacity, and more coordinated handoffs between facilities and delivery teams.
The Japan urban logistics market size for fulfillment services is projected to grow at a 7.08% CAGR through 2031. Merchants are turning to outsourced pick-pack-ship operations as product ranges, cross-border inventory, and returns become harder to manage internally. Warehousing and urban storage form the next layer of the delivery network by placing fast-moving stock closer to demand. Multi-story, city-proximate facilities can support e-commerce orders that require shorter delivery windows. Reverse logistics and value-added services also gain relevance when returned goods need inspection, restocking, or resale processing. This mix makes fulfillment capability more important for providers seeking margin beyond basic transportation.
Standard delivery accounted for 74.11% of the Japan urban logistics market size in 2025, confirming that scheduled and batched routes remain the core of the Japan urban logistics market. Many B2B shipments and less time-sensitive consumer orders continue to move through planned delivery windows. Standard services help carriers consolidate parcels and control operating costs. They also provide a dependable option where customers do not need immediate fulfillment. This delivery format is likely to remain important even as faster services expand. Its scale gives established networks a broad base from which to develop more specialized offerings.
Instant and same-day delivery are projected to grow at a 6.25% CAGR through 2031. Growth is supported by neighborhood fulfillment, grocery orders, and consumers familiar with rapid availability on domestic e-commerce platforms. Next-day and scheduled delivery remain relevant where customers want timing flexibility without the cost of immediate service. The distinction between these speeds requires carriers to manage different route patterns and inventory positions. Providers that build micro-fulfillment capacity close to high-demand areas can serve rapid orders more effectively. The Japan urban logistics market is therefore moving toward a delivery mix that combines high-volume standard service with targeted fast-response capacity.
Complete Report Scope:
- By Service Type
- Transportation Services
- Warehousing and Urban Storage Services
- Fulfillment Services
- Reverse Logistics Services
- Value-Added Logistics (VAL) Services
- By Delivery Speed
- Instant and Same-Day Delivery
- Next-Day Delivery
- Scheduled Delivery
- Standard Delivery
- By Customer Type
- Business-to-Business (B2B)
- Business-to-Consumer (B2C)
- Consumer-to-Consumer (C2C)
- By End-Use Industry
- E-commerce and Retail
- Food and Beverage
- Healthcare and Pharmaceuticals
- Consumer Electronics
- Fashion and Apparel
- Automotive Parts
- Industrial and Manufacturing
- Others
- By City
- Tokyo
- Yokohama
- Osaka
- Nagoya
- Sapporo
- Fukuoka
- Kawasaki
- Kobe
- Kyoto
- Rest of Cities
List of Companies Covered in this Report:
- Yamato Transport Co., Ltd.
- Sagawa Express Co., Ltd.
- Japan Post Transport Co., Ltd.
- NIPPON EXPRESS HOLDINGS, INC.
- LOGISTEED, Ltd.
- Seino Transportation Co., Ltd.
- Yusen Logistics Co., Ltd.
- Kintetsu World Express, Inc.
- SBS Holdings, Inc.
- DHL Group
- FedEx Corporation
- United Parcel Service, Inc.
- AZ-COM MARUWA Holdings Inc.
- SENKO Group Holdings Co., Ltd.
- Mitsubishi Logistics Corporation
- Sankyu Inc.
- Mitsui-Soko Holdings Co., Ltd.
- MARUBENI LOGISTICS CORPORATION
- ITOCHU LOGISTICS CORPORATION
- Yamatane Corporation
- The Sumitomo Warehouse Co., Ltd.
Additional Benefits:
- The market estimate (ME) sheet in Excel format
- 3 months of analyst support
TABLE OF CONTENTS
1 Introduction
- 1.1 Study Assumptions and Market Definition
- 1.2 Scope of the Study
2 Research Methodology
3 Executive Summary
4 Market Landscape
- 4.1 Market Overview and Importance of Urban Logistics
- 4.2 Market Drivers
- 4.2.1 E-Commerce and Omnichannel Order Growth
- 4.2.2 Labor-Saving Automation and Autonomous Delivery
- 4.2.3 Government-Led Logistics Infrastructure Modernization
- 4.2.4 Aging-Related Healthcare and Convenience Deliveries
- 4.2.5 Ship-from-Store and Neighborhood Fulfillment Density
- 4.2.6 Urban Residential Robot Porter and Locker Adoption
- 4.3 Market Restraints
- 4.3.1 Driver Shortages and Overtime Restrictions
- 4.3.2 Rising Labor, Fuel, Real Estate, and Fleet Costs
- 4.3.3 Curb Access, Parking, and Dense-Urban Operating Constraints
- 4.3.4 Fragmented Returns and Delivery-Choice Economics
- 4.4 Industry Regulatory Framework
- 4.5 Value Chain and Distribution Channel Architecture Analysis
- 4.6 Technology Megatrends and Structural Shifts in Urban Logistics
- 4.7 Porter's Five Forces Analysis
- 4.7.1 Threat of New Entrants
- 4.7.2 Bargaining Power of Suppliers
- 4.7.3 Bargaining Power of Buyers
- 4.7.4 Threat of Substitutes
- 4.7.5 Rivalry Among Competitors
- 4.8 Cost Structure Analysis
- 4.9 Urban Infrastructure Assessment
- 4.10 Sustainability and Green Logistics
- 4.11 Impact of Geo-Political Events on Supply Chain Shifts
5 Market Size and Growth Forecasts (Value, 2026-2031)
- 5.1 By Service Type
- 5.1.1 Transportation Services
- 5.1.2 Warehousing and Urban Storage Services
- 5.1.3 Fulfillment Services
- 5.1.4 Reverse Logistics Services
- 5.1.5 Value-Added Logistics (VAL) Services
- 5.2 By Delivery Speed
- 5.2.1 Instant and Same-Day Delivery
- 5.2.2 Next-Day Delivery
- 5.2.3 Scheduled Delivery
- 5.2.4 Standard Delivery
- 5.3 By Customer Type
- 5.3.1 Business-to-Business (B2B)
- 5.3.2 Business-to-Consumer (B2C)
- 5.3.3 Consumer-to-Consumer (C2C)
- 5.4 By End-Use Industry
- 5.4.1 E-commerce and Retail
- 5.4.2 Food and Beverage
- 5.4.3 Healthcare and Pharmaceuticals
- 5.4.4 Consumer Electronics
- 5.4.5 Fashion and Apparel
- 5.4.6 Automotive Parts
- 5.4.7 Industrial and Manufacturing
- 5.4.8 Others
- 5.5 By City
- 5.5.1 Tokyo
- 5.5.2 Yokohama
- 5.5.3 Osaka
- 5.5.4 Nagoya
- 5.5.5 Sapporo
- 5.5.6 Fukuoka
- 5.5.7 Kawasaki
- 5.5.8 Kobe
- 5.5.9 Kyoto
- 5.5.10 Rest of Cities
6 Competitive Landscape
- 6.1 Market Concentration
- 6.2 Key Strategic Moves
- 6.3 Market Share Analysis
- 6.4 Company Profiles (includes Global level Overview, Market level overview, Core Segments, Financials as available, Strategic Information, Geographic/Network Coverage, Products and Services, and Recent Developments)
- 6.4.1 Yamato Transport Co., Ltd.
- 6.4.2 Sagawa Express Co., Ltd.
- 6.4.3 Japan Post Transport Co., Ltd.
- 6.4.4 NIPPON EXPRESS HOLDINGS, INC.
- 6.4.5 LOGISTEED, Ltd.
- 6.4.6 Seino Transportation Co., Ltd.
- 6.4.7 Yusen Logistics Co., Ltd.
- 6.4.8 Kintetsu World Express, Inc.
- 6.4.9 SBS Holdings, Inc.
- 6.4.10 DHL Group
- 6.4.11 FedEx Corporation
- 6.4.12 United Parcel Service, Inc.
- 6.4.13 AZ-COM MARUWA Holdings Inc.
- 6.4.14 SENKO Group Holdings Co., Ltd.
- 6.4.15 Mitsubishi Logistics Corporation
- 6.4.16 Sankyu Inc.
- 6.4.17 Mitsui-Soko Holdings Co., Ltd.
- 6.4.18 MARUBENI LOGISTICS CORPORATION
- 6.4.19 ITOCHU LOGISTICS CORPORATION
- 6.4.20 Yamatane Corporation
- 6.4.21 The Sumitomo Warehouse Co., Ltd.
7 Market Opportunities and Future Outlook
- 7.1 White-space and Unmet-Need Assessment

 全球災害救援物流市場(2026-2030 年)
 寵物物流市場:全球市場預測,2026-2032年
 本地配送網路市場預測至2034年-按服務地點類型、網路模型、服務、技術、位置類型和區域分類的全球分析伸縮式整平機市場:全球市場預測,2026-2032年2026-2030年全球工業物流市場2026-2030年全球電子商務及物流市場城市物流市場預測至2034年-按服務類型、配送模式、車輛類型、技術、最終用戶和地區分類的全球分析智慧物流市場預測至2034年-按解決方案類型、技術、部署模式、組織規模、最終用戶和地區分類的全球分析
 JIT(即時)物流市場規模、佔有率和成長分析:按服務類型、運輸方式、最終用戶、公司規模、部署和地區分類 - 行業預測,2026-2033 年碼頭邊緣整平機市場:全球市場預測,2026-2032年