


 |
市場調查報告書
商品編碼
2155299
美國工業製造物流:市場佔有率分析、行業趨勢和統計數據、成長預測(2026-2031 年)United States Industrial Manufacturing Logistics - Market Share Analysis, Industry Trends & Statistics, Growth Forecasts (2026 - 2031) |
||||||

※ 本網頁內容可能與最新版本有所差異。詳細情況請與我們聯繫。
根據 Mordor Intelligence 預測,美國工業製造物流市場規模預計將在 2025 年達到 3981.6 億美元,並在 2026 年達到 4151.5 億美元,到 2031 年達到 4946.5 億美元,在預測期(2026-2031 年)複合年成長率為 3.57%。
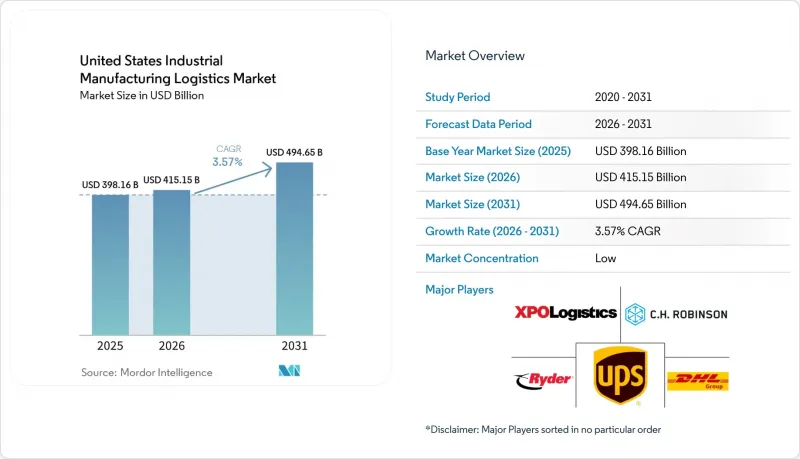
美國工業製造物流市場的成長並非主要受整體貨運週期驅動,而是受以國內生產、區域供應商基地和更快補貨週期為中心的製造網路重組所驅動。本報告按服務(運輸、倉儲和儲存、附加價值服務)、終端用戶產業(汽車、電子、機械設備及其他)、物流模式(輕資產、重資產、混合模式)和地區(東北部、西南部、西部、東南部、中西部)進行細分。市場預測以美元計價。
美國工業製造物流市場趨勢與洞察
近岸外包和美國製造業網路的重組
近岸外包正在改變美國工業製造物流市場的貨運需求結構。這是因為越來越多的生產項目依賴區域供應商網路,而非依賴長途海運的補貨模式。到2025年,美墨跨境貨運量將達到8,728億美元,代表了北美航運走廊上已存在的生產相關貿易規模。隨著最終組裝環節向消費地轉移,需求和零件採購日益本地化,製造商越來越需要支援跨內陸生產走廊的多源入境調度、越庫作業和供應商管理庫存(SMI)。這正在改變物流結構,使其從進口集中轉向更高密度的國內運輸、更短的運輸計劃週期以及更多的工廠配送,而這要求更強大的本地執行能力。在美國工業製造物流市場,那些在靠近中西部、東南部以及德克薩斯州-墨西哥貨運路線附近擁有資產、承運商合作夥伴關係和營運團隊的供應商將獲益最多。在訂單合約時,那些能夠應對不斷成長的生產活動,而無需迫使製造商建立內部物流能力(這不僅成本高昂,而且在人員管理方面也難以應對)的運營商正日益受到青睞。
工業貨運量跨越加拿大和墨西哥邊境的擴張
美國工業製造物流市場直接受益於北美工業貿易的擴張,因為區域生產計畫仍然依賴零部件、半成品和成品的穩定跨境運輸。預計到2025年,卡車運輸將占美墨兩國間貨運總值的73.6%,證實了陸路運輸仍是該走廊製造業相關貨物的主要運輸方式。此外,該走廊的物流表現日益不平衡,電子產品相關路線發展勢頭強勁,而部分汽車相關路線仍容易受到生產計畫變更和零件供應中斷的影響。這種多樣性意義重大,因為跨境成長不再僅僅意味著貨運量的增加;它還涉及諸多挑戰,例如文件處理、清關、時間安排和例外情況管理,這些對於庫存量極低的製造商至關重要。貿易規則的修訂和原產地規則的遵守進一步增加了營運的複雜性,凸顯了更嚴格的產品分類和邊境程序統一執行的必要性。在美國工業製造物流市場,能夠提供海關支援、報關協調和專門的跨境運輸能力的供應商,比那些只提供點對點幹線運輸的供應商更有優勢來滿足這一需求。
整個倉儲和運輸業都面臨司機和技術人員短缺的問題。
在美國工業製造物流市場,勞動力短缺仍是一個重大限制。這種短缺不僅限於司機,還包括倉儲、設備維護和技術支援等職位。這是一個至關重要的問題,因為車輛運輸能力不僅取決於可用牽引車和拖車的數量,還取決於能夠維護設備運作、正確裝載貨物並適應運輸計劃變更的合格人員的數量。即使在需求旺盛的情況下,熟練人員的短缺也會悄悄降低可用車輛的運輸能力,使依賴固定生產週期的製造商難以預測反應時間。跨境運輸路線也受到許可證、工作資格和文件要求的限制,這進一步縮小了曾經支撐邊境附近卡車運輸業務的勞動力來源。這些因素共同增加了零件流通中的服務風險,因為錯過取貨或延遲交貨會立即影響工廠的生產量和供應商的訂單處理。因此,在美國工業製造物流市場,沿線業務擴張速度正在放緩,因為製造業投資的成長速度超過了支持日常貨物運輸的勞動力成長速度。
細分市場分析
到2025年,運輸將占美國工業製造物流市場的62.50%。這反映了零件、半成品和成品在區域製造網路中的大量流動,這些流動需要在最終交貨前進行多次運輸。美國生產群集依賴較短的前置作業時間、靈活的運輸路線和頻繁的工廠補貨,而僅靠速度較慢的運輸方式難以大規模地滿足這些需求,因此公路貨運成為最大的運輸子領域。鐵路仍然發揮著至關重要的結構性作用,使製造商能夠利用長途和多式聯運來實現更穩定的運輸路線經濟效益。在那些可以在不影響工廠運作連續性的前提下確保稍長前置作業時間的運輸走廊,鐵路的重要性尤其突出。空運、海運和內河航運也發揮重要作用,儘管規模較小。空運支持緊急和高價值貨物的運輸,而內河航運在運輸化學品、散裝金屬和重型機械方面仍然發揮關鍵作用,因為這些貨物的運輸時間要求相對寬鬆。
預計2026年至2031年間,附加價值服務領域將以4.20%的複合年成長率成長,並有望成為成長最快的服務層級,因為製造商擴大將連接倉儲和運輸的專業營運外包。倉儲服務仍然是資本密集度最高的服務層級,因為現代化的建築設計、位置、合規流程和系統整合,以及占地面積和簡單的托盤容量,都日益影響合約價值。製造商正在利用外部供應商來完成諸如套件組裝、順序處理、供應商管理庫存(VMI)、貼標和合規文件等任務,因為這些職能需要訓練有素的員工和營運系統,而這些系統難以在工廠內部快速實施。在美國工業製造物流業,能夠將工廠附近的倉儲、受控運輸和執行支援整合到單一營運模式中的服務供應商,仍然比那些單獨銷售各項職能的公司更具優勢。
其他好處:
- Excel格式的市場預測(ME)表
- 3個月的分析師支持
目錄
第1章:引言
- 研究假設和市場定義
- 調查範圍
第2章:調查方法
第3章執行摘要
第4章 市場狀況
- 市場概覽
- 市場促進因素
- 近岸外包和美國製造業網路的重組
- 擴大與加拿大和墨西哥的跨境工業貨運
- 透過倉庫營運和物料搬運的自動化提高生產效率。
- 對時間要求嚴格、溫度可控的工業物流成長
- 在多節點製造供應鏈中實施控制塔
- 出於合規性考慮,對可追溯性和運輸透明度的需求日益成長。
- 市場限制因素
- 整個倉儲和運輸業都面臨司機和技術人員短缺的問題。
- 合約物流中的運費波動和利潤率壓力
- 工業貨運走廊的擁擠和通行能力限制
- 數位化物流網路中的網路安全和資料整合風險
- 價值供應鏈分析
- 監理情勢
- 技術展望
- 波特五力分析
- 地緣政治事件對市場的影響
第5章 市場規模與成長預測
- 按服務
- 運輸
- 路
- 鐵路
- 航空
- 海路和內河水道
- 倉庫/存儲
- 附加價值服務
- 運輸
- 按最終用戶行業分類
- 車
- 電子和半導體
- 機械/設備
- 化學與材料
- 航太/國防
- 其他終端用戶產業
- 物流模型
- 輕資產
- 資產密集型
- 混合
- 按地區
- 東北
- 西南
- 西方
- 東南
- 中西部
第6章 競爭情勢
- 市場集中度
- 策略趨勢
- 市佔率分析
- 公司簡介
- CH Robinson Worldwide, Inc.
- XPO, Inc.
- United Parcel Service, Inc.
- DHL Group
- DSV A/S
- Kuehne+Nagel International AG
- Ryder System, Inc.
- Hub Group, Inc.
- JB Hunt Transport Services, Inc.
- GXO Logistics, Inc.
- FedEx Corporation
- Penske Logistics, LLC
- NFI Industries, Inc.
- Geodis SA
- CMA CGM Group
- Expeditors International of Washington, Inc.
- Lineage, Inc.
- Americold Realty Trust, Inc.
- Kenco Group, Inc.
- Saddle Creek Corporation
第7章 市場機會與未來展望
According to Mordor Intelligence, the United States industrial manufacturing logistics market was valued at USD 398.16 billion in 2025 and estimated to grow from USD 415.15 billion in 2026 to reach USD 494.65 billion by 2031, at a CAGR of 3.57% during the forecast period (2026-2031).
Growth in the United States industrial manufacturing logistics market is tied less to broad freight cycles and more to the redesign of manufacturing networks around domestic production, regional supplier bases, and faster replenishment loops. This report is Segmented by Service (Transportation, Warehousing and Storage, and Value-Added Services), by End-User Industry (Automotive, Electronics, Machinery and Equipment, and More), by Logistics Model (Asset-Light, Asset-Heavy, and Hybrid), and by Geography (Northeast, Southwest, West, Southeast, and Midwest). The Market Forecasts are Provided in Terms of Value (USD).
United States Industrial Manufacturing Logistics Market Trends and Insights
Nearshoring and Reconfiguration of the United States Manufacturing Networks
Nearshoring is changing the structure of freight demand in the United States industrial manufacturing logistics market, as more production programs now depend on regional supplier webs rather than long, ocean-linked replenishment models. Cross-border freight between the United States and Mexico reached USD 872.8 billion in 2025, which shows the scale of production-related trade already moving through North American corridors. As final assembly shifts closer to the end, demand and component sourcing become more regional, manufacturers need more multi-origin inbound scheduling, cross-docking, and supplier-managed inventory support across inland production corridors. This shifts logistics architecture from import consolidation toward denser domestic movement, shorter haul planning cycles, and more frequent plant-facing handoffs, which require stronger local execution. The United States industrial manufacturing logistics market benefits most where providers already have assets, carrier relationships, and operating teams near the Midwest, Southeast, and Texas-Mexico freight lanes. Contract awards are increasingly favoring operators that can absorb step-ups in production activity without forcing manufacturers to build internal logistics capacity that is expensive to scale and hard to staff.
Expansion Of Cross-Border Industrial Freight Flows With Canada And Mexico
The United States industrial manufacturing logistics market is drawing direct support from higher North American industrial trade, as regional production plans still rely on steady cross-border movement of parts, subassemblies, and finished goods. Trucks accounted for 73.6% of the United States-Mexico freight value in 2025, confirming that land-based transport remains the dominant channel for manufacturing-linked cargo on this corridor. Corridor performance is also becoming more uneven, with electronics-related lanes showing stronger momentum while some automotive routes remain more exposed to production scheduling changes and component disruptions. That mix matters because cross-border growth is no longer just a volume story; it is also a documentation, customs, timing, and exception-management story for manufacturers that run lean inventories. Reviews of trade rules and origin compliance add another layer of operating complexity, underscoring the need for stronger classification discipline and more consistent execution of border processes. In the United States industrial manufacturing logistics market, providers that combine customs support, brokerage coordination, and dedicated cross-border capacity are better placed to capture this demand than operators that only sell point-to-point linehaul.
Driver And Technician Shortages Across Warehousing And Transportation
Labor pressure remains a real constraint in the United States industrial manufacturing logistics market, as shortages are not limited to drivers but extend to warehouse operations, equipment maintenance, and technical support roles. This matters because fleet capacity is shaped not only by available tractors and trailers, but also by the number of qualified people who can keep equipment running, load freight correctly, and support schedule changes. Technician gaps can quietly reduce usable fleet capacity even when demand is present, which makes response times less predictable for manufacturers that depend on fixed production windows. Cross-border lanes face added stress when licensing, work eligibility, and documentation requirements narrow the available labor pool that once helped support border-adjacent trucking operations. That combination creates greater service risk in component flows, where missed pickups or delayed handoffs can quickly affect plant output and supplier sequencing. The United States industrial manufacturing logistics market, therefore, faces slower scaling in corridors where manufacturing investment is rising faster than the labor base that supports daily freight execution.
Other drivers and restraints analyzed in the detailed report include:
- Automation-Led Productivity Gains In Warehousing And Material Handling
- Growth Of Time-Sensitive And Temperature-Controlled Industrial Logistics
- Freight Rate Volatility And Margin Compression In Contract Logistics
For complete list of drivers and restraints, kindly check the Table Of Contents.
Segment Analysis
Transportation accounted for 62.50% of the United States industrial manufacturing logistics market in 2025, reflecting the heavy flow of parts, subassemblies, and finished goods across regional manufacturing networks that require repeated movements before final delivery. Road freight remains the largest transportation sub-segment because United States production clusters depend on short lead times, flexible routing, and frequent plant replenishment that are difficult to support at scale through slower modes alone. Rail still plays an important structural role, enabling manufacturers to use longer-haul and intermodal moves for more stable lane economics, especially on corridors that can tolerate slightly wider lead-time buffers without risking plant continuity. Air freight, sea, and inland waterways serve narrower but important functions, with air supporting urgent and high-value moves while water-linked freight remains relevant for chemicals, bulk metals, and heavy equipment flows that are less time-critical.
The value-added services segment is projected to grow at a 4.20% CAGR from 2026 to 2031, making it the fastest-moving service tier as manufacturers outsource more task-specific operations that sit between storage and transportation. Warehousing and storage remains the most capital-intensive service layer because modern building design, site proximity, compliance processes, and system integration increasingly shape contract value as much as floor space or simple pallet capacity. Manufacturers are using external providers for kitting, sequencing, vendor-managed inventory, labeling, and compliance documentation because these functions require trained labor and operating systems that are difficult to stand up quickly inside the plant organization. In the United States industrial manufacturing logistics industry, service providers that can connect plant-adjacent warehousing, controlled transportation, and execution support in one operating model are gaining an edge over firms that still sell each function separately.
Complete Report Scope:
- By Service
- Transportation
- Road
- Rail
- Air
- Sea and Inland Waterways
- Warehousing and Storage
- Value-added Services
- Transportation
- By End-User Industry
- Automotive
- Electronics and Semiconductors
- Machinery and Equipment
- Chemicals and Materials
- Aerospace and defense
- Other End-User Industries
- By Logistics Model
- Asset-Light
- Asset-Heavy
- Hybrid
- By Geography
- Northeast
- Southwest
- West
- Southeast
- Midwest
List of Companies Covered in this Report:
- C.H. Robinson Worldwide, Inc.
- XPO, Inc.
- United Parcel Service, Inc.
- DHL Group
- DSV A/S
- Kuehne + Nagel International AG
- Ryder System, Inc.
- Hub Group, Inc.
- J.B. Hunt Transport Services, Inc.
- GXO Logistics, Inc.
- FedEx Corporation
- Penske Logistics, LLC
- NFI Industries, Inc.
- Geodis S.A.
- CMA CGM Group
- Expeditors International of Washington, Inc.
- Lineage, Inc.
- Americold Realty Trust, Inc.
- Kenco Group, Inc.
- Saddle Creek Corporation
Additional Benefits:
- The market estimate (ME) sheet in Excel format
- 3 months of analyst support
TABLE OF CONTENTS
1 Introduction
- 1.1 Study Assumptions and Market Definition
- 1.2 Scope of the Study
2 Research Methodology
3 Executive Summary
4 Market Landscape
- 4.1 Market Overview
- 4.2 Market Drivers
- 4.2.1 Nearshoring and Reconfiguration of the United States Manufacturing Networks
- 4.2.2 Expansion of Cross-Border Industrial Freight Flows with Canada and Mexico
- 4.2.3 Automation-Led Productivity Gains in Warehousing and Material Handling
- 4.2.4 Growth of Time-Sensitive and Temperature-Controlled Industrial Logistics
- 4.2.5 Control Tower Adoption for Multi-Node Manufacturing Supply Chains
- 4.2.6 Compliance-Driven Demand for Traceability and Shipment Visibility
- 4.3 Market Restraints
- 4.3.1 Driver and Technician Shortages Across Warehousing and Transportation
- 4.3.2 Freight Rate Volatility and Margin Compression in Contract Logistics
- 4.3.3 Congestion and Capacity Constraints in Industrial Freight Corridors
- 4.3.4 Cybersecurity and Data Integration Risk in Digitized Logistics Networks
- 4.4 Value / Supply-Chain Analysis
- 4.5 Regulatory Landscape
- 4.6 Technological Outlook
- 4.7 Porter's Five Forces Analysis
- 4.7.1 Bargaining Power of Suppliers
- 4.7.2 Bargaining Power of Buyers
- 4.7.3 Threat of New Entrants
- 4.7.4 Threat of Substitutes
- 4.7.5 Industry Rivalry
- 4.8 Impact of Geopolitical Events on the Market
5 Market Size & Growth Forecasts (Value in USD)
- 5.1 By Service
- 5.1.1 Transportation
- 5.1.1.1 Road
- 5.1.1.2 Rail
- 5.1.1.3 Air
- 5.1.1.4 Sea and Inland Waterways
- 5.1.2 Warehousing and Storage
- 5.1.3 Value-added Services
- 5.1.1 Transportation
- 5.2 By End-User Industry
- 5.2.1 Automotive
- 5.2.2 Electronics and Semiconductors
- 5.2.3 Machinery and Equipment
- 5.2.4 Chemicals and Materials
- 5.2.5 Aerospace and defense
- 5.2.6 Other End-User Industries
- 5.3 By Logistics Model
- 5.3.1 Asset-Light
- 5.3.2 Asset-Heavy
- 5.3.3 Hybrid
- 5.4 By Geography
- 5.4.1 Northeast
- 5.4.2 Southwest
- 5.4.3 West
- 5.4.4 Southeast
- 5.4.5 Midwest
6 Competitive Landscape
- 6.1 Market Concentration
- 6.2 Strategic Moves
- 6.3 Market Share Analysis
- 6.4 Company Profiles (includes Global Level Overview, Market Level Overview, Core Segments, Financials as available, Strategic Information, Market Rank/Share, Products and Services, Recent Developments)
- 6.4.1 C.H. Robinson Worldwide, Inc.
- 6.4.2 XPO, Inc.
- 6.4.3 United Parcel Service, Inc.
- 6.4.4 DHL Group
- 6.4.5 DSV A/S
- 6.4.6 Kuehne + Nagel International AG
- 6.4.7 Ryder System, Inc.
- 6.4.8 Hub Group, Inc.
- 6.4.9 J.B. Hunt Transport Services, Inc.
- 6.4.10 GXO Logistics, Inc.
- 6.4.11 FedEx Corporation
- 6.4.12 Penske Logistics, LLC
- 6.4.13 NFI Industries, Inc.
- 6.4.14 Geodis S.A.
- 6.4.15 CMA CGM Group
- 6.4.16 Expeditors International of Washington, Inc.
- 6.4.17 Lineage, Inc.
- 6.4.18 Americold Realty Trust, Inc.
- 6.4.19 Kenco Group, Inc.
- 6.4.20 Saddle Creek Corporation
7 Market Opportunities & Future Outlook
- 7.1 White-Space and Unmet-Need Assessment

 全球災害救援物流市場(2026-2030 年)
 寵物物流市場:全球市場預測,2026-2032年
 本地配送網路市場預測至2034年-按服務地點類型、網路模型、服務、技術、位置類型和區域分類的全球分析伸縮式整平機市場:全球市場預測,2026-2032年2026-2030年全球工業物流市場2026-2030年全球電子商務及物流市場城市物流市場預測至2034年-按服務類型、配送模式、車輛類型、技術、最終用戶和地區分類的全球分析智慧物流市場預測至2034年-按解決方案類型、技術、部署模式、組織規模、最終用戶和地區分類的全球分析
 JIT(即時)物流市場規模、佔有率和成長分析:按服務類型、運輸方式、最終用戶、公司規模、部署和地區分類 - 行業預測,2026-2033 年碼頭邊緣整平機市場:全球市場預測,2026-2032年