


 |
市場調查報告書
商品編碼
2155291
資料檢測與反應:市場佔有率分析、產業趨勢與統計、成長預測(2026-2031)Data Detection and Response - Market Share Analysis, Industry Trends & Statistics, Growth Forecasts (2026 - 2031) |
||||||

※ 本網頁內容可能與最新版本有所差異。詳細情況請與我們聯繫。
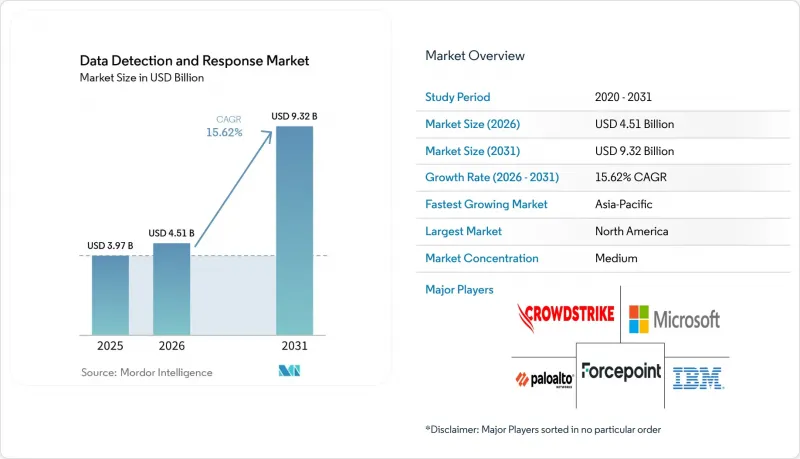
據 Mordor Intelligence 稱,2025 年數據檢測和響應市場價值為 39.7 億美元,預計到 2031 年將從 2026 年的 45.1 億美元成長到 93.2 億美元,預測期(2026-2031 年)的複合年成長率為 15.62%。
全球數據檢測與響應市場趨勢及洞察
對敏感資料即時監控的需求正在推動平台的演進。
企業越來越需要能夠近乎即時地識別和遏制可疑存取事件的系統。 IBM 發布的《2025 年資料外洩報告》指出,在人工智慧(AI)使用率高但未受監控的企業中,資料外洩的中位數偵測時間為 247 天。銀行、金融服務、保險、醫療保健和生命科學等行業面臨的壓力尤其巨大,因為資料外洩可能帶來監管、法律和聲譽風險。利用行為模式,團隊可以區分正常的員工活動和大量下載、橫向機芯以及 AI 代理驅動的資料傳輸。 2026 年 3 月,CrowdStrike 推出了 Falcon 資料安全解決方案,該方案透過單一主機偵測、分類和阻止跨端點、SaaS、雲端和 AI 工作流程的資料竊取行為。合成資料和 AI 驅動的社交工程攻擊的興起進一步削弱了僅依賴簽章控制的有效性。
雲端運算和SaaS資料的激增已經超過了傳統DLP應對措施的能力。
SaaS 應用和人工智慧工具正在削弱傳統的企業資料邊界。雲端安全聯盟 (CSA) 引用 Netskope 的數據指出,到 2025 年年中,GenAI SaaS 應用的數量將超過 1550 個,較年初的 317 個顯著成長。基於規則的資料遺失防護 (DLP) 系統難以識別未經授權的 AI 管線或跨雲端租用戶分佈的資訊中的異常情況。敏感記錄可以在模型、聊天記錄和工作區之間移動,如果沒有持續的事件追蹤,就很難重建資料處理歷程。 ESET 的研究表明,雲端安全是全球中小企業 2026 年網路安全投資計畫中的第二大優先事項。這正在擴大大型企業以外的數據發現與回應 (DDR) 市場對雲端原生和 SaaS 工具的需求。
整合異質資料來源的複雜性會延長實施週期。
DDR平台需要收集並關聯來自雲端儲存、資料庫、SaaS API、終端代理和本機資料倉儲的記錄。每個資料來源可能使用不同的模式、存取日誌格式和身份驗證方法。運行多重雲端環境的組織也可能針對AWS、Microsoft Azure、Google Cloud和SaaS應用程式採用不同的稽核格式。複雜的部署可能需要6到12個月的規範化工作,才能建立行為模式。在東南亞、撒哈拉以南非洲和南美洲,缺乏原生API的傳統基礎設施會進一步增加工作量。關於人力資源和ERP系統的管治決策也需要IT、法務和資料保護團隊之間的協商一致,這可能會減緩中型企業的採用速度。
細分市場分析
到2025年,平台將佔據資料發現與回應 (DDR) 市場64.89%的佔有率。買家傾向於採用整合架構,透過單一管理主機關聯跨端點、雲端服務和SaaS應用程式的存取事件。平台細分市場的規模反映了市場正在從孤立的發現工具轉向其他解決方案。 2026年3月,CrowdStrike發表了Falcon Data Security,這是一款集資料發現、分類和防盜於一體的整合解決方案。對於大規模安全團隊而言,這種整合正成為採購時的關鍵考量。
預計到2031年,服務領域的複合年成長率將達到27.11%。各組織機構正在尋求託管資料偵測與回應 (DDR)、諮詢、實施和分析師支援服務,以減輕內部工作負擔。當團隊缺乏資料安全專業知識時,這種需求尤其突出。純粹的資料安全供應商正在將分析師回應支援添加到訂閱方案中,以縮短實施週期並提高客戶維繫。平台提供者和服務公司也擴大將他們的產品捆綁銷售。因此,在整個預測期內,平台收入和業務收益之間的界線將變得越來越模糊。
到 2025 年,數據活動監控將佔數據發現和回應市場收入的 31.83%。在應用更複雜的控制措施之前,組織需要清楚地記錄誰存取了資料、存取時間以及存取來源。資料發現和分類在後續工作流程中建立了保密環境。數據行為分析有助於識別偏離預期使用模式的行為。資料遺失和外洩防護會在活動構成重大風險時應用控制措施。
在數據檢測與回應市場,事件偵測、回應和自動化修復預計到2031年將以29.43%的複合年成長率成長。安全團隊日益意識到,僅靠監控而沒有遏制措施,漏洞仍會在很長一段時間內無法解決。 2026年8月,Varonis推出了“基於代理意圖的存取控制”,該功能可以評估AI代理的意圖,並即時阻止違反策略的操作。此功能包含對某些操作進行線上編輯和人工核准的選項。隨著供應商整合這五項功能,資料偵測與回應市場各子類別之間的界線可能會變得模糊。這可能導致2031年,專業供應商之間的併購活動進一步活性化。
區域分析
到2025年,北美將佔據數據檢測與響應市場41.39%的佔有率。資料密集型企業、成熟的網路保險體係以及聯邦和州隱私法規的重疊,正在推動該地區的需求。美國仍是最大的國內市場,其市場格局受《健康保險流通與責任法案》(HIPAA)、紐約州金融服務部網路安全法規第500部分以及各州隱私法的影響。在加拿大和墨西哥,隨著雲端遷移導致資料可見性方面的差距,金融服務和政府部門的需求正在成長。南美是一個新興市場,巴西在其中扮演主導角色。在巴西,《一般資料保護法》(LGPD)強制要求資料保護和違規通知。包括阿根廷在內的其他南美國家仍處於起步階段,但隨著跨境金融交易和數位投資的增加,對數據監控的需求也不斷成長。
歐洲是數據檢測與響應市場第二大區域。德國、英國和法國在數據檢測與回應技術的應用方面處於領先地位,尤其是在金融機構和關鍵基礎設施營運商。德國的NIS2實施法將受該法約束的公司數量擴大到2025年12月的29,000家。隨著許多歐洲跨國公司總部必須維護集中且可審計的存取記錄,比荷盧經濟聯盟國家正在崛起為成長區域。 2025年6月,歐盟網路安全與資訊安全局(ENISA)表示,應在可行的情況下利用自動化、持續監控。該指南旨在確保每個受監管的歐洲行業的採購標準與資料檢測與回應的核心功能保持一致。
預計到2031年,亞太地區的年複合成長率將達到19.57%。中國、印度、日本、韓國和澳洲的雲端運算應用正在穩步推進,同時各國也在製定更詳細的國內資料保護要求。印度、中國和新加坡正在建立以數據課責為重點的框架。日本金融廳和日本銀行發布了2026年關於人工智慧前沿威脅和人工智慧整合金融系統資料安全的指導意見。中東和非洲地區的雲端運算應用仍處於早期階段,其中阿拉伯聯合大公國和沙烏地阿拉伯是重要的成長中心。奈及利亞、南非和埃及的數位金融服務正在蓬勃發展,這些國家可能會累積大量企業數據資產,而這些數據資產未來可能會受到監控。
其他好處:
- Excel格式的市場預測(ME)表
- 3個月的分析師支持
目錄
第1章:引言
- 研究假設和市場定義
- 調查範圍
第2章:調查方法
第3章執行摘要
第4章 市場狀況
- 市場概覽
- 市場促進因素
- 對敏感資料即時監控的需求正在推動平台的演進。
- 雲端運算和SaaS資料的激增已經超過了傳統DLP應對措施的能力。
- 資訊外洩揭露和資料保護義務正在推動合規驅動型採購。
- 保全行動工具的整合正在將預算重新導向統一平台。
- AI代理和影子分析中的資料沿襲支援範圍
- 網路保險中有關資料外洩的證據要件
- 市場限制因素
- 整合異質資料來源的複雜性延長了實施週期。
- 需要專業技能和持續調整。
- 隱私和員工監控管治
- 來自舊式和未經授權環境的遙測資料不完整。
- 價值鏈分析
- 宏觀經濟因素的影響
- 監理情勢
- 技術展望
- 波特五力分析
第5章 市場規模與成長預測
- 按組件
- 平台
- 服務
- 透過安全功能
- 資料檢測與分類
- 數據活動監控
- 數據行為分析
- 防止資料遺失和資料外洩
- 事件偵測、回應和自動修復。
- 部署模式
- 雲
- 現場
- 混合
- 按組織規模
- 大公司
- 小型企業
- 按行業分類
- 政府和公共行政
- 工業製造
- 零售與電子商務
- 運輸/物流
- 能源公用事業
- 石油和天然氣
- IT/通訊
- 媒體與娛樂
- 教育和研究機構
- 醫療保健和生命科學
- 銀行、金融服務和保險(BFSI)
- 其他工業部門
- 按地區
- 北美洲
- 美國
- 加拿大
- 墨西哥
- 南美洲
- 巴西
- 阿根廷
- 其他南美國家
- 歐洲
- 德國
- 英國
- 法國
- 義大利
- 比荷盧經濟聯盟
- 其他歐洲國家
- 亞太地區
- 中國
- 日本
- 印度
- 韓國
- 澳洲
- 其他亞太國家
- 中東和非洲
- 中東
- 阿拉伯聯合大公國
- 沙烏地阿拉伯
- 其他中東國家
- 非洲
- 南非
- 奈及利亞
- 埃及
- 其他非洲國家
- 中東
- 北美洲
第6章 競爭情勢
- 市場集中度
- 策略趨勢
- 市佔率分析
- 公司簡介
- IBM Corporation
- Forcepoint LLC
- Microsoft Corporation
- Palo Alto Networks, Inc.
- CrowdStrike Holdings, Inc.
- Varonis Systems, Inc.
- Cyberhaven, Inc.
- Broadcom Inc.
- Proofpoint, Inc.
- Trellix
- Fortra, LLC
- Fortinet, Inc.
- SentinelOne, Inc.
- Cisco Systems, Inc.
- Darktrace plc
- Exabeam, Inc.
- Rapid7, Inc.
- Arctic Wolf Networks, Inc.
- Secureworks Corp.
- Huntress Labs Incorporated
- BigID, Inc.
- Cyera, Inc.
- Securiti, Inc.
- Netskope, Inc.
- Nightfall AI, Inc.
- Kitecyber, Inc.
- Strac, Inc.
第7章 市場機會與未來展望
According to Mordor Intelligence, the data detection and response market size was valued at USD 3.97 billion in 2025 and is estimated to grow from USD 4.51 billion in 2026 to reach USD 9.32 billion by 2031, at a CAGR of 15.62% during the forecast period (2026-2031).
Global Data Detection and Response Market Trends and Insights
Real-Time Sensitive-Data Monitoring Demand Drives Platform Evolution
Organizations increasingly need systems that can identify and contain suspicious access events in near real time. IBM reported a 247-day median detection timeline among organizations with high levels of unmonitored AI usage in its 2025 breach report. The pressure is strongest in banking, financial services, insurance, healthcare, and life sciences, where a data exfiltration event can create regulatory, legal, and reputational exposure. Behavioral baselines help teams separate normal employee activity from bulk downloads, lateral movement, and AI-agent transfers. CrowdStrike introduced Falcon Data Security in March 2026 to discover, classify, and stop data theft across endpoints, SaaS, cloud, and AI workflows through one console. Synthetic data and AI-supported social engineering further reduce the value of signature-only controls.
Cloud and SaaS Data Sprawl Outpaces Conventional DLP Controls
SaaS applications and AI tools have weakened the traditional enterprise data perimeter. The Cloud Security Alliance cited Netskope data showing more than 1,550 GenAI SaaS applications by mid-2025, compared with 317 at the beginning of that year. Rule-based data loss prevention systems cannot readily identify behavior anomalies in unsanctioned AI pipelines or fragmented information across cloud tenants. Sensitive records can move between models, chat histories, and workspaces, which makes data lineage harder to reconstruct without continuous event tracking. ESET identified cloud security as the second-highest planned cybersecurity investment priority among small and medium-sized businesses globally in 2026. This extends demand for cloud-native and SaaS-delivered tools beyond large enterprises in the data detection and response market.
Integration Complexity Across Heterogeneous Data Sources Extends Deployment Timelines
DDR platforms must collect and correlate records from cloud storage, databases, SaaS APIs, endpoint agents, and on-premises warehouses. Each source can use a different schema, access-log format, and authentication method. Multi-cloud organizations can also maintain separate audit formats across AWS, Microsoft Azure, Google Cloud, and SaaS applications. Complex deployments may require 6 to 12 months of normalization work before behavioral baselines can be used. Legacy infrastructure without native APIs adds further work in Southeast Asia, Sub-Saharan Africa, and South America. Governance decisions for HR and ERP systems also require agreement among IT, legal, and data-protection teams, which can slow mid-market adoption.
Other drivers and restraints analyzed in the detailed report include:
- Breach-Disclosure and Data-Protection Mandates Create Compliance-Driven Procurement
- Security-Operations Tool Consolidation Redirects Budget Toward Integrated Platforms
- Specialist Skills and Continuous Tuning Requirements Constrain Operational Scalability
For complete list of drivers and restraints, kindly check the Table Of Contents.
Segment Analysis
Platforms accounted for 64.89% of the data detection and response market share in 2025. Buyers have favored integrated architectures that correlate access events across endpoints, cloud services, and SaaS applications via a single management console. The scale of the platform segment reflects a continuing move away from disconnected detection tools. CrowdStrike introduced Falcon Data Security in March 2026 as a unified offering for data discovery, classification, and theft prevention. This type of integration has become a central purchase consideration for large security teams.
The services segment is projected to grow at a 27.11% CAGR through 2031. Organizations are seeking managed data detection and response (DDR), advisory, implementation, and analyst-support services to reduce their internal workload. The need is pronounced when teams lack specialized data security skills. Pure-play vendors are adding analyst-assisted response within subscription packages to shorten deployment time and improve retention. Platform providers and service firms are also increasingly combining their offerings. This will make the boundary between platform revenue and service revenue less distinct over the forecast period.
Data activity monitoring held 31.83% of the data detection and response market revenue in 2025. Organizations need a clear record of who accessed data, when the access occurred, and where it originated before they can apply more advanced controls. Data discovery and classification establish a sensitivity context for the rest of the workflow. Data behavior analytics helps identify actions that depart from expected use patterns. Data loss and exfiltration prevention applies controls when activity creates a material risk.
Incident detection, response, and automated remediation are projected to grow at a 29.43% CAGR through 2031 in the data detection and response market. Security teams increasingly recognize that monitoring without containment can still leave a long period of exposure. Varonis introduced Agent Intent-Based Access Control in August 2026 to evaluate AI-agent intent and block policy-violating actions in real time. The capability includes inline redaction and human approval options for some actions. As vendors combine all 5 functions, the data detection and response market can see fewer boundaries between subcategories. This can support further M&A activity among specialized vendors through 2031.
Complete Report Scope:
- By Component
- Platforms
- Services
- By Security Function
- Data Discovery and Classification
- Data Activity Monitoring
- Data Behavior Analytics
- Data Loss and Exfiltration Prevention
- Incident Detection, Response and Automated Remediation
- By Deployment Mode
- Cloud
- On-Premises
- Hybrid
- By Organization Size
- Large Enterprises
- Small and Medium-Sized Enterprises
- By Industry Vertical
- Government and Public Administration
- Industrial Manufacturing
- Retail and E-Commerce
- Transportation and Logistics
- Energy and Utilities
- Oil and Gas
- IT and Telecommunication
- Media and Entertainment
- Education and Research Institutions
- Healthcare and Life Sciences
- Banking, Financial Services, and Insurance (BFSI)
- Other Industry Verticals
- By Geography
- North America
- United States
- Canada
- Mexico
- South America
- Brazil
- Argentina
- Rest of South America
- Europe
- Germany
- United Kingdom
- France
- Italy
- BENELUX
- Rest of Europe
- Asia-Pacific
- China
- Japan
- India
- South Korea
- Australia
- Rest of Asia-Pacific
- Middle East and Africa
- Middle East
- United Arab Emirates
- Saudi Arabia
- Rest of Middle East
- Africa
- South Africa
- Nigeria
- Egypt
- Rest of Africa
- Middle East
- North America
Geography Analysis
North America held 41.39% of the data detection and response market share in 2025. Data-intensive enterprises, an established cyber-insurance environment, and overlapping federal and state privacy rules support regional demand. The United States remains the largest national market, shaped by HIPAA, the NYDFS Cybersecurity Regulation Part 500, and state privacy laws. Canada and Mexico add demand in financial services and government as cloud migration creates data-visibility gaps. South America is emerging, led by Brazil, where the LGPD requires data protection and breach notification. Argentina and other South American countries remain early-stage markets, although cross-border finance and digital investment are increasing the need for monitoring.
Europe is the second-largest region in the data detection and response market. Germany, the United Kingdom, and France lead adoption, particularly among financial institutions and critical infrastructure operators. Germany's NIS2 implementation law expanded the number of companies within scope to 29,000 in December 2025. BENELUX is emerging as a growth area because many European multinational headquarters must maintain centralized, auditable access records. ENISA stated in June 2025 that automated and continuous monitoring should be used where feasible. This guidance aligns procurement criteria across regulated European sectors with core DDR functions.
Asia-Pacific is projected to grow at a 19.57% CAGR through 2031. Cloud adoption in China, India, Japan, South Korea, and Australia is occurring alongside more detailed national data-protection requirements. India, China, and Singapore have established frameworks that raise attention to data accountability. Japan's Financial Services Agency and Bank of Japan issued 2026 guidance on frontier AI threats and data security in AI-integrated financial systems. The Middle East and Africa remains at an earlier adoption stage, with the United Arab Emirates and Saudi Arabia acting as key growth centers. Nigeria, South Africa, and Egypt are expanding digital financial services, which will build monitored enterprise data estates over time.
- IBM Corporation
- Forcepoint LLC
- Microsoft Corporation
- Palo Alto Networks, Inc.
- CrowdStrike Holdings, Inc.
- Varonis Systems, Inc.
- Cyberhaven, Inc.
- Broadcom Inc.
- Proofpoint, Inc.
- Trellix
- Fortra, LLC
- Fortinet, Inc.
- SentinelOne, Inc.
- Cisco Systems, Inc.
- Darktrace plc
- Exabeam, Inc.
- Rapid7, Inc.
- Arctic Wolf Networks, Inc.
- Secureworks Corp.
- Huntress Labs Incorporated
- BigID, Inc.
- Cyera, Inc.
- Securiti, Inc.
- Netskope, Inc.
- Nightfall AI, Inc.
- Kitecyber, Inc.
- Strac, Inc.
Additional Benefits:
- The market estimate (ME) sheet in Excel format
- 3 months of analyst support
TABLE OF CONTENTS
1 INTRODUCTION
- 1.1 Study Assumptions and Market Definition
- 1.2 Scope of the Study
2 RESEARCH METHODOLOGY
3 EXECUTIVE SUMMARY
4 MARKET LANDSCAPE
- 4.1 Market Overview
- 4.2 Market Drivers
- 4.2.1 Real-Time Sensitive-Data Monitoring Demand Drives Platform Evolution
- 4.2.2 Cloud and SaaS Data Sprawl Outpaces Conventional DLP Controls
- 4.2.3 Breach-Disclosure and Data-Protection Mandates Create Compliance-Driven Procurement
- 4.2.4 Security-Operations Tool Consolidation Redirects Budget Toward Integrated Platforms
- 4.2.5 Data-Lineage Coverage for AI Agents and Shadow Analytics
- 4.2.6 Cyber-Insurance Evidence Requirements for Data Exfiltration
- 4.3 Market Restraints
- 4.3.1 Integration Complexity Across Heterogeneous Data Sources Extends Deployment Timelines
- 4.3.2 Specialist Skills and Continuous Tuning Requirements
- 4.3.3 Privacy and Employee-Monitoring Governance
- 4.3.4 Incomplete Telemetry from Legacy and Unsanctioned Environments
- 4.4 Value-Chain Analysis
- 4.5 Impact of Macroeconomic Factors
- 4.6 Regulatory Landscape
- 4.7 Technological Outlook
- 4.8 Porter's Five Forces Analysis
- 4.8.1 Threat-Detection Platform Substitution
- 4.8.2 Buyer Bargaining Power
- 4.8.3 Supplier Bargaining Power
- 4.8.4 New Entrant Threat
- 4.8.5 Competitive Rivalry
5 MARKET SIZE AND GROWTH FORECASTS (VALUE)
- 5.1 By Component
- 5.1.1 Platforms
- 5.1.2 Services
- 5.2 By Security Function
- 5.2.1 Data Discovery and Classification
- 5.2.2 Data Activity Monitoring
- 5.2.3 Data Behavior Analytics
- 5.2.4 Data Loss and Exfiltration Prevention
- 5.2.5 Incident Detection, Response and Automated Remediation
- 5.3 By Deployment Mode
- 5.3.1 Cloud
- 5.3.2 On-Premises
- 5.3.3 Hybrid
- 5.4 By Organization Size
- 5.4.1 Large Enterprises
- 5.4.2 Small and Medium-Sized Enterprises
- 5.5 By Industry Vertical
- 5.5.1 Government and Public Administration
- 5.5.2 Industrial Manufacturing
- 5.5.3 Retail and E-Commerce
- 5.5.4 Transportation and Logistics
- 5.5.5 Energy and Utilities
- 5.5.6 Oil and Gas
- 5.5.7 IT and Telecommunication
- 5.5.8 Media and Entertainment
- 5.5.9 Education and Research Institutions
- 5.5.10 Healthcare and Life Sciences
- 5.5.11 Banking, Financial Services, and Insurance (BFSI)
- 5.5.12 Other Industry Verticals
- 5.6 By Geography
- 5.6.1 North America
- 5.6.1.1 United States
- 5.6.1.2 Canada
- 5.6.1.3 Mexico
- 5.6.2 South America
- 5.6.2.1 Brazil
- 5.6.2.2 Argentina
- 5.6.2.3 Rest of South America
- 5.6.3 Europe
- 5.6.3.1 Germany
- 5.6.3.2 United Kingdom
- 5.6.3.3 France
- 5.6.3.4 Italy
- 5.6.3.5 BENELUX
- 5.6.3.6 Rest of Europe
- 5.6.4 Asia-Pacific
- 5.6.4.1 China
- 5.6.4.2 Japan
- 5.6.4.3 India
- 5.6.4.4 South Korea
- 5.6.4.5 Australia
- 5.6.4.6 Rest of Asia-Pacific
- 5.6.5 Middle East and Africa
- 5.6.5.1 Middle East
- 5.6.5.1.1 United Arab Emirates
- 5.6.5.1.2 Saudi Arabia
- 5.6.5.1.3 Rest of Middle East
- 5.6.5.2 Africa
- 5.6.5.2.1 South Africa
- 5.6.5.2.2 Nigeria
- 5.6.5.2.3 Egypt
- 5.6.5.2.4 Rest of Africa
- 5.6.5.1 Middle East
- 5.6.1 North America
6 COMPETITIVE LANDSCAPE
- 6.1 Market Concentration
- 6.2 Strategic Moves
- 6.3 Market Share Analysis
- 6.4 Company Profiles (includes Global Level Overview, Market Level Overview, Core Segments, Financials as available, Strategic Information, Market Rank/Share, Products and Services, Recent Developments)
- 6.4.1 IBM Corporation
- 6.4.2 Forcepoint LLC
- 6.4.3 Microsoft Corporation
- 6.4.4 Palo Alto Networks, Inc.
- 6.4.5 CrowdStrike Holdings, Inc.
- 6.4.6 Varonis Systems, Inc.
- 6.4.7 Cyberhaven, Inc.
- 6.4.8 Broadcom Inc.
- 6.4.9 Proofpoint, Inc.
- 6.4.10 Trellix
- 6.4.11 Fortra, LLC
- 6.4.12 Fortinet, Inc.
- 6.4.13 SentinelOne, Inc.
- 6.4.14 Cisco Systems, Inc.
- 6.4.15 Darktrace plc
- 6.4.16 Exabeam, Inc.
- 6.4.17 Rapid7, Inc.
- 6.4.18 Arctic Wolf Networks, Inc.
- 6.4.19 Secureworks Corp.
- 6.4.20 Huntress Labs Incorporated
- 6.4.21 BigID, Inc.
- 6.4.22 Cyera, Inc.
- 6.4.23 Securiti, Inc.
- 6.4.24 Netskope, Inc.
- 6.4.25 Nightfall AI, Inc.
- 6.4.26 Kitecyber, Inc.
- 6.4.27 Strac, Inc.
7 MARKET OPPORTUNITIES AND FUTURE OUTLOOK
- 7.1 White-Space and Unmet-Need Assessment

 2026年全球操作技術(OT)、安全資訊與事件管理(SIEM)內容包市場報告
 2026-2030年全球網路偵測與回應市場
 全球網路偵測與回應市場:依產品/服務、網路環境、組織規模、產業與地區分類-預測至2031年2026年全球網路偵測與回應市場報告
 網路偵測與回應市場規模、佔有率和成長分析:按組件組合、組織規模、最終用戶產業、銷售管道和地區分類-2026-2033年產業預測2026年全球訂閱掃描市場報告
 網路偵測與回應 (NDR) 市場規模、佔有率和趨勢分析報告:按組件、網路環境、部署、企業規模、最終用途、地區和細分市場分類(預測,2026-2033 年)
 網路檢測與回應 (NDR) 市場分析及預測(至 2035 年):按類型、產品類型、服務、技術、組件、應用、部署類型、最終用戶和解決方案分類
 按組件、部署模式、組織規模、服務類型和最終用戶行業分類的託管增強型檢測與響應市場,全球預測,2026-2032 年
 網路偵測與回應 (NDR) 軟體:全球市場佔有率與排名、總收入與需求預測 (2025-2031)