

 |
市場調查報告書
商品編碼
2154877
房地產行銷服務:市場佔有率分析、產業趨勢與統計、成長預測(2026-2031)Real Estate Marketing Services - Market Share Analysis, Industry Trends & Statistics, Growth Forecasts (2026 - 2031) |
||||||

※ 本網頁內容可能與最新版本有所差異。詳細情況請與我們聯繫。
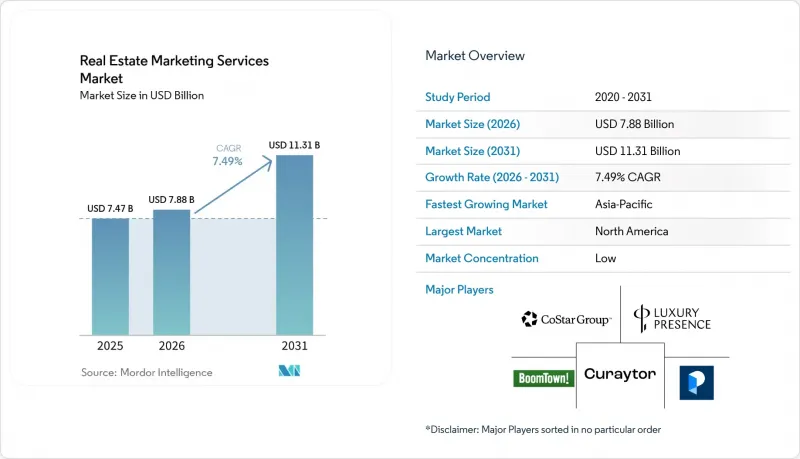
根據 Mordor Intelligence 預測,房地產行銷服務市場規模將從 2025 年的 74.7 億美元和 2026 年的 78.8 億美元成長到 2031 年的 113.1 億美元,2026 年至 2031 年的年複合成長率(CAGR)為 7.49%。
全球房地產行銷服務市場的趨勢與洞察
數位化優先的住宅搜尋和線上房地產經紀人查找
房地產行銷服務市場正受益於住宅和賣屋者幾乎無一例外在聯繫房地產經紀人之前都會進行線上搜尋的趨勢。根據美國房地產經紀人協會(NAR)預測,到2025年,線上管道將超越人脈推薦,成為消費者尋找經紀人的主要途徑。這項轉變意味著,持續的數位化曝光正成為房地產專業人士的必要營運成本,而非在市場低迷時可以暫停的促銷活動。在經濟衰退期間降低曝光度可能會削弱經紀人在客戶活躍度活性化時的影響力,因為潛在買家會繼續在線比較經紀人的個人資料、房產資訊和本地專業知識。據美國銀行稱,考慮住宅的人擴大使用人工智慧工具進行住宅研究,尤其是在年輕購屋者中,包括Z世代和千禧世代。如今,房地產發現過程涵蓋了從傳統搜尋和房地產入口網站到人工智慧產生的回應等多種方法,這擴大了房地產行銷服務市場所需的規劃、內容創作和最佳化工作的範圍。
利用社群媒體和客戶關係管理系統獲取高品質潛在客戶
在房地產行銷服務市場中,社群媒體和客戶關係管理 (CRM) 系統已成為潛在客戶開發的核心,它們將早期客戶觸達與結構化的後續跟進相結合。根據美國房地產經紀人協會 (NAR) 的一項調查,房地產仲介業者將社群媒體列為首選的潛在客戶開發技術,其次是 CRM 平台。雖然社交平臺能夠以較低的單一線索成本帶來大量諮詢,但與來自入口網站或推薦的線索相比,這些線索通常需要更長時間、更精心策劃的後續追蹤。這些需求催生了對 CRM 設定、受眾細分、訊息排序和客戶旅程圖的需求,以便持續吸引潛在買家,直至他們準備完成交易。 CallRail 的一份報告顯示,許多受訪的美國房地產公司計劃利用人工智慧進行案源計分和歸因分析。在房地產行銷服務市場中,能夠幫助客戶提高線索品質和後續跟進流程的供應商,其服務範圍不僅限於部署和管理單一宣傳活動。
交易量波動和房源短缺
由於行銷支出與房產供應和交易趨勢直接相關,因此對服務的需求往往受到住宅市場週期和市場上活躍房源數量的顯著影響。儘管美國二手住宅銷售年比略有改善,但庫存和供應仍然緊張。美國房地產經紀人協會 (NAR) 將近期的銷售水平描述為“歷史低點”,最新數據仍低於疫情前的水平。美國銀行的一項調查發現,儘管住宅仍然高企,但許多潛在購屋者仍在等待房價和利率的改善。房源數量的下降可能導致持續宣傳活動減少、經紀人預算受限,以及效果行銷團隊測試、改善和最佳化宣傳活動活動的時間縮短。對於那些在交易活躍期更頻繁地依賴入口網站併購買廣告和潛在客戶資訊的經紀人來說,這種壓力尤其巨大,並可能拖累整個房地產行銷服務市場的支出。
細分市場分析
到2025年,效果行銷和線索生成服務將佔房地產行銷服務市場的35.12%。這一領先地位反映了收費廣告、付費社交廣告和入口網站廣告對於尋求可衡量、短期銷售業績的房地產仲介業者和開發人員的重要性。品牌推廣和創新服務提供了穩定的收入來源,因為專業人士需要在不斷變化的房源資訊和宣傳活動中保持高度可識別的品牌形象。數位資產和物業管理服務也透過攝影、影片製作、房產資訊更新和內容傳送等方式創造了持續的需求。活動和體驗式行銷服務則帶來了一筆雖小但穩定的支出,尤其是在高階住宅項目和開發人員預售活動中。
預計到2031年,行銷策略、研究和分析服務將以8.55%的複合年成長率成長,成為房地產行銷服務市場中成長最快的細分領域。這一細分領域反映了行銷策略的轉變,即從最佳化詢盤數量轉向設計以線索品質和轉換率為中心的宣傳活動。各公司正在建立多點觸控歸因模型,以追蹤從首次接觸到最終成交的整個過程。 2026年6月, 銷售團隊推出了自主行銷代理,例如Hunter(可根據行為訊號識別線索)和Marketing Goals Agent(可根據既定目標建立和最佳化宣傳活動)。全方位服務機構可以利用這些工具制定針對特定房產的策略、選擇管道、進行績效評估和分析宣傳活動結果。
區域分析
截至2025年,北美將佔據38.34%的市佔率。該地區受益於美國和加拿大完善的數位廣告基礎設施,以及成熟的入口網站和客戶關係管理(CRM)生態系統。由於經紀人與房源數量比例較高,付費媒體、房產資訊分發、CRM管理和內容創作等領域的買賣雙方注意力爭奪戰依然激烈。尤其值得關注的是美國市場,因為交易環境的變化會直接影響仲介業者和代理人的行銷預算。
預計到2031年,亞太地區將以8.38%的複合年成長率成長。印度「行動優先」的購屋群體以及東南亞都市區的快速都市化,正在推動對效果宣傳活動和開發人員發布服務的需求。開發人員正從傳統的展示室參觀轉向可衡量的數位管道,例如搜尋、社交媒體和程序化廣告,以推廣其住宅項目。房地產行銷服務市場為宣傳活動團隊提供了根據各國購屋者多樣化偏好調整通訊、線索處理和通路分配的機會。
在歐洲,德國、英國和法國的數位成熟度各不相同,其中英國在付費廣告、自然流量和轉換率的衡量方面更為先進。中東市場更加製度化,隨著對廣告活動的監管力道加大,對專業服務的需求也日益成長。阿拉伯聯合大公國仍是該地區房地產行銷數位化程度最高的國家,國際買家宣傳活動充分利用了搜尋、社群媒體和WhatsApp後續追蹤等手段。南美洲的數位化應用尚處於起步階段,但巴西由於都市化和不斷發展的數位廣告基礎設施,擁有最大的市場潛力。以南非、埃及和奈及利亞為首的非洲市場正在從傳統的戶外媒體轉向以數位優先的房地產推廣方式。
其他好處:
- Excel格式的市場預測(ME)表
- 3個月的分析師支持
目錄
第1章:引言
- 研究假設和市場定義
- 調查範圍
第2章:調查方法
第3章執行摘要
第4章 市場狀況
- 市場概覽
- 市場促進因素
- 數位化優先的住宅搜尋和線上房地產經紀人查找
- 賣家和買家對富媒體報道的期望。
- 利用社群媒體和客戶關係管理系統獲取高品質潛在客戶
- 開發商和仲介業者對效果行銷的採用現狀
- 人工智慧搜尋最佳化和答案引擎發現
- 在掛牌前取得賣家資源,加快掛牌流程。
- 市場限制因素
- 交易量波動及上市股票數量少
- 每個入口網站和付費媒體的獲客成本都在上升。
- 人工智慧視覺化顯示,需求集中在極少數代理商手中。
- 人工智慧驅動的上市資訊媒體中與資訊揭露和真實性相關的風險。
- 產業價值鏈分析
- 宏觀經濟因素對市場的影響
- 監理情勢
- 技術展望
- 波特五力分析
第5章 市場規模與成長預測
- 按服務類型
- 效果行銷與潛在客戶開發服務
- 品牌和創新服務
- 數位資產和上市管理服務
- 活動和體驗式行銷服務
- 行銷策略、研究和分析服務
- 最終用戶
- 證券公司和機構
- 住宅開發商
- 商業地產公司
- 房地產管理公司
- 房地產投資信託基金與機構投資者
- 按地區
- 北美洲
- 美國
- 加拿大
- 墨西哥
- 南美洲
- 巴西
- 阿根廷
- 智利
- 哥倫比亞
- 秘魯
- 其他南美國家
- 歐洲
- 英國
- 德國
- 法國
- 義大利
- 西班牙
- 俄羅斯
- 荷蘭
- 波蘭
- 其他歐洲國家
- 亞太地區
- 印度
- 日本
- 澳洲
- 韓國
- 印尼
- 菲律賓
- 泰國
- 其他亞太國家
- 中東
- 土耳其
- 以色列
- 沙烏地阿拉伯
- 阿拉伯聯合大公國
- 其他中東國家
- 非洲
- 南非
- 奈及利亞
- 肯亞
- 埃及
- 其他非洲國家
- 北美洲
第6章 競爭情勢
- 市場集中度
- 策略趨勢
- 市佔率分析
- 公司簡介
- Luxury Presence, Inc.
- BoomTown ROI LLC
- Placester, Inc.
- Curaytor, Inc.
- Real Geeks, LLC
- Agent Image, Inc.
- Chime Technologies, Inc.
- Sierra Interactive, LLC
- MoxiWorks, LLC
- SharpLaunch, Inc.
- Zillow Group, Inc.
- CoStar Group, Inc.
- Move, Inc.
- REA Group Ltd
- Rightmove plc
第7章 市場機會與未來展望
According to Mordor Intelligence, the real estate marketing services market size is projected to expand from USD 7.47 billion in 2025 and USD 7.88 billion in 2026 to USD 11.31 billion by 2031, registering a CAGR of 7.49% between 2026 and 2031.
Global Real Estate Marketing Services Market Trends and Insights
Digital-First Home Search and Online Agent Discovery
The Real estate marketing services market benefits from the nearly universal use of online research by homebuyers and sellers before they enter into a conversation with an agent. The National Association of REALTORS reported that online channels became the primary way consumers found an agent in 2025, ahead of personal referrals. This change makes persistent digital visibility a necessary operating expense for property professionals, rather than a promotional activity that can be paused when conditions become difficult. Reducing visibility during a slow period can leave agents less visible when customer activity improves, because buyers will still compare profiles, listings, and local expertise online. Bank of America reported that prospective buyers increasingly used AI tools for homebuying research, with adoption especially notable among younger buyer groups, including Gen Z respondents and Millennials. The broader discovery process now includes conventional search, property portals, and AI-generated responses, which increases the range of planning, content, and optimization work required from the Real estate marketing services market.
Social Media and CRM-Led Quality Lead Generation
Social media and CRM systems have become central to lead generation in the Real estate marketing services market, as they combine initial customer reach with structured follow-up. The National Association of REALTORS found that REALTORS identified social media as their top lead-generating technology, followed by CRM platforms. Social platforms can generate high inquiry volumes at a lower cost per lead, but these leads often require longer and more carefully organized follow-up than portal or referral contacts. That requirement creates demand for CRM configuration, audience segmentation, message sequencing, and customer journeys that keep potential buyers engaged before they are ready to transact. CallRail reported that surveyed U.S. real estate businesses planned to use AI for lead scoring and attribution measurement. Providers in the Real estate marketing services market that help clients improve lead quality and follow-up processes can serve needs that extend beyond the placement and management of individual campaigns.
Transaction-Volume Volatility and Thin Listing Inventories
Marketing spending is directly linked to listing supply and transaction activity, making service demand sensitive to housing cycles and the number of properties actively marketed. Existing-home sales in the United States improved slightly from the prior year, while inventory and supply remained constrained. The National Association of REALTORS described the recent sales level as historically low, and the latest reading remained below pre-pandemic norms. Bank of America found that many prospective buyers were waiting for prices and rates to improve, while home prices remained elevated. Lower listing availability can reduce active campaigns, limit agent budgets, and shorten the period available for performance marketing teams to test, refine, and optimize campaign activity. This pressure is particularly strong for portal-dependent agents that buy advertising or leads more frequently when transaction activity is higher, which can constrain spending across the Real estate marketing services market.
Other drivers and restraints analyzed in the detailed report include:
- Performance Marketing Adoption by Developers and Brokerages
- Rich-Media Listing Expectations From Sellers and Buyers
- Rising Customer-Acquisition Costs Across Portals and Paid Media
For complete list of drivers and restraints, kindly check the Table Of Contents.
Segment Analysis
Performance Marketing and Lead Acquisition Services accounted for 35.12% of the Real estate marketing services market size in 2025. Its leading position reflected the importance of pay-per-click, paid social, and portal advertising for agents and developers seeking measurable near-term pipeline results. Branding and Creative Services supplied a steady revenue base because professionals need to maintain recognizable identities across changing listings and campaigns. Digital Asset and Listing Management Services also generated recurring demand through photography, video, listing updates, and content distribution. Events and Experiential Marketing Services represented a smaller but durable part of spending, particularly for luxury residential programs and developer pre-sales activity.
Marketing Strategy, Research and Analytics Services is projected to expand at an 8.55% CAGR through 2031, making it the fastest service type in the Real estate marketing services market. The segment reflects a move from optimizing inquiry volumes toward designing campaigns around lead quality and transaction outcomes. Firms are building multi-touch attribution models that follow activity from the first impression to the closing stage. Salesforce introduced autonomous marketing agents in June 2026, including Hunter for identifying leads from behavioral signals and a Marketing Goals Agent for building and optimizing campaigns around defined objectives. Full-service agencies can apply these tools to property-specific strategy, channel selection, performance review, and the interpretation of campaign results.
Complete Report Scope:
- By Service Type
- Performance Marketing and Lead Acquisition Services
- Branding and Creative Services
- Digital Asset and Listing Management Services
- Events and Experiential Marketing Services
- Marketing Strategy, Research and Analytics Services
- By End-User
- Brokerages and Agencies
- Residential Developers
- Commercial Real Estate Firms
- Property Management Companies
- REITs and Institutional Investors
- By Geography
- North America
- United States
- Canada
- Mexico
- South America
- Brazil
- Argentina
- Chile
- Colombia
- Peru
- Rest of South America
- Europe
- United Kingdom
- Germany
- France
- Italy
- Spain
- Russia
- Netherlands
- Poland
- Rest of Europe
- Asia-Pacific
- India
- Japan
- Australia
- South Korea
- Indonesia
- Philippines
- Thailand
- Rest of Asia-Pacific
- Middle East
- Turkey
- Israel
- Saudi Arabia
- United Arab Emirates
- Rest of Middle East
- Africa
- South Africa
- Nigeria
- Kenya
- Egypt
- Rest of Africa
- North America
Geography Analysis
North America accounted for 38.34% share in 2025. The region benefits from a developed digital advertising infrastructure and mature portal and CRM ecosystems in the United States and Canada. High agent-to-listing ratios sustain competition for buyer and seller attention across paid media, listing distribution, CRM management, and content production. The United States is particularly important because changes in transactions can quickly affect brokerage and agent marketing budgets.
Asia-Pacific is projected to expand at an 8.38% CAGR through 2031. Mobile-first buyer groups in India and rapid urbanization in Southeast Asian cities support demand for performance campaigns and developer launch services. Developers are shifting from showroom walk-ins to measurable digital channels, including search, social media, and programmatic advertising, for promoting residential projects. The Real estate marketing services market offers opportunities for campaign teams to adapt messaging, lead handling, and channel allocation to differing national buyer preferences.
Europe has different digital maturity profiles across Germany, the United Kingdom, and France, while the United Kingdom is more advanced in measuring paid, organic, and conversion activity. Middle Eastern markets are becoming more formalized, creating demand for professional services as advertising activity receives greater oversight. The UAE remains the region's most digitally developed property marketing environment, with international buyer campaigns using search, social media, and WhatsApp follow-up. South America is at an earlier stage of adoption, with Brazil offering the largest addressable opportunity because of urbanization and digital advertising infrastructure. African markets led by South Africa, Egypt, and Nigeria are moving from traditional outdoor media toward digital-first property promotion.
- Luxury Presence, Inc.
- BoomTown ROI LLC
- Placester, Inc.
- Curaytor, Inc.
- Real Geeks, LLC
- Agent Image, Inc.
- Chime Technologies, Inc.
- Sierra Interactive, LLC
- MoxiWorks, LLC
- SharpLaunch, Inc.
- Zillow Group, Inc.
- CoStar Group, Inc.
- Move, Inc.
- REA Group Ltd
- Rightmove plc
Additional Benefits:
- The market estimate (ME) sheet in Excel format
- 3 months of analyst support
TABLE OF CONTENTS
1 INTRODUCTION
- 1.1 Study Assumptions and Market Definition
- 1.2 Scope of the Study
2 RESEARCH METHODOLOGY
3 EXECUTIVE SUMMARY
4 MARKET LANDSCAPE
- 4.1 Market Overview
- 4.2 Market Drivers
- 4.2.1 Digital-First Home Search and Online Agent Discovery
- 4.2.2 Rich-Media Listing Expectations from Sellers and Buyers
- 4.2.3 Social Media and CRM-Led Quality Lead Generation
- 4.2.4 Performance Marketing Adoption by Developers and Brokerages
- 4.2.5 AI Search Optimization and Answer-Engine Discovery
- 4.2.6 Pre-Listing Seller Acquisition and Phased Listing Promotion
- 4.3 Market Restraints
- 4.3.1 Transaction-Volume Volatility and Thin Listing Inventories
- 4.3.2 Rising Customer-Acquisition Costs Across Portals and Paid Media
- 4.3.3 AI Visibility Concentrating Demand Around a Small Share of Agents
- 4.3.4 Disclosure and Authenticity Risks in AI-Enhanced Listing Media
- 4.4 Industry Value Chain Analysis
- 4.5 Impact of Macroeconomic Factors on the Market
- 4.6 Regulatory Landscape
- 4.7 Technological Outlook
- 4.8 Porter's Five Forces Analysis
- 4.8.1 Threat of New Entrants
- 4.8.2 Bargaining Power of Buyers
- 4.8.3 Bargaining Power of Suppliers
- 4.8.4 Threat of Substitutes
- 4.8.5 Intensity of Rivalry
5 MARKET SIZE AND GROWTH FORECASTS (VALUE)
- 5.1 By Service Type
- 5.1.1 Performance Marketing and Lead Acquisition Services
- 5.1.2 Branding and Creative Services
- 5.1.3 Digital Asset and Listing Management Services
- 5.1.4 Events and Experiential Marketing Services
- 5.1.5 Marketing Strategy, Research and Analytics Services
- 5.2 By End-User
- 5.2.1 Brokerages and Agencies
- 5.2.2 Residential Developers
- 5.2.3 Commercial Real Estate Firms
- 5.2.4 Property Management Companies
- 5.2.5 REITs and Institutional Investors
- 5.3 By Geography
- 5.3.1 North America
- 5.3.1.1 United States
- 5.3.1.2 Canada
- 5.3.1.3 Mexico
- 5.3.2 South America
- 5.3.2.1 Brazil
- 5.3.2.2 Argentina
- 5.3.2.3 Chile
- 5.3.2.4 Colombia
- 5.3.2.5 Peru
- 5.3.2.6 Rest of South America
- 5.3.3 Europe
- 5.3.3.1 United Kingdom
- 5.3.3.2 Germany
- 5.3.3.3 France
- 5.3.3.4 Italy
- 5.3.3.5 Spain
- 5.3.3.6 Russia
- 5.3.3.7 Netherlands
- 5.3.3.8 Poland
- 5.3.3.9 Rest of Europe
- 5.3.4 Asia-Pacific
- 5.3.4.1 India
- 5.3.4.2 Japan
- 5.3.4.3 Australia
- 5.3.4.4 South Korea
- 5.3.4.5 Indonesia
- 5.3.4.6 Philippines
- 5.3.4.7 Thailand
- 5.3.4.8 Rest of Asia-Pacific
- 5.3.5 Middle East
- 5.3.5.1 Turkey
- 5.3.5.2 Israel
- 5.3.5.3 Saudi Arabia
- 5.3.5.4 United Arab Emirates
- 5.3.5.5 Rest of Middle East
- 5.3.6 Africa
- 5.3.6.1 South Africa
- 5.3.6.2 Nigeria
- 5.3.6.3 Kenya
- 5.3.6.4 Egypt
- 5.3.6.5 Rest of Africa
- 5.3.1 North America
6 COMPETITIVE LANDSCAPE
- 6.1 Market Concentration
- 6.2 Strategic Moves
- 6.3 Market Share Analysis
- 6.4 Company Profiles (includes Global Level Overview, Market Level Overview, Core Segments, Financials as available, Strategic Information, Market Rank/Share, Products and Services, Recent Developments)
- 6.4.1 Luxury Presence, Inc.
- 6.4.2 BoomTown ROI LLC
- 6.4.3 Placester, Inc.
- 6.4.4 Curaytor, Inc.
- 6.4.5 Real Geeks, LLC
- 6.4.6 Agent Image, Inc.
- 6.4.7 Chime Technologies, Inc.
- 6.4.8 Sierra Interactive, LLC
- 6.4.9 MoxiWorks, LLC
- 6.4.10 SharpLaunch, Inc.
- 6.4.11 Zillow Group, Inc.
- 6.4.12 CoStar Group, Inc.
- 6.4.13 Move, Inc.
- 6.4.14 REA Group Ltd
- 6.4.15 Rightmove plc
7 MARKET OPPORTUNITIES AND FUTURE OUTLOOK
- 7.1 White-Space and Unmet-need Assessment

 銷售技術市場:全球市場預測,2026-2032年
 中小企業的行銷即服務 (MaaS) 市場:市場佔有率分析、產業趨勢與統計、成長預測 (2026-2031)行銷自動化市場-2026-2032年全球市場預測
 行銷自動化市場報告:按組件類型、部署模式、最終用戶、應用、產業和地區分類(2026-2034 年)
 2026年全球房地產行銷自動化軟體(REMAS)市場報告2026年全球線上遊戲平台市場報告2026年全球行銷自動化市場報告
 行銷自動化市場規模、佔有率和成長分析:按解決方案、部署類型、最終用途和地區分類-2026-2033年產業預測B2B體育博彩平台市場按產品、設備類型、整合模式和部署類型分類-2026-2032年全球預測B2C行銷自動化平台市場:按組件、應用、部署類型、組織規模和最終用戶產業分類,全球預測,2026-2032年