

 |
市場調查報告書
商品編碼
2154806
鈦礦:市場佔有率分析、產業趨勢與統計、成長預測(2026-2031)Titanium Ore - Market Share Analysis, Industry Trends & Statistics, Growth Forecasts (2026 - 2031) |
||||||

※ 本網頁內容可能與最新版本有所差異。詳細情況請與我們聯繫。
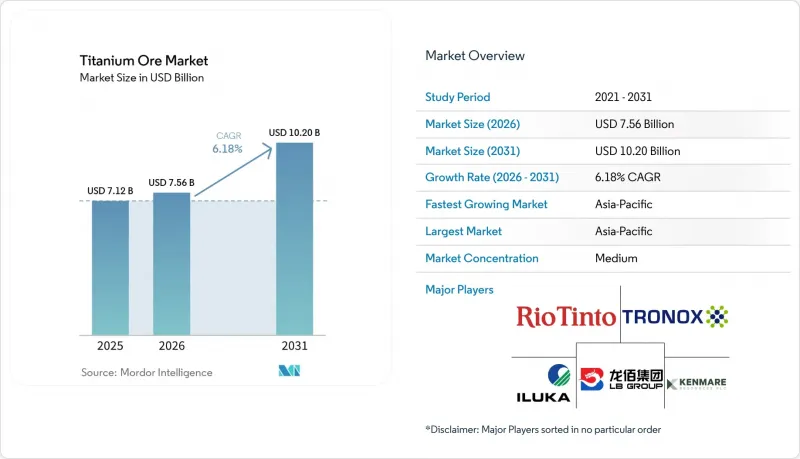
據 Mordor Intelligence 稱,2025 年鈦礦市場價值為 71.2 億美元,預計到 2031 年將達到 102 億美元,而 2026 年為 75.6 億美元,預測期(2026-2031 年)的複合年成長率為 6.18%。
全球鈦礦市場趨勢與洞察
用於顏料的二氧化鈦支撐著主要的市場需求。
2025年,美國進口的鈦礦精礦中超過95%被國內二氧化鈦顏料生產商消耗。顏料生產是鈦礦市場的主要驅動力,顏料買家在年度礦山出貨量中繼續扮演核心角色。 2025年全球二氧化鈦顏料需求量為700萬噸,其中中國產量下降6.98%至417.8萬噸,而由於都市化和基礎建設,印度和東南亞的消費量持續成長。由於油漆和塗料是二氧化鈦的主要用途,建設活動將繼續影響礦產原料的採購。 2025年12月,印度取消了對中國二氧化鈦的反傾銷措施,擴大了供應來源,但也給國內鈦鐵礦加工商帶來了壓力,並有利於莫三比克和澳洲的低成本礦工。這項需求基礎的永續性取決於中國硫酸法生產能力能否最佳化,還是會在利潤為負的情況下繼續維持。
航太和國防領域對高等級原料的需求正在改變礦石的品質組成。
航太和國防領域的採購活動正在推動對高等級原料的需求,而這種需求獨立於正常的顏料週期之外。波音和空中巴士合計訂單達16,000架,波音737 MAX生產線正穩定推進,月產量可望達到47架。這些生產需求將在未來五年內支撐對鈦合金和認證海綿鈦的需求。氯化法生產海綿鈦需要二氧化鈦含量超過85%的原料,但普通鈦鐵礦未經提煉無法穩定供應。預計2025年1月至8月,日本海綿鈦出口量將創歷史新高,達2023年全年最高水準的70%,而鈦礦進口量則創歷史新低。這一趨勢有利於金紅石、合成金紅石以及能夠維持嚴格品管的生產商。
環境許可和礦場修復義務正在減緩產能擴張的速度。
環境許可直接限制了鈦礦市場新增礦砂產能。在美國,環境影響評估 (EIS) 程序平均耗時 4.5 年,訴訟還會進一步延誤。美國針對鈦礦子類別的排放法規涵蓋脈礦開採和礦床疏浚,增加了生產前期的資本投入。 Kenmare Resources plc 表示,截至 2026 年 8 月,其在莫三比克的實施協議續約問題仍未解決,即便採礦權已於 2024 年 12 月到期,提案的稅收改革也加劇了不不確定性。馬達加斯加、南非和印度也面臨類似的授權和稅收壓力。這些義務延緩了待開發區投資,並限制了供應滿足高等級原料需求的能力。
細分市場分析
2025年,鈦鐵礦佔鈦礦石市場的80.23%。這一地位反映了其豐富的地質儲量(全球蘊藏量超過49萬噸)以及其在硫酸法生產二氧化鈦的成熟應用。加工商將鈦鐵礦分為「升級級」和「硫酸級」兩種。升級級鈦鐵礦可轉化為合成金紅石或礦渣,而硫酸級鈦鐵礦則可直接使用。這種區分導致高品質鈦鐵礦的價格更高。在天然金紅石難以取得的地區,含鈦量為60%至90%的白鈦礦是一種較為有限的原料。
預計到2031年,金紅石的複合年成長率將達到7.05%,成為鈦礦市場中成長最快的類型。 2025年,天然金紅石產量為45萬噸,而全球氯化法製備二氧化鈦的產能超過每年400萬噸。塞拉利昂的產量從2025年的8萬噸增加到11萬噸,部分抵銷了肯亞和烏克蘭的產量下降。澳洲擁有3.5萬噸金紅石蘊藏量,年產量為20萬噸,但這表明,即使資源豐富,也無法保證供應量會即時增加。這種供應限制支撐了合成金紅石的獲利能力,也是金紅石在鈦礦市場長期表現優異的因素。
區域分析
到2025年,亞太地區將佔全球鈦礦市場佔有率的45.18%,預計到2031年將以6.78%的複合年成長率成長。中國2025年將生產320萬噸鈦鐵礦,預計二氧化鈦顏料的年產能為600萬噸。 2025年前九個月,中國進口了380萬噸鈦礦精礦,比去年同期成長5%。其中,莫三比克供應了47%,澳洲供應了17%,挪威供應了7%。國內產量、顏料產能和進口量的綜合作用,使該地區在鈦礦需求和價格趨勢中佔據中心地位。
印度擁有世界第三大蘊藏量,達9,200萬噸,但礦石產量僅排名第五。該國75%的二氧化鈦需求依賴進口,這為國內礦石加工和開採留出了空間。日本2025年的鈦礦石進口量創歷史新低,而其海綿鈦出口量在同年1月至8月期間增加。北美和歐洲仍然是顏料生產和航太原料的主要需求中心。美國2025年生產了100萬噸二氧化鈦顏料,但其鈦礦精礦的淨進口依存度高達86%。
美國預計2025年將進口價值7.2億美元的精礦,高於2024年的6.58億美元。 《關鍵原物料法案》將鈦指定為戰略原料,支持歐洲供應來源多角化。預計南非2025年將生產130萬噸鈦鐵礦。馬達加斯加的瓦拉馬達計畫已探明並估計蘊藏量為9.04億噸重礦物,品位為6.1%,年產鈦鐵礦95.9萬噸,包括硫酸鹽、礦渣和氯化物品位。
其他好處:
- Excel格式的市場預測(ME)表
- 3個月的分析師支持
目錄
第1章:引言
- 研究假設和市場定義
- 調查範圍
第2章:調查方法
第3章執行摘要
第4章 市場狀況
- 市場概覽
- 市場促進因素
- 顏料用二氧化鈦的需求
- 航太和國防領域對高品質原料的需求
- 利用氯化法擴大顏料生產能力
- 先進的礦石分離與原料品質提升
- 以合成金紅石取代天然金紅石,確保高品質原料的穩定供應。
- 市場限制因素
- 環境許可和礦山修復義務
- 原物料價格和需求的週期性
- 高等級礦床枯竭
- 價值鏈分析
- 波特五力分析
第5章 市場規模與成長預測
- 按類型
- 鈦鐵礦
- 金紅石
- 白碳烯
- 其他鈦礦
- 透過使用
- 二氧化鈦顏料
- 鈦金屬
- 塗層和襯裡
- 焊條
- 其他用途
- 按最終用戶行業分類
- 航太/國防
- 衛生保健
- 車
- 化學品
- 建造
- 其他行業
- 按地區
- 亞太地區
- 中國
- 印度
- 日本
- 韓國
- 東南亞國協
- 其他亞太國家
- 北美洲
- 美國
- 加拿大
- 墨西哥
- 歐洲
- 德國
- 英國
- 法國
- 義大利
- 北歐國家
- 其他歐洲國家
- 南美洲
- 巴西
- 阿根廷
- 其他南美國家
- 中東和非洲
- 沙烏地阿拉伯
- 南非
- 其他中東和非洲國家
- 亞太地區
第6章 競爭情勢
- 市場集中度
- 策略趨勢
- 市佔率和排名分析
- 公司簡介
- Base Resources
- China Vanadium Titano-Magnetite Mining Company Limited
- ILUKA RESOURCES LIMITED
- IREL(India)Limited
- Kenmare Resources plc
- Kronos Worldwide, Inc.
- LB Group
- Pangang Group Vanadium Titanium & Resources Co., Ltd.
- Rio Tinto
- Sierra Rutile
- The Chemours Company
- The Kerala Minerals & Metals Limited
- The Kerala Minerals and Metals Limited
- TiZir Limited
- Tronox Holdings Plc
- UMCC-TITANIUM
第7章 市場機會與未來展望
According to Mordor Intelligence, the titanium ore market size was valued at USD 7.12 billion in 2025 and is estimated to grow from USD 7.56 billion in 2026 to reach USD 10.20 billion by 2031, at a CAGR of 6.18% during the forecast period (2026-2031).
Global Titanium Ore Market Trends and Insights
Pigment-Grade Titanium Dioxide Sustains Core Market Demand
More than 95% of U.S. titanium mineral concentrate imports were consumed by domestic titanium dioxide pigment producers in 2025. Pigment output is the primary driver for the titanium ore market, keeping pigment buyers central to annual mine offtake. Global titanium dioxide pigment demand stood at 7 million tons in 2025, while Chinese output fell 6.98% to 4.178 million tons, and consumption in India and Southeast Asia continued to grow due to urbanization and infrastructure activity. Paints and coatings are the leading outlet for titanium dioxide, so construction activity continues to influence mine feedstock purchases. India's December 2025 cancellation of anti-dumping measures on Chinese titanium dioxide widened access to supply but pressured domestic ilmenite processors, favoring low-cost miners in Mozambique and Australia. The durability of this demand base depends on whether China's sulfate-process capacity rationalizes or continues despite negative margins.
Aerospace and Defense Demand for High-Grade Feedstocks Reshapes Ore Quality Mix
Aerospace and defense procurement drives demand for high-grade feedstock outside normal pigment cycles. Boeing and Airbus collectively held a backlog of 16,000 aircraft, and the Boeing 737 MAX line was progressing toward 47 units per month. These production requirements support demand for titanium alloy and qualified sponge over the next five years. Chloride-process sponge requires feedstocks with more than 85% titanium dioxide, which ordinary ilmenite cannot consistently supply without upgrading. Japan's sponge titanium exports reached their fastest pace in January through August 2025, equaling 70% of the 2023 annual record, while its titanium ore imports reached a record low. This pattern favors rutile, synthetic rutile, and producers able to maintain strict quality control.
Environmental Permitting and Mine-Rehabilitation Obligations Delay Capacity
Environmental permitting directly constrains new mineral sands capacity in the titanium ore market. Environmental Impact Statement processes in the United States average 4.5 years, and litigation can add further delays. U.S. discharge rules for the titanium ore subcategory cover lode-deposit mining and dredge mining of placer sands, thereby increasing pre-production capital requirements. Kenmare Resources plc stated that its Implementation Agreement renewal in Mozambique remained unresolved as of August 2026, following the concessions' December 2024 expiration, while proposed fiscal changes created further uncertainty. Similar permitting and fiscal pressures exist in Madagascar, South Africa, and India. These obligations delay greenfield investment and limit supply response to high-grade feedstock demand.
Other drivers and restraints analyzed in the detailed report include:
- Expansion of Chloride-Route Pigment Capacity Tightens Feedstock Demand
- Advanced Beneficiation and Feedstock Upgrading Extend Resource Life
- Feedstock Price Volatility and Demand Cyclicality Constrain Investment Returns
For complete list of drivers and restraints, kindly check the Table Of Contents.
Segment Analysis
Ilmenite held 80.23% of the titanium ore market in 2025. Its position reflects geological abundance, global reserves above 490,000 metric tons, and established use in sulfate-route titanium dioxide production. Processors distinguish upgrade-grade ilmenite, which can be converted to synthetic rutile or slag, from sulfate-grade material used directly. This distinction supports a price premium for higher-quality ilmenite. Leucoxene contains 60% to 90% titanium dioxide and provides a narrower feedstock route where natural rutile is less available.
Rutile is forecast to grow at a 7.05% CAGR through 2031, making it the fastest-growing type in the titanium ore market. Natural rutile output was 450,000 metric tons in 2025, while global chloride-process titanium dioxide capacity exceeded 4 million metric tons per year. Sierra Leone increased output from 80,000 to 110,000 metric tons in 2025, partly offsetting losses in Kenya and Ukraine. Australia held 35,000 metric tons of rutile reserves and produced 200,000 metric tons annually, underscoring that a large resource base does not guarantee immediate supply growth. This supply constraint supports synthetic rutile margins and the longer-term outperformance of rutile in the titanium ore market.
Complete Report Scope:
- By Type
- Ilmenite
- Rutile
- Leucoxene
- Other Titanium Ores
- By Application
- Titanium Dioxide Pigments
- Titanium Metal
- Coating and Lining
- Welding Electrodes
- Other Applications
- By End-User Industry
- Aerospace and Defense
- Healthcare
- Automotive
- Chemical
- Construction
- Other Industries
- By Geography
- Asia-Pacific
- China
- India
- Japan
- South Korea
- ASEAN Countries
- Rest of Asia-Pacific
- North America
- United States
- Canada
- Mexico
- Europe
- Germany
- United Kingdom
- France
- Italy
- NORDIC Countries
- Rest of Europe
- South America
- Brazil
- Argentina
- Rest of South America
- Middle East and Africa
- Saudi Arabia
- South Africa
- Rest of Middle East and Africa
- Asia-Pacific
Geography Analysis
Asia-Pacific held 45.18% of the titanium ore market in 2025 and is forecast to grow at a 6.78% CAGR through 2031. China produced 3.2 million metric tons of ilmenite in 2025 and had an estimated annual titanium dioxide pigment capacity of 6 million metric tons. It imported 3.8 million gross tons of titanium mineral concentrates in the first nine months of 2025, up 5% year over year. Mozambique supplied 47% of those imports, Australia supplied 17%, and Norway supplied 7%. This combination of domestic output, pigment capacity, and imports positions the region as central to ore demand and price direction.
India held the world's third-largest ilmenite and rutile reserves at 92 million tons, but ranked fifth in ore output. It imported 75% of its titanium dioxide requirements, leaving room for domestic beneficiation and mining. Japan's titanium ore imports reached a record low in 2025, while sponge titanium exports rose from January through August 2025. North America and Europe remain major demand centers for pigment production and aerospace feedstock. The United States produced 1 million tons of titanium dioxide pigment in 2025 and was 86% net import-dependent for titanium mineral concentrates.
The United States imported USD 720 million of concentrates in 2025, compared with USD 658 million in 2024. The Critical Raw Materials Act identifies titanium as a strategic raw material and supports European supply diversification. South Africa produced 1.3 million metric tons of ilmenite in 2025. Madagascar's Vara Mada project had 904 million tons of proven and probable reserves at a 6.1% heavy mineral grade, with annual ilmenite production of 959,000 tons across sulfate, slag, and chloride grades.
- Base Resources
- China Vanadium Titano-Magnetite Mining Company Limited
- ILUKA RESOURCES LIMITED
- IREL (India) Limited
- Kenmare Resources plc
- Kronos Worldwide, Inc.
- LB Group
- Pangang Group Vanadium Titanium & Resources Co., Ltd.
- Rio Tinto
- Sierra Rutile
- The Chemours Company
- The Kerala Minerals & Metals Limited
- The Kerala Minerals and Metals Limited
- TiZir Limited
- Tronox Holdings Plc
- UMCC-TITANIUM
Additional Benefits:
- The market estimate (ME) sheet in Excel format
- 3 months of analyst support
TABLE OF CONTENTS
1 Introduction
- 1.1 Study Assumptions and Market Definition
- 1.2 Scope of the Study
2 Research Methodology
3 Executive Summary
4 Market Landscape
- 4.1 Market Overview
- 4.2 Market Drivers
- 4.2.1 Pigment-Grade Titanium Dioxide Demand
- 4.2.2 Aerospace and Defense Demand for High-Grade Feedstocks
- 4.2.3 Expansion of Chloride-Route Pigment Capacity
- 4.2.4 Advanced Beneficiation and Feedstock Upgrading
- 4.2.5 Synthetic-Rutile Substitution for High-Grade Feedstock Security
- 4.3 Market Restraints
- 4.3.1 Environmental Permitting and Mine-Rehabilitation Obligations
- 4.3.2 Feedstock Price and Demand Cyclicality
- 4.3.3 Depletion of High-Grade Mineral Sands Deposits
- 4.4 Value Chain Analysis
- 4.5 Porter's Five Forces Analysis
- 4.5.1 Bargaining Power of Suppliers
- 4.5.2 Bargaining Power of Buyers
- 4.5.3 Threat of New Entrants
- 4.5.4 Threat of Substitutes
- 4.5.5 Competitive Rivalry
5 Market Size and Growth Forecasts (Value)
- 5.1 By Type
- 5.1.1 Ilmenite
- 5.1.2 Rutile
- 5.1.3 Leucoxene
- 5.1.4 Other Titanium Ores
- 5.2 By Application
- 5.2.1 Titanium Dioxide Pigments
- 5.2.2 Titanium Metal
- 5.2.3 Coating and Lining
- 5.2.4 Welding Electrodes
- 5.2.5 Other Applications
- 5.3 By End-User Industry
- 5.3.1 Aerospace and Defense
- 5.3.2 Healthcare
- 5.3.3 Automotive
- 5.3.4 Chemical
- 5.3.5 Construction
- 5.3.6 Other Industries
- 5.4 By Geography
- 5.4.1 Asia-Pacific
- 5.4.1.1 China
- 5.4.1.2 India
- 5.4.1.3 Japan
- 5.4.1.4 South Korea
- 5.4.1.5 ASEAN Countries
- 5.4.1.6 Rest of Asia-Pacific
- 5.4.2 North America
- 5.4.2.1 United States
- 5.4.2.2 Canada
- 5.4.2.3 Mexico
- 5.4.3 Europe
- 5.4.3.1 Germany
- 5.4.3.2 United Kingdom
- 5.4.3.3 France
- 5.4.3.4 Italy
- 5.4.3.5 NORDIC Countries
- 5.4.3.6 Rest of Europe
- 5.4.4 South America
- 5.4.4.1 Brazil
- 5.4.4.2 Argentina
- 5.4.4.3 Rest of South America
- 5.4.5 Middle East and Africa
- 5.4.5.1 Saudi Arabia
- 5.4.5.2 South Africa
- 5.4.5.3 Rest of Middle East and Africa
- 5.4.1 Asia-Pacific
6 Competitive Landscape
- 6.1 Market Concentration
- 6.2 Strategic Moves
- 6.3 Market Share (%)/Ranking Analysis
- 6.4 Company Profiles (includes Global Overview, Market Overview, Core Segments, Financials as available, Strategic Information, Products and Services, and Recent Developments)
- 6.4.1 Base Resources
- 6.4.2 China Vanadium Titano-Magnetite Mining Company Limited
- 6.4.3 ILUKA RESOURCES LIMITED
- 6.4.4 IREL (India) Limited
- 6.4.5 Kenmare Resources plc
- 6.4.6 Kronos Worldwide, Inc.
- 6.4.7 LB Group
- 6.4.8 Pangang Group Vanadium Titanium & Resources Co., Ltd.
- 6.4.9 Rio Tinto
- 6.4.10 Sierra Rutile
- 6.4.11 The Chemours Company
- 6.4.12 The Kerala Minerals & Metals Limited
- 6.4.13 The Kerala Minerals and Metals Limited
- 6.4.14 TiZir Limited
- 6.4.15 Tronox Holdings Plc
- 6.4.16 UMCC-TITANIUM
7 Market Opportunities and Future Outlook
- 7.1 White-Space and Unmet-Need Assessment

 四異丙基鈦酸鹽市場:全球市場預測,2026-2032年鈦鐵市場:全球市場預測,2026-2032年
 MMO塗層鈦電極市場報告:趨勢、預測和競爭分析(至2035年)燒結多孔鈦盤市場:全球市場預測,2026-2032年鈦市場-2026-2032年全球市場預測
 全球鈦金屬市場規模、佔有率、趨勢和成長分析報告(2026-2034年)
 二氧化鈦紙市場規模、佔有率和成長分析:按應用、終端用戶產業、產品類型、銷售管道和地區分類-2026-2033年產業預測
 鈦屑市場規模、佔有率和成長分析:按等級類型、加工類型、產品形態、應用、終端用戶產業、地區和產業預測分類,2026-2033年
 2026-2030年全球鈦市場鈦酸鹽全球市場規模、佔有率、趨勢和成長分析報告(2026-2034)