


 |
市場調查報告書
商品編碼
2154764
電源轉換系統:市場佔有率分析、產業趨勢與統計、成長預測(2026-2031)Power Conversion System - Market Share Analysis, Industry Trends & Statistics, Growth Forecasts (2026 - 2031) |
||||||

※ 本網頁內容可能與最新版本有所差異。詳細情況請與我們聯繫。
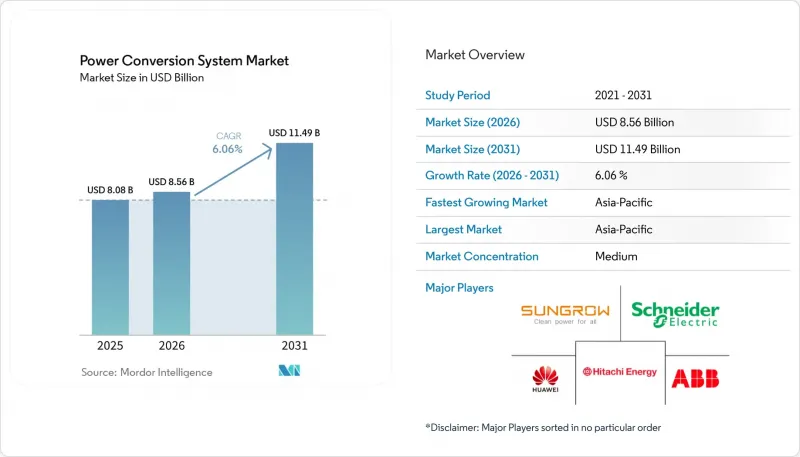
根據 Mordor Intelligence 預測,電力轉換系統市場規模預計將在 2025 年達到 80.8 億美元,2026 年達到 85.6 億美元,到 2031 年達到 114.9 億美元,2026 年至 2031 年的複合年成長率為 6.06%。
全球電源轉換系統市場趨勢及洞察
公用事業規模的太陽能發電設施建設正在迅速增加。
公用事業規模的太陽能發電仍是電力轉換系統市場新增需求的主要來源。美國太陽能產業協會 (SEIA) 預測,2026 年至 2031 年間,美國將新增 211 吉瓦直流 (GWdc) 的公用事業規模太陽能發電裝置容量,而儘管面臨電價壓力,2026 年第一季仍新增了 5.9 吉瓦直流裝置容量。所有太陽能發電工程都需要直流-交流 (DC-AC) 轉換,而配套的儲能系統則在同一安裝地點增加了交流-直流 (AC-DC) 和直流-直流 (DC-DC) 轉換設備。隨著「太陽能發電+儲能」模式的日益普及,這將增加單位電網容量所需的轉換器數量。預計向 2 千伏直流 (kV DC) 太陽能發電系統的過渡將需要新的逆變器平台,並可能產生更換現有設備的需求。包括 IEEE 1547-2018 和 IEC 61727 在內的併網標準,有利於那些能夠在大型發電工程中展現穩定性能的供應商。
分散式資料中心功率密度激增
人工智慧資料中心的興起推動了電源轉換系統市場對電源轉換設備性能的更高要求。根據發表在《Energies》雜誌上的研究,人工智慧訓練和推理機架的電力消耗量可能接近1兆瓦,而傳統機架的功耗約為10千瓦。採用800伏特直流配電技術,在相同導體尺寸下可提高85%的電力傳輸能力,進而在大規模設施中減少45%的銅需求。德克薩斯和英偉達於2026年3月發布了800伏直流架構,該架構採用氮化鎵直流-直流總線轉換器,峰值效率超過97.6%,功率密度超過2000瓦/立方英寸。此類設計有利於能夠以高開關頻率製造高效率直流-直流轉換器的供應商。預計到2025年,資料中心電力需求將成長17%,這為服務超大規模和託管資料中心的電源設備供應商奠定了堅實的市場基礎。
加強變壓器和電纜的供應鏈管理
由於轉換器必須整合到更廣泛的電力系統中,變壓器和電纜供不應求可能會延誤電力轉換系統市場的專案進度。據國際能源總署 (IEA) 稱,自 2021 年以來,電纜採購前置作業時間已延長至 2-3 年,而大型電力變壓器的實際價格自 2019 年以來已上漲 75%。這些限制同時影響可再生能源專案、資料中心、電動車充電網路和電網升級專案。因此,專案開發人員可能會調整轉換器訂單以匹配變壓器的供應情況,而不是優先採購轉換器。更嚴格的電網法規和電力電子領域工程師的短缺正在增加成本並延長專案設計週期。能夠處理各種變壓器電壓的模組化設備可以幫助供應商減輕這些延誤的影響。
細分市場分析
到2025年,AC-DC轉換器將佔總銷售額的48.3%,成為電力轉換系統市場中最大的轉換器類別。這一地位反映了市場對將電網提供的交流電轉換為直流電,以滿足電池和直流負載需求的持續成長。在公用事業規模的儲能專案和可再生能源專案中,AC-DC設備用於利用電網和可再生能源發電為電池充電。 DC-AC逆變器支援太陽能併網以及電池向電網放電。 AC-AC轉換器則應用於工業變頻器和部分離岸風力發電專案。
預計到2031年,直流-直流轉換器將以6.9%的複合年成長率成長,成為該細分市場中成長最快的產品。這一成長主要由800V直流資料中心設計和高功率電動車快速充電器中的多級轉換驅動。這兩種應用都需要在高開關頻率下實現高效轉換,並具有緊湊的物理尺寸。德克薩斯(TI)的800V至6V氮化鎵總線轉換器於2026年3月實現了97.6%的峰值效率,功率密度超過2000W/in³。這些不斷提高的性能要求使得採用碳化矽和氮化鎵的設計更有價值。
2025年,電池儲能系統(BESS)佔電力轉換系統市場規模的44.8%,預計2031年將以8.2%的複合年成長率成長。這使得BESS成為電力轉換系統市場中佔有率最大、成長最快的應用領域。儲能系統需要轉換器來控制充電、放電、電網支援和保護功能。為了實現併網、黑啟動和慣性模擬等功能,每兆瓦的裝置容量都需要更先進的控制能力。陽光電源的SC210HX電力轉換系統憑藉其優異的併網性能,於2026年7月獲得了德國VDE FNN原型認證。
隨著太陽能發電的普及和充電法規的完善,可再生能源系統和電動車充電基礎設施正成為下一個主要應用領域。雖然輸電設備的更新周期通常較長,但電力公司和發電廠仍扮演重要角色。儘管資料中心和電信業的貢獻目前較小,但隨著每個人工智慧機架的電力需求增加,每個設施所需的電力轉換設備數量也在增加。 2026年7月,陽光電源發布了針對人工智慧資料中心的「EnerNeo 3 MW」固態變壓器,可將10-13.8 kV交流電直接轉換為800 V直流電。因此,電力轉換系統市場對兼具中壓接收和專用直流配電功能的系統需求日益成長。
區域分析
預計到2025年,亞太地區將佔全球銷售額的58.1%,並在2031年之前維持6.5%的複合年成長率。這將使該地區繼續保持其銷售領先地位,並成為所有地區中成長率最高的地區。在中國,需求成長主要得益於大規模電力轉換設備的製造、大規模電池儲能的部署以及電網現代化。在印度,需求成長主要得益於可再生能源的部署和微電網的電氣化。在韓國、日本、越南和印度尼西亞,需求成長主要得益於製造業、電網擴建以及對分散式能源的需求。
北美和歐洲是電力轉換系統市場銷售額僅次於歐洲的第二大地區。在北美,美國聯邦通訊委員會 (FCC) 於 2026 年 7 月將外國製造的電源逆變器列入其“管制清單”,此舉將推動美國國內的生產計劃。如果所有已宣布的投資都能完成,預計到 2027 年底,美國太陽能逆變器和電力轉換系統的年產能將超過 100 吉瓦交流電 (GWac)。歐洲擁有大規模的電力轉換設備製造地,並對充電、產品永續性和外部電源供應有嚴格的監管規定。這些要求有利於那些從設計初期就符合法規和電網規則規範的設備。
在南美洲、中東和非洲,公用事業規模的可再生能源專案、儲能系統和電網現代化正在推動市場擴張。沙烏地阿拉伯也迎來了一系列大規模訂單,例如,2026年2月,Sineng公司簽署契約,為PIF 6項目供應3吉瓦的太陽能逆變器。在撒哈拉以南非洲,模組化太陽能發電和儲能微電網可以為難以擴展中央電網的偏遠地區提供電氣化支援。
其他好處:
- Excel格式的市場預測(ME)表
- 3個月的分析師支持
目錄
第1章:引言
- 研究假設和市場定義
- 調查範圍
第2章:調查方法
第3章執行摘要
第4章 市場狀況
- 市場概覽
- 市場促進因素
- 大型太陽能發電設施的建設正在迅速增加。
- 分散式資料中心功率密度的快速成長
- 寬能隙半導體成本轉折點
- 全球微電網和小型電網的發展
- 強制安裝電動車快速充電基礎設施
- 關於生態設計和循環經濟的法規
- 市場限制因素
- 加強變壓器和電纜的供應鏈管理
- 轉換器韌體中的網路安全風險
- 遵守資本密集型電網規範
- 電力電子領域技術純熟勞工短缺
- 供應鏈分析
- 波特五力分析
- 科技趨勢
- 監理情勢
- 投資分析
第5章 市場規模與成長預測
- 按轉換器類型
- 交流-直流轉換器
- 直流-直流轉換器
- 直流-交流(逆變器)
- 交流-交流轉換器
- 透過使用
- 電池能源儲存系統(BESS)
- 可再生能源系統
- 電動車和充電基礎設施
- 電力公司和發電廠
- 資料中心和通訊
- 其他用途
- 按組件
- 功率半導體
- 控制器和積體電路
- 電容器和電感器
- 變壓器
- 其他
- 最終用戶
- 公用事業
- 產業
- 商業
- 住宅
- 按地區
- 北美洲
- 美國
- 加拿大
- 墨西哥
- 歐洲
- 德國
- 法國
- 義大利
- 西班牙
- 英國
- 波蘭
- 俄羅斯
- 其他歐洲國家
- 亞太地區
- 中國
- 印度
- 日本
- 韓國
- 澳洲
- 印尼
- 越南
- 泰國
- 其他亞太國家
- 南美洲
- 巴西
- 阿根廷
- 智利
- 其他南美國家
- 中東和非洲
- 沙烏地阿拉伯
- 阿拉伯聯合大公國
- 埃及
- 南非
- 摩洛哥
- 其他中東和非洲國家
- 北美洲
第6章 競爭情勢
- 市場集中度
- 策略趨勢
- 市佔率分析
- 公司簡介
- ABB Ltd.
- AcBel Polytech Inc.
- Delta Electronics, Inc.
- Eaton Corporation plc
- GE Vernova, Inc.
- Hitachi Energy Ltd.
- Huawei Technologies Co., Ltd.
- LS Energy Solutions LLC
- Power Electronics SA
- Schneider Electric SE
- Siemens Energy AG
- SMA Solar Technology AG
- Sungrow Power Supply Co., Ltd.
- XP Power Ltd.
第7章 市場機會與未來展望
According to Mordor Intelligence, the power conversion system market size is projected to be USD 8.08 billion in 2025, USD 8.56 billion in 2026, and reach USD 11.49 billion by 2031, growing at a CAGR of 6.06% from 2026 to 2031.
Global Power Conversion System Market Trends and Insights
Surging Utility-Scale Solar PV Build-out
Utility-scale solar remains a major source of new demand in the power conversion system market. SEIA projected 211 GWdc of utility-scale solar additions in the United States between 2026 and 2031, while 5.9 GWdc was deployed in the first quarter of 2026 despite tariff pressure. Every solar project requires DC-AC conversion, and co-located storage adds AC-DC and DC-DC equipment to the same installation. This raises converter content per unit of grid capacity as solar-plus-storage becomes more common. The expected move toward 2 kV DC solar systems requires new inverter platforms and can also create replacement demand for existing equipment. Grid-interconnection standards, including IEEE 1547-2018 and IEC 61727, favor suppliers that can demonstrate consistent performance across utility projects.
Distributed Data-Center Power-Density Spike
AI-focused data centers are increasing the required performance of power conversion equipment in the power conversion system market. Research published in Energies reported that AI training and inference racks can approach 1 MW, compared with traditional racks near 10 kW. The move to 800 VDC distribution can carry 85% more power through the same conductor size and reduce copper needs by 45% in large facilities. Texas Instruments and NVIDIA introduced an 800 VDC architecture in March 2026 with a gallium-nitride DC-DC bus converter rated at 97.6% peak efficiency and more than 2,000 W/in3 power density. These designs favor suppliers that can produce efficient DC-DC converters at high switching frequencies. Data center electricity demand rose 17% in 2025, providing a firm demand base for power equipment suppliers serving hyperscale and colocation facilities.
Transformer & Cable Supply-Chain Tightness
Transformer and cable shortages can delay project schedules in the power conversion system market because converters must be integrated with the wider electrical system. The International Energy Agency reported that cable procurement lead times had increased to 2 to 3 years since 2021, while large power transformer prices rose 75% in real terms since 2019. These limits affect renewable projects, data centers, EV charging networks, and grid replacement work at the same time. Project developers may therefore align converter orders with transformer availability rather than purchase converters first. More demanding grid codes and limited power-electronics engineering labor add cost and extend project design cycles. Modular equipment that works across a broader set of transformer voltages can help suppliers reduce the impact of these delays.
Other drivers and restraints analyzed in the detailed report include:
- Wide-Bandgap Semiconductor Cost Inflection
- EV Fast-Charging Infrastructure Mandates
- Converter Firmware Cybersecurity Risks
For complete list of drivers and restraints, kindly check the Table Of Contents.
Segment Analysis
AC-DC converters held 48.3% of revenue in 2025, making them the largest converter category in the power conversion system market. Their position reflects the continuing need to convert grid-supplied alternating current for batteries and direct-current loads. Utility-scale storage and renewable projects use AC-DC equipment when charging batteries from the grid or from renewable generation. DC-AC inverters support solar export and battery discharge to the grid. AC-AC converters serve industrial variable-frequency drives and some offshore wind applications.
DC-DC converters are forecast to grow at a 6.9% CAGR through 2031, the fastest rate in this segmentation. The growth is tied to 800 VDC data center designs and multistage conversion in high-power EV fast chargers. Both applications require high-efficiency conversion at high switching frequencies and compact physical dimensions. Texas Instruments' 800 V-to-6 V gallium-nitride bus converter reached 97.6% peak efficiency at more than 2,000 W/in3 in March 2026. This performance requirement increases the value of silicon carbide and gallium nitride designs.
BESS accounted for 44.8% of the power conversion system market size in 2025 and is projected to expand at an 8.2% CAGR through 2031. This gives BESS the largest power conversion system market share and the fastest growth among applications. Storage systems require converters to control charging, discharging, grid support, and protection functions. Grid-forming, black-start, and inertia-emulation roles require more advanced control capability for each installed megawatt. Sungrow's SC210HX power conversion systems received Germany's VDE FNN Prototype Certificate in July 2026 for grid-forming performance.
Renewable energy systems and EV charging infrastructure are the next major application groups, supported by solar deployment and charging rules. Electric utilities and power plants remain important, although transmission equipment usually has longer replacement cycles. Data centers and telecommunications currently make a smaller contribution, but power needs per AI rack are increasing the amount of conversion equipment required at each facility. In July 2026, Sungrow introduced the EnerNeo 3 MW solid-state transformer for AI data centers, which directly converts 10-13.8 kV AC to 800 V DC. The power conversion system market is therefore gaining demand from systems that combine medium-voltage intake with dedicated DC distribution.
Complete Report Scope:
- By Converter Type
- AC-DC Converters
- DC-DC Converters
- DC-AC (Inverters)
- AC-AC Converters
- By Application
- Battery Energy Storage Systems (BESS)
- Renewable Energy Systems
- Electric Vehicles & Charging Infrastructure
- Electric Utilities & Power Plants
- Data Centers & Telecommunication
- Other Applications
- By Component
- Power Semiconductors
- Controllers & ICs
- Capacitors & Inductors
- Transformers
- Others
- By End-user
- Utilities
- Industrial
- Commercial
- Residential
- By Geography
- North America
- United States
- Canada
- Mexico
- Europe
- Germany
- France
- Italy
- Spain
- United Kingdom
- Poland
- Russia
- Rest of Europe
- Asia-Pacific
- China
- India
- Japan
- South Korea
- Australia
- Indonesia
- Vietnam
- Thailand
- Rest of Asia-Pacific
- South America
- Brazil
- Argentina
- Chile
- Rest of South America
- Middle East and Africa
- Saudi Arabia
- United Arab Emirates
- Egypt
- South Africa
- Morocco
- Rest of Middle East and Africa
- North America
Geography Analysis
Asia-Pacific held 58.1% of revenue in 2025 and is projected to grow at a 6.5% CAGR through 2031. This gives the region the leading regional revenue position and the fastest regional growth rate. China combines large-scale converter manufacturing with major battery storage deployment and grid modernization. India is building demand through renewable energy additions and microgrid electrification programs. South Korea, Japan, Vietnam, and Indonesia add demand through manufacturing, grid expansion, and distributed power needs.
North America and Europe make up the next major block of revenue in the power conversion system market. In North America, the Federal Communications Commission added foreign-made power inverters to its Covered List in July 2026, encouraging domestic manufacturing plans. Announced investments could lift U.S. annual PV inverter and PCS manufacturing capacity above 100 GWac by the end of 2027 if completed. Europe has a substantial converter manufacturing base and demanding rules for charging, product sustainability, and external power supplies. These requirements favor equipment that meets regulatory and grid-code specifications from the start of the design process.
South America and the Middle East and Africa are expanding through utility-scale renewable projects, storage systems, and grid modernization. Saudi Arabia is also creating large orders, including Sineng's February 2026 contract to supply 3 GW of PV inverters for the PIF 6 project. In Sub-Saharan Africa, modular solar-plus-storage microgrids can support remote electrification where extending the central grid is difficult.
- ABB Ltd.
- AcBel Polytech Inc.
- Delta Electronics, Inc.
- Eaton Corporation plc
- GE Vernova, Inc.
- Hitachi Energy Ltd.
- Huawei Technologies Co., Ltd.
- LS Energy Solutions LLC
- Power Electronics S.A.
- Schneider Electric SE
- Siemens Energy AG
- SMA Solar Technology AG
- Sungrow Power Supply Co., Ltd.
- XP Power Ltd.
Additional Benefits:
- The market estimate (ME) sheet in Excel format
- 3 months of analyst support
TABLE OF CONTENTS
1 INTRODUCTION
- 1.1 Study Assumptions and Market Definition
- 1.2 Scope of the Study
2 RESEARCH METHODOLOGY
3 EXECUTIVE SUMMARY
4 MARKET LANDSCAPE
- 4.1 Market Overview
- 4.2 Market Drivers
- 4.2.1 Surging Utility-scale Solar PV Build-out
- 4.2.2 Distributed Data-center Power-density Spike
- 4.2.3 Wide-bandgap Semiconductor Cost Inflection
- 4.2.4 Evolution Of Global Micro- And Mini-grids
- 4.2.5 EV Fast-charging Infrastructure Mandates
- 4.2.6 Eco-design & Circular-economy Regulations
- 4.3 Market Restraints
- 4.3.1 Transformer & Cable Supply-chain Tightness
- 4.3.2 Converter Firmware Cybersecurity Risks
- 4.3.3 Capital-intensive Grid-code Compliance
- 4.3.4 Skilled-labor Shortages in Power Electronics
- 4.4 Supply-Chain Analysis
- 4.5 Porter's Five Forces Analysis
- 4.5.1 Bargaining Power of Suppliers
- 4.5.2 Bargaining Power of Buyers
- 4.5.3 Threat of New Entrants
- 4.5.4 Threat of Substitutes
- 4.5.5 Competitive Rivalry
- 4.6 Technology Outlook
- 4.7 Regulatory Landscape
- 4.8 Investment Analysis
5 MARKET SIZE AND GROWTH FORECASTS
- 5.1 By Converter Type
- 5.1.1 AC-DC Converters
- 5.1.2 DC-DC Converters
- 5.1.3 DC-AC (Inverters)
- 5.1.4 AC-AC Converters
- 5.2 By Application
- 5.2.1 Battery Energy Storage Systems (BESS)
- 5.2.2 Renewable Energy Systems
- 5.2.3 Electric Vehicles & Charging Infrastructure
- 5.2.4 Electric Utilities & Power Plants
- 5.2.5 Data Centers & Telecommunication
- 5.2.6 Other Applications
- 5.3 By Component
- 5.3.1 Power Semiconductors
- 5.3.2 Controllers & ICs
- 5.3.3 Capacitors & Inductors
- 5.3.4 Transformers
- 5.3.5 Others
- 5.4 By End-user
- 5.4.1 Utilities
- 5.4.2 Industrial
- 5.4.3 Commercial
- 5.4.4 Residential
- 5.5 By Geography
- 5.5.1 North America
- 5.5.1.1 United States
- 5.5.1.2 Canada
- 5.5.1.3 Mexico
- 5.5.2 Europe
- 5.5.2.1 Germany
- 5.5.2.2 France
- 5.5.2.3 Italy
- 5.5.2.4 Spain
- 5.5.2.5 United Kingdom
- 5.5.2.6 Poland
- 5.5.2.7 Russia
- 5.5.2.8 Rest of Europe
- 5.5.3 Asia-Pacific
- 5.5.3.1 China
- 5.5.3.2 India
- 5.5.3.3 Japan
- 5.5.3.4 South Korea
- 5.5.3.5 Australia
- 5.5.3.6 Indonesia
- 5.5.3.7 Vietnam
- 5.5.3.8 Thailand
- 5.5.3.9 Rest of Asia-Pacific
- 5.5.4 South America
- 5.5.4.1 Brazil
- 5.5.4.2 Argentina
- 5.5.4.3 Chile
- 5.5.4.4 Rest of South America
- 5.5.5 Middle East and Africa
- 5.5.5.1 Saudi Arabia
- 5.5.5.2 United Arab Emirates
- 5.5.5.3 Egypt
- 5.5.5.4 South Africa
- 5.5.5.5 Morocco
- 5.5.5.6 Rest of Middle East and Africa
- 5.5.1 North America
6 COMPETITIVE LANDSCAPE
- 6.1 Market Concentration
- 6.2 Strategic Moves
- 6.3 Market Share Analysis
- 6.4 Company Profiles (includes Global Level Overview, Market Level Overview, Core Segments, Financials as available, Strategic Information, Products and Services, Recent Developments)
- 6.4.1 ABB Ltd.
- 6.4.2 AcBel Polytech Inc.
- 6.4.3 Delta Electronics, Inc.
- 6.4.4 Eaton Corporation plc
- 6.4.5 GE Vernova, Inc.
- 6.4.6 Hitachi Energy Ltd.
- 6.4.7 Huawei Technologies Co., Ltd.
- 6.4.8 LS Energy Solutions LLC
- 6.4.9 Power Electronics S.A.
- 6.4.10 Schneider Electric SE
- 6.4.11 Siemens Energy AG
- 6.4.12 SMA Solar Technology AG
- 6.4.13 Sungrow Power Supply Co., Ltd.
- 6.4.14 XP Power Ltd.
7 MARKET OPPORTUNITIES AND FUTURE OUTLOOK
- 7.1 White-Space and Unmet-Need Assessment

 轉換器冷卻系統市場:全球市場預測,2026-2032年
 2026年全球飛機電氣轉換系統市場報告
 飛機電氣轉換系統市場報告:趨勢、預測與競爭分析(至2035年)
 電源轉換系統市場預測至2034年—按類型、額定功率、技術、應用、最終用戶和地區分類的全球分析
 飛機電氣轉換系統市場-全球產業規模、佔有率、趨勢、機會、預測:按組件類型、飛機類型、地區和競爭對手分類,2021-2031年儲能用功率轉換系統市場:按轉換器類型、功率等級、連接類型、功率流、電池技術、應用和最終用戶分類 - 全球預測,2026-2032年電源轉換系統市場-全球產業規模、佔有率、趨勢、機會和預測(按類型、按應用、按最終用戶、按地區和競爭細分,2020-2030 年)儲能轉換器市場-全球產業規模、佔有率、趨勢、機會和預測,按應用、轉換器類型、儲能類型、地區和競爭進行細分,2020-2030 年預測
 全球飛機電氣改裝系統市場能源儲存轉換器市場報告:2031 年趨勢、預測與競爭分析