


 |
市場調查報告書
商品編碼
2154519
地下水處理化學品:市場佔有率分析、行業趨勢和統計數據、成長預測(2026-2031 年)Groundwater Treatment Chemicals - Market Share Analysis, Industry Trends & Statistics, Growth Forecasts (2026 - 2031) |
||||||

※ 本網頁內容可能與最新版本有所差異。詳細情況請與我們聯繫。
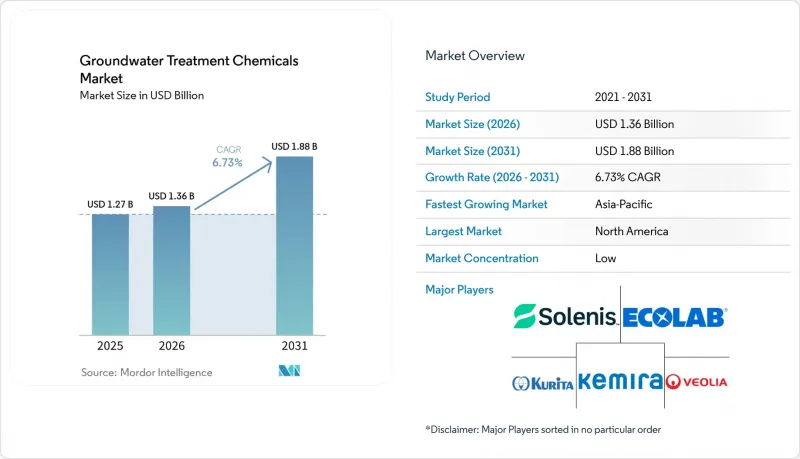
據 Mordor Intelligence 稱,2025 年地下水處理化學品市場價值為 12.7 億美元,預計到 2031 年將從 2026 年的 13.6 億美元成長至 18.8 億美元,預測期(2026-2031 年)複合年成長率為 6.73%。
全球地下水處理化學品市場趨勢及洞察
響應 PFAS 法規並擴大地下水監測
美國環保署 (EPA) 2024 年《國家飲用水標準》為美國供水事業制定了明確的採購計畫。服務人口超過 1 萬的公共供水系統必須在 2027 年 4 月前完成首次季度監測,並在 2029 年 4 月前完全達到最大污染物濃度限值 (MCL) 的要求。任何不符合標準的取水口可能需要使用顆粒活性碳 (GAC)、陰離子交換樹脂或逆滲透膜,並配合預處理化學品以維持處理介質的性能。截至 2025 年年中,威立雅在美國經營 34 套 PFAS 處理系統,並在德拉瓦新建了一座價值 3,500 萬美元的 GAC 處理廠。該廠日處理能力達 3,000 萬加侖,可為超過 10 萬人口提供水。該公司還承諾在未來幾年內將其處理能力擴展至全美 100 多個水生產點。新的 GAC 系統需要定期更換廢活性碳,這擴大了地下水處理化學品市場中吸附劑供應商的需求基礎。
棕地再開發和關閉場地的壓力
棕地污染會延誤產權轉移、增加環境保險成本,並在實質審查過程中引發責任問題。面臨「無需進一步修復」的場地關閉計劃的業主正在採用原位修復方法,以期在計劃的專案時間內實現污染物的可衡量減少。 2026年3月,REGENESIS和AECOM在美國陸軍國民警衛隊的一個設施中,利用IBIS在線混合和注入系統安裝了PlumeStop膠體活性碳地下PFAS屏障。該裝置旨在控制PFAS污染羽流,無需持續維護,也不會產生二次PFAS廢棄物。這種被動式系統避免了地表處理基礎設施和持續的能源成本,從而可以更可預測地進行修復預算。這正在將地下水處理化學品市場的部分需求從持續的大宗採購轉向有限的、專用化學品的注入。
地下異質性及對氧化劑的需求
由於污染羽流區域地質特徵各異,含水層非均質性仍是氧化劑性能的重要限制因素。水文電導率、有機質和礦物質含量都會影響所需的劑量和注入試劑的作用範圍。所需的氧化劑劑量可能比實驗室估計值高出3到10倍。 2024年的一項研究發現,即使在相同的化學負荷條件下,均質含水層和非均質含水層中全氟烷基和多氟烷基物質的質量通量降低程度也存在顯著差異。這些不確定性使得採購前需要進行詳細的採樣和監測,這可能會延長銷售週期。供應商如果將現場表徵和初步試驗納入其服務,可以減少採購過程中的摩擦,但這可能會增加地下水處理化學品市場的額外服務成本。
細分市場分析
2025年,凝聚劑和助凝劑佔地下水處理化學品市場規模的35.34%。這是因為這些試劑能夠去除用於市政供水和工業回用的地下水中的懸浮固體、濁度和顆粒污染物。 SNF集團是全球領先的水溶性聚合物製造商之一。根據凱米拉公司(Kemira Oyj)於2026年4月發布的投資人報告,該公司在水處理聚合物市場的佔有率預計將達到15%。這些公司憑藉其配方能力、穩定的供應和認證產品線與區域製造商競爭。由於零液體排放系統的引入,封閉回路型地下水循環利用過程中礦物質濃度不斷提高,預計到2031年,阻垢劑和腐蝕抑制劑市場將以7.34%的複合年成長率成長。
氧化劑和消毒劑佔據了市場的大部分佔有率,其中過硫酸鹽和過氧化氫溶液主要用於需要化學分解的場合。吸附劑和離子交換化學品正吸引越來越多的投資,其銷售量已超過目前的貢獻。 2026年6月,美國環保署 (EPA) 根據《綜合環境反應、賠償和責任法》(CERCLA) 的框架,對膠體活性碳 (CAC) 作為一種現場 PFAS 封存技術進行了評估。凱米拉公司 (Kemira Oyj) 於2024年透過收購一家英國公司進入活性碳重新運作業務領域,目前正在瑞典赫爾辛堡建設一座工廠,預計將於2027年下半年投產。 2026年2月,凱米拉也宣布對其位於西班牙塔拉戈納的工廠投資2,340萬美元。 pH調節劑和軟水劑有助於最佳化處理條件,而生物促效劑和電子供體在氯代溶劑污染場地的強化生物修復中應用日益廣泛。這些產品開發正在加強地下水處理化學品行業在監管合規性和場地修復方面的實力。
區域分析
北美地區在現有超級基金法的執行以及眾多遺留工業場地的支持下,預計到2025年將佔地下水處理化學品市場規模的33.67%。美國將繼續保持其作為主要次區域的地位,其需求主要受《綜合環境反應、賠償和責任法》(CERCLA)的同意裁決、美國陸軍工兵團(USACE)的清理合約以及全氟烷基和多氟烷基物質(PFAS)最大累積限值(MCL)要求的驅動。 2026年,Tetra Tech公司被選中在俄亥俄州代頓市設計一座專門的PFAS處理設施,預計建造成本為3.5億美元。在加拿大,採礦和油砂水資源管理將推動需求成長,而在歐洲,預計需求主要來自德國、法國和英國。這些地區棕地密度高,且地下水標準完善,因此正積極進行清理工作。
預計到2031年,亞太地區將以7.58%的複合年成長率成長。中國的需求成長主要受以下因素驅動:對氯化有機物和磷排放的更嚴格監管、鋰電池設施強制性「零液體排放」要求以及資料中心對冷卻水的需求。在印度,「飲用水生命線計畫」(Jal Jeevan Mission)和水質改善計畫正在推動公共部門採購凝聚劑、吸附劑和pH調節劑。栗田水務株式會社公佈,截至2026年3月的會計年度銷售額為2,089.7億日圓(約13.9億美元)。在日本和韓國,半導體和電子製造業的需求成長主要驅動地下水處理,因為這些產業需要精確的化學控制。
南美洲在其現有基礎上不斷發展,巴西和阿根廷是該地區的主要需求中心。巴西的紙漿和造紙、採礦和石化產業推動了地下水處理的需求,而更嚴格的環境法規也正式要求對受污染土壤進行修復。 2025年,索爾維和威立雅在巴西索爾維聖安德烈工廠完成了一項為期10年的工業用水再利用合作項目,實現了94%的水循環利用率,每年節約的淡水相當於133個奧運會標準游泳池的容量。中東和非洲的地下水處理化學品市場呈現兩極化的趨勢。一方面,海灣國家對阻垢劑和腐蝕抑制劑的需求旺盛;另一方面,南非採礦業對重金屬去除和尾礦處理的需求旺盛。由於這兩個地區的監管執法力度不足,北美和歐洲的迫切需求仍然有限。
其他好處:
- Excel格式的市場預測(ME)表
- 3個月的分析師支持
目錄
第1章:引言
- 研究假設和市場定義
- 調查範圍
第2章:調查方法
第3章執行摘要
第4章 市場狀況
- 市場概覽
- 市場促進因素
- 響應 PFAS 法規並擴大地下水監測
- 棕地再開發和關閉營運的壓力
- 工業污染及責任歸屬
- 現場處理優於鑽井或長期抽水處理。
- 針對混合污染物羽流的特定場地化學處理方法
- 採用被動吸附和反應屏障技術,最大限度地減少廢棄物。
- 市場限制因素
- 土壤的不均勻性以及對氧化劑的需求
- PFAS分解和濃縮物處置的成本
- 試劑安全性、操作和注射的複雜性
- 新興化學技術的監管接受程度有差異
- 價值鏈分析
- 波特五力分析
第5章 市場規模與成長預測
- 依化學類型
- 凝聚劑
- 氧化劑和消毒劑
- pH調節器/軟水器
- 水垢和腐蝕抑制劑
- 吸附劑和離子交換劑
- 其他類型的化學物質
- 透過使用
- 地下水淨化
- 飲用水處理
- 工業地下水處理
- 農業和灌溉水處理
- 其他用途(採礦、掩埋滲濾液和特殊用途)
- 按地區
- 亞太地區
- 中國
- 印度
- 日本
- 韓國
- 其他亞太國家
- 北美洲
- 美國
- 加拿大
- 墨西哥
- 歐洲
- 德國
- 英國
- 法國
- 義大利
- 其他歐洲國家
- 南美洲
- 巴西
- 阿根廷
- 其他南美國家
- 中東和非洲
- 沙烏地阿拉伯
- 南非
- 其他中東和非洲國家
- 亞太地區
第6章 競爭情勢
- 市場集中度
- 策略趨勢
- 市佔率和排名分析
- 公司簡介
- Carus Group Inc.
- DuPont
- Ecolab Inc.
- Evonik Industries AG
- Kemira Oyj
- Kurita Water Industries Ltd.
- Regenesis
- SNF Group
- Solenis
- Solvay
- Veolia
- Xylem
第7章 市場機會與未來展望
According to Mordor Intelligence, the groundwater treatment chemicals market size was valued at USD 1.27 billion in 2025 and is estimated to grow from USD 1.36 billion in 2026 to reach USD 1.88 billion by 2031, at a CAGR of 6.73% during the forecast period (2026-2031).
Global Groundwater Treatment Chemicals Market Trends and Insights
PFAS Compliance and Groundwater Monitoring Expansion
The EPA's 2024 National Primary Drinking Water Regulation established a defined procurement timetable for U.S. water utilities. Public water systems serving more than 10,000 people must complete initial quarterly monitoring by April 2027 and meet full MCL requirements by April 2029. Each noncompliant entry point may require granular activated carbon (GAC), anion-exchange resins, or reverse osmosis, together with pretreatment chemicals that protect treatment-media performance. Veolia operated 34 PFAS treatment systems in the United States in mid-2025 and opened a USD 35 million GAC facility in Delaware that can treat 30 million gallons per day for more than 100,000 residents. The company has also committed to expanding treatment coverage to more than 100 U.S. water production sites in future years. New GAC systems create recurring spent-carbon replacement needs, which broadens the demand base for adsorbent suppliers in the groundwater treatment chemicals market.
Brownfield Redevelopment and Site-Closure Pressure
Brownfield contamination can delay property transfers, increase environmental insurance costs, and create liability concerns during due diligence. Site owners facing no-further-remediation closure schedules are using in-situ approaches that can provide measurable contaminant reduction within planned project periods. In March 2026, REGENESIS and AECOM installed a PlumeStop colloidal activated carbon in-ground PFAS barrier at a U.S. Army National Guard facility using the IBIS inline blending and injection system. The installation was designed to contain the PFAS plume without ongoing maintenance obligations or a secondary PFAS waste stream. Passive systems can avoid surface treatment infrastructure and ongoing energy costs, which supports more predictable remediation budgets. This is shifting some demand in the groundwater treatment chemicals market from continuous bulk volumes toward limited specialty chemical injections.
Subsurface Heterogeneity and Oxidant Demand
Aquifer heterogeneity remains a persistent constraint on oxidant performance because geology varies across a contaminated plume. Hydraulic conductivity, organic matter, and mineral content can alter both dose requirements and the area reached by an injected reagent. Required oxidant doses can be 3 to 10 times higher than laboratory estimates. A 2024 study found that per- and polyfluoroalkyl substances mass-flux reduction differed significantly between homogeneous and heterogeneous aquifers under the same chemical loading. The uncertainty requires detailed sampling and monitoring before procurement, which can extend sales cycles. Suppliers that include site characterization and pilot testing can reduce purchasing friction but may absorb added service costs in the groundwater treatment chemicals market.
Other drivers and restraints analyzed in the detailed report include:
- Industrial Legacy Contamination and Liability Allocation
- In-Situ Treatment Preference Over Excavation and Long-Term Pump-and-Treat
- PFAS Destruction and Concentrate Disposal Cost
For complete list of drivers and restraints, kindly check the Table Of Contents.
Segment Analysis
Coagulants and flocculants commanded 35.34% of the groundwater treatment chemicals market size in 2025 because they remove suspended solids, turbidity, and particulate-bound contaminants from groundwater used for municipal supply and industrial reuse. SNF Group is one of the world's leading producers of water-soluble polymers. Kemira Oyj's April 2026 investor presentation placed its share of the polymers-for-water-treatment market at 15%. These companies compete with regional producers through formulation performance, supply security, and certified product lines. Scale and corrosion inhibitors are projected to advance at a 7.34% CAGR through 2031 as zero-liquid-discharge systems increase mineral concentration in closed-loop groundwater recycling operations.
Oxidants and disinfectants accounted for a substantial portion, with persulfate and hydrogen peroxide systems used where chemical destruction is required. Adsorbents and ion-exchange chemicals are attracting investment that is larger than their current revenue contribution. In June 2026, the EPA evaluated colloidal activated carbon (CAC) as an in-situ PFAS sequestration technology under the CERCLA framework. Kemira Oyj entered activated-carbon reactivation through a United Kingdom acquisition in 2024 and is building a plant in Helsingborg, Sweden, that is expected to begin operating in the second half of 2027. Kemira Oyj also announced a USD 23.4 million investment for a Tarragona, Spain, facility in February 2026. Potential of hydrogen (pH) adjusters and softeners support treatment conditions, while biostimulants and electron donors are gaining use in enhanced bioremediation at chlorinated-solvent sites. These product developments strengthen the groundwater treatment chemicals industry across both compliance treatment and site remediation.
Complete Report Scope:
- By Chemical Type
- Coagulants and Flocculants
- Oxidants and Disinfectants
- pH Adjusters and Softeners
- Scale and Corrosion Inhibitors
- Adsorbents and Ion-Exchange Chemicals
- Other Chemical Types
- By Application
- Groundwater Remediation
- Drinking Water Treatment
- Industrial Groundwater Treatment
- Agricultural and Irrigation Water Treatment
- Other Applications (Mining, Landfill Leachate and Specialty Applications)
- By Geography
- Asia-Pacific
- China
- India
- Japan
- South Korea
- Rest of Asia-Pacific
- North America
- United States
- Canada
- Mexico
- Europe
- Germany
- United Kingdom
- France
- Italy
- Rest of Europe
- South America
- Brazil
- Argentina
- Rest of South America
- Middle East and Africa
- Saudi Arabia
- South Africa
- Rest of Middle East and Africa
- Asia-Pacific
Geography Analysis
North America held 33.67% of the groundwater treatment chemicals market size in 2025, supported by established Superfund enforcement and a large inventory of legacy industrial sites. The United States remained the main subregional contributor, with demand tied to CERCLA consent decrees, U.S. Army Corps of Engineers (USACE) remediation contracts, and PFAS MCL requirements. Tetra Tech, Inc. was selected in 2026 to design a dedicated PFAS treatment facility in Dayton, Ohio, with a projected construction cost of USD 350 million. Canada contributed demand from mining and oil-sands water management, while Europe had demand centered in Germany, France, and the United Kingdom, where brownfield density and evolving groundwater standards support active remediation.
Asia-Pacific is projected to advance at a 7.58% CAGR through 2031. China's demand is supported by stricter regulation of chlorinated organics and phosphorus discharges, zero-liquid-discharge mandates for lithium battery facilities, and data-center cooling-water requirements. India's Jal Jeevan Mission and water-quality programs are expanding institutional procurement for coagulants, adsorbents, and pH adjustment chemicals. Kurita Water Industries Ltd. reported net sales of JPY 208,970 million (approximately USD 1.39 billion) for the fiscal year ended March 2026. Japan and South Korea support demand from semiconductor and electronics manufacturing, where groundwater treatment requires precise chemical control.
South America is developing from an earlier base, with Brazil and Argentina representing the principal subregional demand centers. Brazil's pulp and paper, mining, and petrochemical activities create groundwater treatment needs, while environmental enforcement is formalizing remediation obligations. In 2025, Solvay and Veolia completed a 10-year industrial water-reuse partnership at Solvay's Santo Andre plant in Brazil, achieving 94% water recycling and saving the equivalent of 133 Olympic swimming pools of freshwater annually. The groundwater treatment chemicals market in the Middle East and Africa has a split demand profile between Gulf-state requirements for scale and corrosion inhibitors and South African mining requirements for heavy-metal removal and tailings-water treatment. Lower regulatory enforcement in both areas continues to limit the urgency-led demand seen in North America and Europe.
- Carus Group Inc.
- DuPont
- Ecolab Inc.
- Evonik Industries AG
- Kemira Oyj
- Kurita Water Industries Ltd.
- Regenesis
- SNF Group
- Solenis
- Solvay
- Veolia
- Xylem
Additional Benefits:
- The market estimate (ME) sheet in Excel format
- 3 months of analyst support
TABLE OF CONTENTS
1 Introduction
- 1.1 Study Assumptions and Market Definition
- 1.2 Scope of the Study
2 Research Methodology
3 Executive Summary
4 Market Landscape
- 4.1 Market Overview
- 4.2 Market Drivers
- 4.2.1 PFAS Compliance and Groundwater Monitoring Expansion
- 4.2.2 Brownfield Redevelopment and Site-Closure Pressure
- 4.2.3 Industrial Legacy Contamination and Liability Allocation
- 4.2.4 In-Situ Treatment Preference Over Excavation and Long-Term Pump-and-Treat
- 4.2.5 Site-Specific Chemistry for Mixed Contaminant Plumes
- 4.2.6 Lower-Waste Passive Sorption and Reactive-Barrier Adoption
- 4.3 Market Restraints
- 4.3.1 Subsurface Heterogeneity and Oxidant Demand
- 4.3.2 PFAS Destruction and Concentrate Disposal Cost
- 4.3.3 Reagent Safety, Handling, and Injection Complexity
- 4.3.4 Variable Regulatory Acceptance of Emerging Chemistries
- 4.4 Value Chain Analysis
- 4.5 Porter's Five Forces Analysis
- 4.5.1 Competitive Rivalry
- 4.5.2 Supplier Power
- 4.5.3 Buyer Power
- 4.5.4 Threat of New Entrants
- 4.5.5 Threat of Substitutes
5 Market Size and Growth Forecasts (Value)
- 5.1 By Chemical Type
- 5.1.1 Coagulants and Flocculants
- 5.1.2 Oxidants and Disinfectants
- 5.1.3 pH Adjusters and Softeners
- 5.1.4 Scale and Corrosion Inhibitors
- 5.1.5 Adsorbents and Ion-Exchange Chemicals
- 5.1.6 Other Chemical Types
- 5.2 By Application
- 5.2.1 Groundwater Remediation
- 5.2.2 Drinking Water Treatment
- 5.2.3 Industrial Groundwater Treatment
- 5.2.4 Agricultural and Irrigation Water Treatment
- 5.2.5 Other Applications (Mining, Landfill Leachate and Specialty Applications)
- 5.3 By Geography
- 5.3.1 Asia-Pacific
- 5.3.1.1 China
- 5.3.1.2 India
- 5.3.1.3 Japan
- 5.3.1.4 South Korea
- 5.3.1.5 Rest of Asia-Pacific
- 5.3.2 North America
- 5.3.2.1 United States
- 5.3.2.2 Canada
- 5.3.2.3 Mexico
- 5.3.3 Europe
- 5.3.3.1 Germany
- 5.3.3.2 United Kingdom
- 5.3.3.3 France
- 5.3.3.4 Italy
- 5.3.3.5 Rest of Europe
- 5.3.4 South America
- 5.3.4.1 Brazil
- 5.3.4.2 Argentina
- 5.3.4.3 Rest of South America
- 5.3.5 Middle East and Africa
- 5.3.5.1 Saudi Arabia
- 5.3.5.2 South Africa
- 5.3.5.3 Rest of Middle East and Africa
- 5.3.1 Asia-Pacific
6 Competitive Landscape
- 6.1 Market Concentration
- 6.2 Strategic Moves
- 6.3 Market Share (%)/Ranking Analysis
- 6.4 Company Profiles (includes Global Overview, Market Overview, Core Segments, Financials as available, Strategic Information, Products and Services, and Recent Developments)
- 6.4.1 Carus Group Inc.
- 6.4.2 DuPont
- 6.4.3 Ecolab Inc.
- 6.4.4 Evonik Industries AG
- 6.4.5 Kemira Oyj
- 6.4.6 Kurita Water Industries Ltd.
- 6.4.7 Regenesis
- 6.4.8 SNF Group
- 6.4.9 Solenis
- 6.4.10 Solvay
- 6.4.11 Veolia
- 6.4.12 Xylem
7 Market Opportunities and Future Outlook
- 7.1 White-Space and Unmet-Need Assessment

 即時廢水監測系統市場:全球市場預測(2026-2032年)重力式撇油器市場:全球市場預測,2026-2032年
 智慧水質監測系統市場預測至2034年-全球分析(按組件、監測參數、連接方式、部署模式、最終用戶和地區分類)智慧水質線上監測系統市場:全球市場預測(2026-2032年)電滲析設備市場:依技術、離子交換、價格、選擇性、容量範圍、應用、最終用戶分類,全球預測,2026-2032年電催化水處理設備市場:依設備類型、電極材料、電源類型、電池配置、容量範圍、應用、終端用戶產業分類,全球預測(2026-2032年)污泥層檢測器市場:依技術、安裝量、最終用戶和應用分類,全球預測(2026-2032年)按分離技術、安裝量、流量、應用和最終用戶分類的聚結式油水分離器市場,全球預測,2026-2032年油水分離器市場按應用、技術、最終用戶、安裝方式、材料、流量和服務類型分類,全球預測(2026-2032年)全球綜合污水處理服務市場(依最終用戶、來源、製程步驟、服務模式和技術分類)預測(2026-2032年)