


 |
市場調查報告書
商品編碼
2154462
視覺品質檢測平台:市場佔有率分析、產業趨勢與統計、成長預測(2026-2031)Visual Quality Inspection Platforms - Market Share Analysis, Industry Trends & Statistics, Growth Forecasts (2026 - 2031) |
||||||

※ 本網頁內容可能與最新版本有所差異。詳細情況請與我們聯繫。
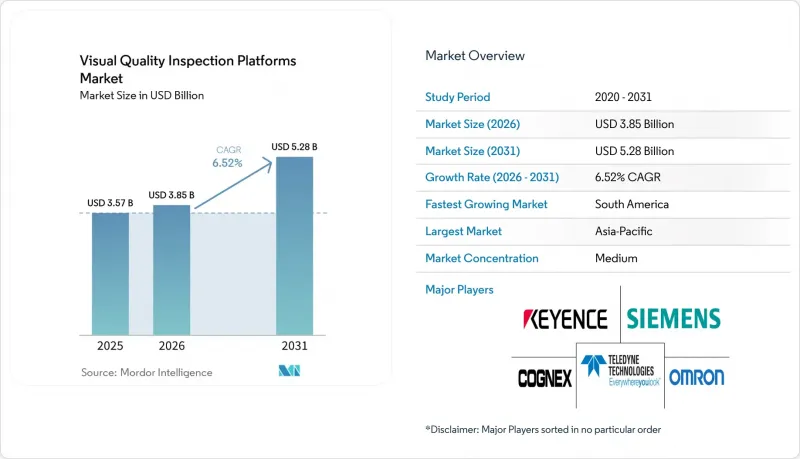
根據 Mordor Intelligence 預測,視覺品質檢測平台的市場規模預計將從 2025 年的 35.7 億美元和 2026 年的 38.5 億美元成長到 2031 年的 52.8 億美元,2026 年至 2031 年的年複合成長率(CAGR)為 6.52%。
全球視覺品質檢測平台市場趨勢與洞察
人工智慧驅動的缺陷檢測與分類
利用深度學習的影像識別模型能夠對多種材料類型的表面缺陷進行分類,精度可達100微米以內。基於規則的系統通常需要在產品、材料或光照條件改變時進行手動調整。 2026年發表在《科學報告》(Scientific Reports)上的一項研究表明,多尺度上下文檢測架構在工業缺陷基準測試中能夠達到超過95%的mAP50分數,同時每秒處理超過100幀。這種性能使其能夠在對延遲接受度嚴格的生產線上實現即時應用。隨著製造商能夠將現有檢測系統擴展到新的SKU(庫存單位),同時最大限度地減少標籤更換週期,視覺品質檢測平台市場正從中受益。 2025年一項關於CLIP-MDC架構的研究報告稱,其在MVTec AD資料集上的AUROC為99.9%,平均推理速度為6.6毫秒,這表明更高的推理速度和準確性能夠支持頻繁的產品切換。
電動車和電池製造中的品質要求
電池製造需要嚴格控制黏合、密封、組裝和熱工條件。這是因為成品電池組中的缺陷組件可能導致嚴重的安全問題。電芯連接器故障的處理方式與典型的動力傳動系統缺陷截然不同,未被發現的問題會增加熱失控、產品召回和法律責任的風險。阿特拉斯·科普柯的 VisionTools 解決方案可在電池生產線的黏合、密封和組裝過程中提供基於人工智慧的檢驗,並透過其異常檢測功能支援生產過程中的糾正措施。由 V60 軟體驅動的高級驗證功能也支援電芯模組的熱分析。一項關於鋰離子軟包電池雷射焊接的研究發現,基於合成資料訓練的人工智慧分類器達到了 0.94 的準確率和 0.98 的召回率。隨著電池製造商在大規模生產中需要可追溯的檢驗記錄,結合2D、3D和熱成像的檢測方法在這些應用中的重要性日益凸顯。
訓練資料和模型檢驗的成本
生產級人工智慧檢測模型需要針對每個相關缺陷類別進行標註,這對於沒有系統影像存檔的公司來說可能是一個挑戰。一項2025年關於工業缺陷檢測中主動學習的研究發現,即使採用混合採樣技術,也需要超過2400個涵蓋所有缺陷類別的標註樣本才能獲得具有競爭力的F1分數。收集和標註如此龐大的資料量可能需要數週時間,之後才能開始檢驗。此外,每當生產線、照明條件或材料供應商發生變化時,都需要迭代模型檢驗。這些要求可能導致概念驗證(PoC)專案在高混合生產工廠中超出初始成本和實施進度。雖然合成資料是一個可行的選擇,但對於細微的表面紋理,其可靠性較低,因為模擬影像和實際生產影像之間容易出現差異。
細分市場分析
到2025年,整合式AI視覺系統將佔銷售額的41.83%,在商用領域中佔據領先地位。當買家無法容忍冗長的設定流程或生產線上職責不清的情況時,他們會傾向於選擇軟硬體結合的客製化產品。單一供應商即可提供攝影機、光學元件、照明設備、控制器、軟體和技術支援。這種模式降低了高產能生產線製造商的部署風險。現有硬體客戶通常無需更換安裝支架、線路或照明設備即可升級至AI系統。這種升級路徑有助於現有設備供應商續約。同時,也使得僅提供軟體的供應商難以在單一採購週期內取代現有系統。當客戶尋求預先定義的檢測系統而非單獨組裝的解決方案時,整合產品仍然至關重要。對於那些在視覺品質檢測平台市場中優先考慮部署確定性而非組件級選擇的買家而言,這一趨勢提供了一個切實可行的切入點。
對於擁有現有相機基礎設施的製造商而言,獨立的人工智慧軟體仍然極具價值。這些買家無需更換運作良好的工業相機及相關設備,即可增加推理功能。人工智慧檢測服務包括模型訓練、部署支援、最佳化和營運管理。這些服務在製藥、食品安全和受監管電子產業尤其有用,因為這些產業的內部團隊可能缺乏機器學習的營運能力。隨著多工廠製造商對集中式模型管治的需求日益成長,人工智慧視覺平台和應用程式介面(API)預計到2031年將以8.27%的複合年成長率成長。康耐視在與100多家客戶進行beta測試後,於2026年5月正式發表了OneVision。據康耐視稱,Essity僅用不到一天的時間就建立了一個密封檢測應用程式,而他們使用傳統流程則需要一年多的迭代。同時,Schneider Electric報告稱,集中部署後良率加倍。這些案例表明,隨著檢測項目擴展到多個工廠,該平台的重要性日益凸顯。
到2025年,邊緣人工智慧或嵌入式人工智慧將佔銷售額的56.92%。高速生產線通常需要在50毫秒內做出合格/不合格的判斷。此外,本地處理避免了對不間斷網路連線的依賴,這可能無法滿足工廠的運作要求。亞太和歐洲的資料處理法規可能會限制將生產影像傳輸到外部雲端基礎設施。這些情況有利於在攝影機上或生產線附近進行推理的系統。邊緣部署還允許將敏感的產品影像保留在工廠內部。這種方法尤其適用於響應速度和本地資料管理都至關重要的應用。這也解釋了為什麼儘管雲端工具普及,嵌入式系統仍然很常見。隨著客戶在本地控制和集中管理之間權衡,這項需求將繼續影響視覺品質檢測平台市場。
在半導體晶圓檢測和航太表面分析領域,本地伺服器和工作站仍然被廣泛使用。這些應用場景所需的處理能力遠超嵌入式控制器,同時也需要對高度敏感的影像進行本地管理。預計到2031年,雲和SaaS將以9.12%的複合年成長率成長,主要用於模型訓練、影像標註、版本控制以及所有設備的更新。Panasonic控股公司於2026年3月開始在全球授權其人工智慧平台“視覺檢測人工智慧平台”,提供本地部署、雲端和混合部署配置。該平台包含基於區塊鏈的資料完整性管理功能,可透過監控支援模型開發。根據國際機器人聯合會(IFR)的數據,到2024年,全球工業機器人部署數量已達到54.2萬台,擴大了可進行模型更新管理的終端部署基礎。因此,雲端工具可以支援生命週期管理,而無需對所有應用程式進行基於雲端的運行時檢測。
區域分析
預計到2025年,亞太地區將佔據視覺品質檢測平台市場39.12%的佔有率。該地區擁有重要的電子和半導體供應鏈,以及電動車電池生產能力和成熟的工廠自動化體系。中國、韓國和日本是這項需求的核心,因為它們的製造業擁有高產量、對品質要求極高的生產線。 2026年1月,中國工業和資訊化部聯合七個相關部委發布了“AI+製造行動計劃”,其中包括500個AI檢測應用場景和1000個高性能工業AI代理的目標。以日本為例,大發汽車和VRAIN Solution的共同開發和實施案例表明,客製化系統和智慧財產權在日本備受重視。韓國的顯示器和半導體產業基礎、印度的電子產品生產連結獎勵計畫計畫以及澳洲的精密製造業活動,正在推動該地區除主要市場之外的其他市場對AI檢測平台的需求成長。這些因素共同確保亞太地區在視覺品質檢測平台市場繼續佔據中心地位,因為供應商正在開發用於大批量、品質敏感型製造的系統。
以銷量計算,北美和歐洲分別是第二和第三大區域市場。在北美,航太和國防製造商越來越重視可審計系統,以確保受管資訊始終在既定的IT邊界內。 2025年11月,美國國防部在《國防採購補充規則》(DFARS)中正式採納了CMMC 2.0,2026年11月,強制性第三方評估將進入下一階段。這些要求可能會推動國防供應鏈對本地檢測架構的需求。在歐洲,先進的汽車、精密機械和製藥製造與連網工業設備的網路安全要求相結合。大眾汽車集團於2025年擴大了其「數位化生產平台」合作夥伴關係,而奧迪的IRIS檢測系統於2026年部署到大眾汽車集團的10個工廠。此次部署是在獲得VDA QMC 5 Part 3認證後進行的,涵蓋了組裝、電池生產、物流和沖壓工廠的運作。
儘管南美洲的普及率較低,但預計到2031年,該地區的複合年成長率將達到8.06%,成為該地區成長最快的地區。巴西的汽車組裝活動、電子產業的投資以及近岸外包趨勢是推動需求的主要因素。與全球原始設備製造商 (OEM) 合作的供應商越來越需要滿足北美和歐洲專案中採用的檢驗標準。在中東和非洲,該技術的應用仍處於起步階段。沙烏地阿拉伯的「2030願景」計畫正在刺激石化和加工產業的工業投資,而表面和焊接檢驗在這些產業中發揮著重要作用。阿拉伯聯合大公國以人工智慧為重點的產業戰略正在支持電子和製藥製造群的自動化檢驗。在非洲,需求集中在南非的汽車產業叢集,在那裡,視覺檢測能力對於供應商持續參與專案審核至關重要。
其他好處:
- Excel格式的市場預測(ME)表
- 3個月的分析師支持
目錄
第1章:引言
- 研究假設和市場定義
- 調查範圍
第2章:調查方法
第3章執行摘要
第4章 市場狀況
- 市場概覽
- 市場促進因素
- 人工智慧驅動的缺陷檢測與分類
- 電動車和電池製造中的品質要求
- 降低人工智慧運算成本
- 品管營運部門人手不足
- 工廠數位化和對工業4.0的投資
- 監管可追溯性和驗證要求
- 市場限制因素
- 訓練資料和模型檢驗的成本
- 將傳統自動化系統與MES系統整合的複雜性。
- 雲端資料主權與工業網路安全風險
- 高混合、低產量生產中的模型漂移
- 產業價值鏈分析
- 監理情勢
- 技術展望
- 波特五力分析
第5章 市場規模與成長預測
- 按商業外形尺寸
- 整合人工智慧視覺系統
- 獨立人工智慧軟體
- AI視覺平台與API
- 人工智慧檢測服務
- 依部署架構
- 邊緣人工智慧或嵌入式人工智慧
- 本地伺服器或工作站
- 雲或SaaS
- 透過測試方法
- 2D影像檢查
- 3D成像檢查
- 頻譜和高光譜遙測檢測
- 利用熱成像和特殊成像技術進行檢查
- 報價
- 硬體
- 軟體
- 服務
- 按最終用戶行業分類
- 電子和半導體
- 電動車和電池製造
- 藥品和醫療設備
- 食品/飲料
- 車
- 航太/國防
- 金屬和機械
- 其他終端用戶產業
- 按地區
- 北美洲
- 美國
- 加拿大
- 墨西哥
- 南美洲
- 巴西
- 其他南美國家
- 歐洲
- 德國
- 英國
- 法國
- 義大利
- 俄羅斯
- 其他歐洲國家
- 亞太地區
- 中國
- 日本
- 韓國
- 印度
- 澳洲
- 其他亞太國家
- 中東
- 沙烏地阿拉伯
- 阿拉伯聯合大公國
- 土耳其
- 其他中東國家
- 非洲
- 南非
- 其他非洲國家
- 北美洲
第6章 競爭情勢
- 市場集中度
- 策略趨勢
- 市佔率分析
- 公司簡介
- Cognex Corporation
- Keyence Corporation
- Teledyne Technologies Incorporated
- OMRON Corporation
- Siemens AG
- Basler AG
- SICK AG
- Datalogic SpA
- Zebra Technologies Corporation
- MVTec Software GmbH
- Landing AI, Inc.
- Instrumental, Inc.
- Robovision NV
- Qualitas Technologies Pvt Ltd
- Nanotronics Imaging, Inc.
- ISRA VISION GmbH
- LMI Technologies Inc.
- Allied Vision Technologies GmbH
- Baumer Holding AG
- Pleora Technologies Inc.
- Visionary.ai Ltd.
第7章 市場機會與未來展望
According to Mordor Intelligence, the visual quality inspection platforms market size is projected to expand from USD 3.57 billion in 2025 and USD 3.85 billion in 2026 to USD 5.28 billion by 2031, registering a CAGR of 6.52% between 2026 and 2031.
Global Visual Quality Inspection Platforms Market Trends and Insights
AI-Based Defect Detection and Classification
Deep-learning vision models can classify surface defects at sub-100-micrometer tolerances across several material types. Rule-based systems often need manual recalibration when products, materials, or lighting conditions change. A 2026 Scientific Reports study found that multi-scale contextual detection architectures achieved mAP50 scores above 95% on industrial defect benchmarks while processing more than 100 frames per second. This performance supports real-time use on factory lines with limited latency tolerance. The visual quality inspection platforms market benefits because manufacturers can extend an existing inspection setup to new stock-keeping units with fewer relabeling cycles. A 2025 study of the CLIP-MDC architecture reported 99.9% AUROC on the MVTec AD dataset and an average inference speed of 6.6 milliseconds, showing how faster inference and improved accuracy can support high-frequency product changeovers.
EV and Battery Manufacturing Quality Requirements
Battery manufacturing requires close control of joining, sealing, assembly, and thermal conditions because a defective component can reach a finished pack with serious safety consequences. A faulty cell connector cannot be treated like an ordinary powertrain defect, and an undetected issue can raise the risk of thermal runaway, recall activity, and liability. Atlas Copco's VisionTools offering uses AI-based verification for battery-line joining, sealing, and assembly steps, with anomaly detection supporting corrective action during production. Its Advanced Verification with V60 software also supports thermal profiling of cell modules. Research on lithium-ion pouch-cell laser welds found that an AI classifier trained with synthetic data achieved precision of 0.94 and recall of 0.98. These uses make combined 2D, 3D, and thermal inspection more relevant as battery manufacturers require traceable inspection records for high-volume production.
Training-Data and Model-Validation Costs
Production-grade AI inspection models need labeled images for each relevant defect class, which can be difficult for companies without systematic image archives. A 2025 study on active learning for industrial defect detection found that competitive F1 scores required more than 2,400 labeled samples across defect classes, even when hybrid sampling methods were used. Collecting and labeling this volume can take weeks before validation begins. Model validation must also be repeated after a line change, different lighting, or a material supplier change. These requirements can leave high-mix facilities with proof-of-concept projects that exceed their original budget or deployment schedule. Synthetic data can help, but it is less dependable for subtle surface textures where simulated images differ from actual production images.
Other drivers and restraints analyzed in the detailed report include:
- Falling Edge AI Compute Costs
- Labor Shortages in Quality Operations
- Legacy Automation and MES Integration Complexity
For complete list of drivers and restraints, kindly check the Table Of Contents.
Segment Analysis
Integrated AI vision systems held 41.83% of revenue in 2025, giving them the leading commercial form-factor position. Buyers favor purpose-built hardware-and-software combinations when a production line cannot tolerate prolonged configuration work or unclear accountability. A single supplier can provide the camera, optics, lighting, controller, software, and technical support. This structure helps manufacturers reduce deployment risk on high-throughput lines. Existing hardware customers can often upgrade to AI-capable systems without replacing mounting equipment, cabling, or lighting. That upgrade path supports renewals for established equipment suppliers. It also makes it harder for software-only vendors to replace an installed system in a single purchasing cycle. Integrated products remain important where the customer wants a defined inspection system rather than a separately assembled solution. This preference gives the visual quality inspection platforms market a practical entry route for buyers that prioritize deployment certainty over component-level choice.
Standalone AI software remains relevant for manufacturers with serviceable camera infrastructure. These buyers can add inference capability without replacing working industrial cameras and related equipment. AI inspection services include model training, deployment support, optimization, and managed operations. These services are useful in pharmaceutical, food safety, and regulated electronics settings where internal teams may not have machine-learning operations capability. AI vision platforms and APIs are projected to expand at an 8.27% CAGR through 2031 as multi-site manufacturers seek centralized model governance. Cognex made OneVision generally available in May 2026 after beta testing with more than 100 customers. The company reported that Essity built a sealing inspection application in less than 1 day, compared with an earlier process that took more than 1 year of iteration, while Schneider Electric reported a doubling of yield after a centralized deployment. These cases show why platforms are becoming increasingly important as inspection programs expand across multiple plants.
Edge or embedded AI accounted for 56.92% of revenue in 2025. Fast production lines often require pass-or-fail decisions in less than 50 milliseconds. Local processing also avoids dependence on uninterrupted internet connectivity, which may not meet factory uptime requirements. Data-handling rules in Asia-Pacific and Europe can limit the transfer of production images to outside cloud infrastructure. These conditions favor systems that execute inference at the camera or near the line. Edge installations can also keep sensitive product images inside the facility. This approach is particularly suitable for applications where response speed and local data control are both essential. It explains why embedded systems remain common despite the growth of cloud tools. This requirement continues to shape the visual quality inspection platforms market as customers compare local control with centralized management.
On-premise servers and workstations continue to serve semiconductor wafer inspection and aerospace surface analysis. These use cases may need more processing capacity than an embedded controller can provide, while still requiring local control of sensitive images. Cloud or SaaS is projected to expand at a 9.12% CAGR through 2031, mainly for model training, image annotation, version control, and fleet-wide updates. Panasonic Holdings began global licensing of its AI Platform for Visual Inspection in March 2026, offering on-premises, cloud, and hybrid configurations. The platform includes blockchain-based data integrity management and supports model development through monitoring. The International Federation of Robotics reported 542,000 industrial robot installations worldwide in 2024, creating a growing installed base of potential endpoints for managed model updates. Cloud tools can therefore support lifecycle management without requiring cloud-based runtime inspection for every application.
Complete Report Scope:
- By Commercial Form Factor
- Integrated AI Vision Systems
- Standalone AI Software
- AI Vision Platform and API
- AI Inspection Services
- By Deployment Architecture
- Edge or Embedded AI
- On-Premise Server or Workstation
- Cloud or SaaS
- By Inspection Modality
- 2D Imaging Inspection
- 3D Imaging Inspection
- Multispectral and Hyperspectral Inspection
- Thermal and Specialty Imaging Inspection
- By Offering
- Hardware
- Software
- Services
- By End-user Industry
- Electronics and Semiconductor
- EV and Battery Manufacturing
- Pharmaceutical and Medical Devices
- Food and Beverage
- Automotive
- Aerospace and Defense
- Metals and Machinery
- Other End-user Industries
- By Geography
- North America
- United States
- Canada
- Mexico
- South America
- Brazil
- Rest of South America
- Europe
- Germany
- United Kingdom
- France
- Italy
- Russia
- Rest of Europe
- Asia-Pacific
- China
- Japan
- South Korea
- India
- Australia
- Rest of Asia-Pacific
- Middle East
- Saudi Arabia
- United Arab Emirates
- Turkey
- Rest of Middle East
- Africa
- South Africa
- Rest of Africa
- North America
Geography Analysis
Asia-Pacific held 39.12% of the visual quality inspection platforms market share in 2025. The region combines major electronics and semiconductor supply chains with EV battery capacity and established factory automation. China, South Korea, and Japan are central sources of demand because their manufacturing sectors operate high-volume, quality-sensitive production lines. In January 2026, China's Ministry of Industry and Information Technology and 7 co-ministries issued the AI Plus Manufacturing Action Plan. The plan includes targets for 500 benchmark AI inspection application scenarios and 1,000 high-performance industrial AI agents. Japan's pattern emphasizes customized systems and intellectual-property ownership, as shown by Daihatsu's jointly developed deployment with VRAIN Solution. South Korea's display and semiconductor base, India's electronics production-linked incentive program, and Australia's precision manufacturing activity extend the region's demand beyond its largest markets. Together, these conditions keep Asia-Pacific central to the visual quality inspection platforms market as suppliers develop systems for high-volume and quality-sensitive manufacturing.
North America and Europe are the second- and third-largest regional revenue pools. In North America, aerospace and defense manufacturers are placing greater emphasis on auditable systems that keep controlled information within defined IT boundaries. The U.S. Department of Defense formalized CMMC 2.0 in the Defense Federal Acquisition Regulation Supplement in November 2025, with mandatory third-party assessment requirements entering a further phase in November 2026. These requirements can support demand for on-premise inspection architectures in defense supply chains. Europe combines advanced automotive, precision machinery, and pharmaceutical manufacturing with cybersecurity requirements for connected industrial equipment. Volkswagen Group extended its Digital Production Platform collaboration in 2025, while Audi's IRIS inspection system was being rolled out to 10 Volkswagen Group locations in 2026. The rollout covers assembly, battery production, logistics, and press shop operations following qualification under VDA QMC 5 Part 3.
South America is projected to record the fastest regional CAGR of 8.06% through 2031, although it starts from a smaller installed base. Brazil's automotive assembly activity, electronics investment, and nearshoring trends are the main drivers of demand. Suppliers working with global OEMs increasingly need to meet the inspection standards used in North American and European programs. The Middle East and Africa remain at earlier stages of adoption. Saudi Arabia's Vision 2030 program is directing industrial investment toward petrochemical and process applications where surface and weld inspection can be useful. The UAE's AI-focused industrial strategy is supporting the automation of inspections in electronics and pharmaceutical manufacturing clusters. In Africa, demand is concentrated in South Africa's automotive cluster, where supplier audits can make visual inspection capabilities important for ongoing program participation.
- Cognex Corporation
- Keyence Corporation
- Teledyne Technologies Incorporated
- OMRON Corporation
- Siemens AG
- Basler AG
- SICK AG
- Datalogic S.p.A.
- Zebra Technologies Corporation
- MVTec Software GmbH
- Landing AI, Inc.
- Instrumental, Inc.
- Robovision NV
- Qualitas Technologies Pvt Ltd
- Nanotronics Imaging, Inc.
- ISRA VISION GmbH
- LMI Technologies Inc.
- Allied Vision Technologies GmbH
- Baumer Holding AG
- Pleora Technologies Inc.
- Visionary.ai Ltd.
Additional Benefits:
- The market estimate (ME) sheet in Excel format
- 3 months of analyst support
TABLE OF CONTENTS
1 INTRODUCTION
- 1.1 Study Assumptions and Market Definition
- 1.2 Scope of the Study
2 RESEARCH METHODOLOGY
3 EXECUTIVE SUMMARY
4 MARKET LANDSCAPE
- 4.1 Market Overview
- 4.2 Market Drivers
- 4.2.1 AI-Based Defect Detection and Classification
- 4.2.2 EV and Battery Manufacturing Quality Requirements
- 4.2.3 Falling Edge AI Compute Costs
- 4.2.4 Labor Shortages in Quality Operations
- 4.2.5 Factory Digitalization and Industry 4.0 Investment
- 4.2.6 Regulatory Traceability and Validation Requirements
- 4.3 Market Restraints
- 4.3.1 Training-Data and Model-Validation Costs
- 4.3.2 Legacy Automation and MES Integration Complexity
- 4.3.3 Cloud Data Sovereignty and Industrial Cybersecurity Exposure
- 4.3.4 Model Drift in High-Mix, Low-Volume Production
- 4.4 Industry Value-Chain Analysis
- 4.5 Regulatory Landscape
- 4.6 Technological Outlook
- 4.7 Porter's Five Forces Analysis
- 4.7.1 Bargaining Power of Suppliers
- 4.7.2 Bargaining Power of Buyers
- 4.7.3 Threat of New Entrants
- 4.7.4 Threat of Substitutes
- 4.7.5 Intensity of Competitive Rivalry
5 MARKET SIZE AND GROWTH FORECASTS (VALUE)
- 5.1 By Commercial Form Factor
- 5.1.1 Integrated AI Vision Systems
- 5.1.2 Standalone AI Software
- 5.1.3 AI Vision Platform and API
- 5.1.4 AI Inspection Services
- 5.2 By Deployment Architecture
- 5.2.1 Edge or Embedded AI
- 5.2.2 On-Premise Server or Workstation
- 5.2.3 Cloud or SaaS
- 5.3 By Inspection Modality
- 5.3.1 2D Imaging Inspection
- 5.3.2 3D Imaging Inspection
- 5.3.3 Multispectral and Hyperspectral Inspection
- 5.3.4 Thermal and Specialty Imaging Inspection
- 5.4 By Offering
- 5.4.1 Hardware
- 5.4.2 Software
- 5.4.3 Services
- 5.5 By End-user Industry
- 5.5.1 Electronics and Semiconductor
- 5.5.2 EV and Battery Manufacturing
- 5.5.3 Pharmaceutical and Medical Devices
- 5.5.4 Food and Beverage
- 5.5.5 Automotive
- 5.5.6 Aerospace and Defense
- 5.5.7 Metals and Machinery
- 5.5.8 Other End-user Industries
- 5.6 By Geography
- 5.6.1 North America
- 5.6.1.1 United States
- 5.6.1.2 Canada
- 5.6.1.3 Mexico
- 5.6.2 South America
- 5.6.2.1 Brazil
- 5.6.2.2 Rest of South America
- 5.6.3 Europe
- 5.6.3.1 Germany
- 5.6.3.2 United Kingdom
- 5.6.3.3 France
- 5.6.3.4 Italy
- 5.6.3.5 Russia
- 5.6.3.6 Rest of Europe
- 5.6.4 Asia-Pacific
- 5.6.4.1 China
- 5.6.4.2 Japan
- 5.6.4.3 South Korea
- 5.6.4.4 India
- 5.6.4.5 Australia
- 5.6.4.6 Rest of Asia-Pacific
- 5.6.5 Middle East
- 5.6.5.1 Saudi Arabia
- 5.6.5.2 United Arab Emirates
- 5.6.5.3 Turkey
- 5.6.5.4 Rest of Middle East
- 5.6.6 Africa
- 5.6.6.1 South Africa
- 5.6.6.2 Rest of Africa
- 5.6.1 North America
6 COMPETITIVE LANDSCAPE
- 6.1 Market Concentration
- 6.2 Strategic Moves
- 6.3 Market Share Analysis
- 6.4 Company Profiles (includes Global Level Overview, Market Level Overview, Core Segments, Financials as available, Strategic Information, Market Rank/Share, Products and Services, Recent Developments)
- 6.4.1 Cognex Corporation
- 6.4.2 Keyence Corporation
- 6.4.3 Teledyne Technologies Incorporated
- 6.4.4 OMRON Corporation
- 6.4.5 Siemens AG
- 6.4.6 Basler AG
- 6.4.7 SICK AG
- 6.4.8 Datalogic S.p.A.
- 6.4.9 Zebra Technologies Corporation
- 6.4.10 MVTec Software GmbH
- 6.4.11 Landing AI, Inc.
- 6.4.12 Instrumental, Inc.
- 6.4.13 Robovision NV
- 6.4.14 Qualitas Technologies Pvt Ltd
- 6.4.15 Nanotronics Imaging, Inc.
- 6.4.16 ISRA VISION GmbH
- 6.4.17 LMI Technologies Inc.
- 6.4.18 Allied Vision Technologies GmbH
- 6.4.19 Baumer Holding AG
- 6.4.20 Pleora Technologies Inc.
- 6.4.21 Visionary.ai Ltd.
7 MARKET OPPORTUNITIES AND FUTURE OUTLOOK
- 7.1 White-Space and Unmet-Need Assessment

 超音波遠程水錶市場:全球市場預測,2026-2032年封閉回路型單病種品管市場:全球市場預測(2026-2032年)熔體流動速率測試儀市場:全球市場預測,2026-2032年
 食品品質改良劑市場規模、佔有率和成長分析:按產品類型、應用、原料、最終用戶、劑型和地區分類-2026-2033年產業預測工業人工智慧離線品質檢測系統市場:全球市場預測(2026-2032年)
 工業微生物品管(QC)市場規模、佔有率和成長分析:按服務類型、測試類型、技術、最終用途產業和地區分類-2026-2033年產業預測
 2026年全球航太品質檢測軟體市場報告
 2026-2030年全球自動化工業品管(QC)市場
 人工智慧在製造業品管領域的市場:2034 年預測——按組件、技術、部署模式、品管應用、最終用戶和地區分類的全球分析工業自動化品管市場:按組件、技術類型、部署模式、最終用戶產業和應用分類-2026-2032年全球市場預測